MUTATION AND CAREER DEVELOPMENT TO
THE PERFORMANCE OF STRUCTURAL OFFICIALS
Case Study of Karawang Government
NENENG SOFIYANTI AND DIAN HAKIP NURDIANSYAH
Faculty of Economic and Business Singaperbangsa Karawang UniversityMutation and career development in Karawang Municipality is implemented in the hope to improve the performance of its employee. The purpose of this research
wash to determine, review and analysis how much the effect of mutation and career
development partially and simultaneously to the Performance of Echelon Structural
Officer IV in the Governement of Karawang Municipality. The number of samples were 250 people, with the sampling technique of Proportionate Stratified Random Sampling and data was analyzed by using descriptive and verificative methods (Path
Analysis). The research results indicates that descriptively, mutationis responded as strongly agree and agree in accordance with each indicator of purpose. The imple-mentation of career development is responded as strongly agree and agree in
ac-cordance with the indicator of interest and satisfaction.The performance of official is responded as well for all indicators of the fulfillment of all necessary resources. Verificatively, the direct partial effect between mutation and official performance is on a low scare (R = 0.215) while the indirect effect is on a very low scale (R = 0.196). In the hypothesis testing, it was discovered that there is a significant relationship.
INTRODUCTION
Organization and Human Resources have an inseparable relationship. Organization without HR will not run. It was stated by HadariNawawi (2006 : 7) that organization is human with all its
uniqueness and complexity, without human there
will be no organization. HadariNawawi (2006 : 48) explained that the role of HR performance is very important in mobilizing other resources (material, financial, information and technology) to increase the contribution in an effort to achieve
the purpose of organization/company, which must
be managed by professional HR management.
To improve performance analysis, Hadari
Nawawi (2006 : 55-61) described that the HR
management activity called the totality of HR management activities, which include: Job anal
-ysis, HR Planning, Recruitment, Selection and
Placement, Orientation and Training, Planning,
Career Guidance and Development, Performance
Evaluation, and Compensation.
Public Organizations such as government
agencies have the task of organizing the
govern-ment wheels and developgovern-ment in an effort to pro
-vide services and prosper the community. In con -ducting the task, apparatus resources are a very important asset. Civil Servants as a government apparatus is the implementer of all government policies and is the executor and manager of
re-sources owned by the state and government. Public expectation on the progress of govern -ment policies imple-mentation and develop-ment to serve and prosper the people, are very high. That expectation is not an easy task. These expectations
can only be realized with the performance of good
government institutions with a high commitment to provide maximum services to the community.
Government performance is derived from the per -formance of its employees in line with the vision and mission of government organizations where they work.
Karawang Municipality government has a goal
that is basically the same as other government in
-stitutions, which is to provide the best services for
the community and to prosper them. The vision of Karawang Municipality government for the period
of 2011-2015 is “The Prosper Karawang Based on Equitable Development Based on Faith and Piety”. In achieving the vision and mission should be sup
-ported by professional employees who ensure the achievement of the best performance, especially structural officials as managerial level that control
and implement the activities program in order to achieve the vision and mission of Karawang
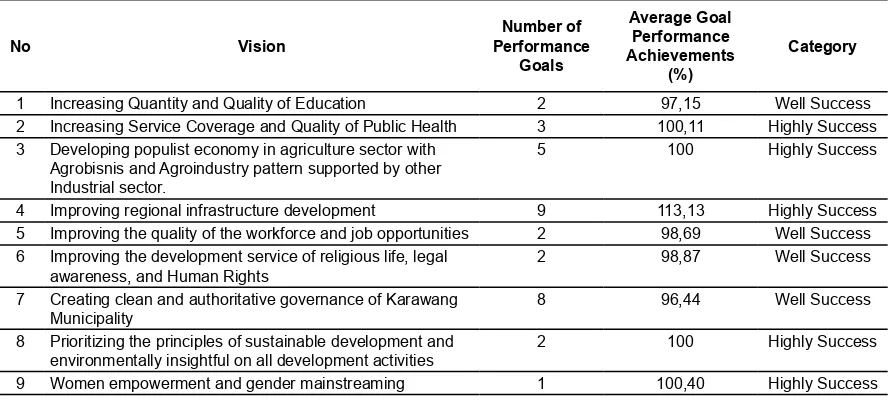
Mu-nicipality Government. The following is the table of performance result of Government Institutions of Karawang Municipality based on Performance Accountability Report of Government Institution (LAKIP) in 2010 and 2011.
Table 1
Performance Achievement of Goals of Karawang Municipality Government in 2010 Based on the Grouping of 9 (Nine) Missions
No Vision
1 Increasing Quantity and Quality of Education 2 97,15 Well Success 2 Increasing Service Coverage and Quality of Public Health 3 100,11 Highly Success 3 Developing populist economy in agriculture sector with
Agrobisnis and Agroindustry pattern supported by other Industrial sector.
5 100 Highly Success
4 Improving regional infrastructure development 9 113,13 Highly Success 5 Improving the quality of the workforce and job opportunities 2 98,69 Well Success 6 Improving the development service of religious life, legal
awareness, and Human Rights
2 98,87 Well Success
7 Creating clean and authoritative governance of Karawang Municipality
8 96,44 Well Success
8 Prioritizing the principles of sustainable development and environmentally insightful on all development activities
2 100 Highly Success
9 Women empowerment and gender mainstreaming 1 100,40 Highly Success
In the structure of Government Institutions
of Karawang Municipality, structural position
consists of 3 levels of echelon II, echelon III and echelon IV. The higher the echelon, the higher the
managerial level and the lower the operational/
technical level. Echelon IV officials as the lowest
level have an important role in achieving the
tar-gets of the activities, because in addition to tech -nically mastering their work, there are also mana-gerial activities which should manage the activity
program as well as possible including managing and controlling their subordinate/staff. If officials
in this level do not perform well, they will greatly
affect the overall performance of the organization. The civil servant who holds the echelon IV structural position is the beginning of a career lad -der to pursue/achieve a higher structural career. The success shown in good performance at this
level of position will greatly affect the journey and subsequent career enhancement. One of the guid
-ance and development efforts in order to produce a positive Echelon IV Structural Official’s perfor
-mance is by carrying out employee mutation and career development. Mutationis the embodiment
of organizational dynamics that serve as one way to achieve the organizational goals. Employee
mu-tation including the mumu-tationof structural officials
in addition to improving morale can also provide opportunities for Employees to further improve their performance. This is similar to the
explana-tion by BambangWahyudi (2003: 167) that: “A
personal mutation will open up opportunities for
competition in improving job performance. Every member of the organization has equal opportunity to achieve a higher position/job/work”.
Another effort that needs to be done in improv -ing employee performance is through employee
career development. MiekaKurnia (2001:61) states that “career development for employees is very important because employees will feel helped
in working and achieving their careers, then will always improve their morale and commitment to the organization, thus encouraging their work per-formance.
In Karawang Municipality Government, over
duty and mutation of position are often conducted
to refresh the organization for better performance of government implementation. In order for a ca
-reer journey to be in line with expectations, em -ployees must maintain and develop the quality of
self in carrying out every job, because competition
of pursuing career is very competitive. According
to Sondang P. Siagian (2008:206) “work perfor -mance, experience, training and development turn out to play an important role in taking various
ca-reer paths that can be taken by someone”. Further
-more Sondang P. Siagian (2008:206) explains that
in order to know the career pattern that is open to him, an employee needs to understand three
things. First, is the career goal to be achieved in
the sense of the highest level of position that may
be achieved if he is able to work productively, loy
-al to the organization, showing function-al behav
-ior and able to grow. Second, is career planning in the sense of one’s involvement in his selection of
the path and career goals. Third, the willingness to take the necessary steps in order for career devel-opment while working.
A good career journey is expected by all em -ployees. A good career will provide the
advan-tages of both material and non-material aspects as described above. In Karawang Municipality government, structural officials will get job al
-lowance. The purpose of this research was first, to
determine, analyze and examine how the
imple-mentation of mutation of echelon IV structural of
-ficials in the Karawang Municipality Government.
Second, analyze and study how the
implementa-tion of career development of echelon IV structur
-al offici-als in KarawangMunicip-ality government.
Third, analyze and study how the performance of
echelon IV structural officials in KarawangMu
-nicipality government. Fourth, analyze and study how much mutationand career development effect the performance of echelon IV structural officials
in KarawangMunicipality government either par-tially or simultaneously.
LITERATURE REVIEW
Human Resource Management
Human Resource Management is one of the
areas of general management covering the aspects of planning, organizing, implementing and
con-trolling.”
Bambangwahyudi (2002:10) stated that: “Human Resource Management is the withdrawal selec -tion, acceptance, development and utilization of human resources in order to achieve the goals of
both individuals and organizations.”
Human resources within a government organi-zation are the resources of the apparatusor civil
servant. In Law No. 43 of 1999 on the Amend
-ment to Law No. 8 of 1974 defines the manage -ment of civil servants. According to the law, the management of Civil Servants, namely the overall
efforts to improve the efficiency, effectivity and
professionalism degree of the implementation of
personnel tasks, functions and obligation, which
include planning, procurement, quality develop-ment, placedevelop-ment, promotion, payroll, welfare, and dismissal.
From the above understanding, it can be con -cluded that human resource management is a sci-ence and art of organizing and utilizing human
potentials effectively and efficiently to achieve
organizational goals.
Mutation Theory
According to Henry Simamora (2004:640) stated that: “Mutation is the migration of an em
-ployee from one job to another which salaries, re
-sponsibilities, and organizational ladder are rela
-tively similar.”
According to BambangWahyudi (2003: 166), the definition of mutation is: “Personal muta
-tion of posi-tion or Personal Muta-tion defined as
a change position or post or work or workplace of manpower conducted either vertically or
hori-zontally”
The Purpose of Mutation
According to BambangWahyudi (2003:167), the purpose of mutation is first, to create a balance between the manpower with the existing position
in the organization, so as to ensure the
occur-rence of stable employment conditions (personal stable). Stability of employment will be realized
if the placement of manpower in an organization
can be conducted properly (The Right Man on the Right job). Second, it opens the opportunity
to develop a career. Third, expand and increase knowledge. Extending insight and knowledge is
a necessity that needs attention in an organization.
Fourth, eliminate the boredom of a position. Fifth,
give rewards to work performance. Sixth, open the
opportunity for competition in improving job per
-formance. Each member of the organization has
equal opportunity to attain a higher position or oc-cupation. The last is the implementation of
sanc-tions against violasanc-tions. It must be done as care
-fully and properly as possible. This is needed to be done, because if the consideration is less careful,
itmay lead to the decline of morale of the person concerned.
Definition of Career
Sedarmayanti (2010: 121) describes several definitions of career as follows:
1. A series of separate but related work activities, providing sustainability, peace and meaning in
life;
2. A series of role experiences rightly tailored
leading to an increased level of responsibility,
status, power, rewards and careers;
3. All work done during the present working pe-riod.
According to Gibson et al. (1995: 305) ca
-reer is a series of attitudes and behaviors related
to experience and work activities over a life span of a person and a series of ongoing work
activi-ties. Thus an individual’s career involves a range of options from a variety of opportunities. When
viewed from an organizational point of view, a
ca-reer involves a process whereby an organization renews itself for career effectiveness which is the boundary where a range of career and behavioral
attitudes can satisfy an individual.
Definition of Career Development
According to Martoyo (1994:70): “Career de -velopment is a condition that shows the
improve-ment of one’s status within an organization con
-cerned.”
Career development according to Rivai (2005:290) is the process of enhancing individu
-al work ability achieved in order to achieve the
desired career. Career development is a formal approach to activities for improvement or
devel-opment, growth, job satisfaction, knowledge and employee skills to ensure that qualified people and appropriate experience are available when need -ed, thus planning and development of a clear and steady career will help employees and organiza-tions to achieve success.
Career Planning
According Sedarmayanti (2010:121), in career planning, employees have the desires as follow: 1. Equal career opportunity: employees wants
equality in the promotion system in terms of career advancement opportunity;
2. Monitoring attention: employees want their
supervisors to play an active role in career
development, and provide timely feedback on
their performance;
3. Awaness and opportunity: employees want
knowledge of opportunities for career ad-vancement;
4. Work interests: employees need different amounts of information and also have differ -ent levels of desire in career advancem-ent;
5. Career satisfaction: employees have different
level of career satisfaction depending on age and type of work.
Performance Theory
According to Lavasque in HadariNawawi (2006: 62), says that performance is everything
that a person does and results in performing the
function of a job. Furthermore Schermerson, Hunt, and Osborn say that performance is the quantity
and quality of achievement of tasks, whether done
by individuals, groups or organizations.
Judith R. Gordon in HadariNawawi (2006: 63) explains that performance is a function of the ability of workers in receiving job goals, the level of goal achievement and interaction between the goals and the ability of workers.
Previous Research Results
Some previous research studies that are
rel-evant to the research that will be conducted by the author is about the effect of mutation and career
development on the performance of structural
officials in the Karawang Municipality Govern
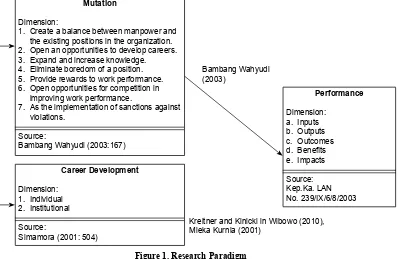
-ment which poured in the form of tables/matrices below which can be used as consideration by the author. From the above case we created a frame of thought as follows:
Figure 1. Research Paradigm
Source: Processing Results of the Author (2015)
Mutation
Dimension:
1. Create a balance between manpower and the existing positions in the organization. 2. Open an opportunities to develop careers. 3. Expand and increase knowledge. 4. Eliminate boredom of a position. 5. Provide rewards to work performance. 6. Open opportunities for competition in
improving work performance.
7. As the implementation of sanctions against violations.
Kreitner and Kinicki in Wibowo (2010), Mieka Kurnia (2001)
RESEARCH METHOD
The Methods Used
Based on the consideration of research objec
-tives, the author used descriptive and verifica
-tive methods. Descrip-tive research according to Sugiyono (2002:6) is a research conducted on in
-dependent variables, which is without making a comparison or connect with other variables. Fur
-thermore Nana SyaodihSukmadinata (2011:18),
explains that descriptive research is intended to
describe a state or phenomena as what it is.
Research Design
The initial stage conducted was a preliminary
study on the object of research, which is the Gov -ernment of Karawang Municipality to ask for data
and make initial observations about the condi
-tion of structural officials in the Government of Karawang Municipality which then can be used as background research. Then problem identification was performed, identification of the problem as a base in making a framework of research thinking
which further determine research hypothesis. After the research design was made,
popula-tion was necessary to be determined and then determined the number of samples to be used as respondents in this research. From the number of
samples known, respondents data were discovered
to be collected and analyzed by Path Analysis af -ter the data were transformed from ordinal scare
to interval scale by using method of successive in
-terval method. However, before the analysis of the
data collected from respondents were performed,
validity and reliability test were conducted first. When it s valid and reliable, the data can be ana -lyzed, whereas if the data is not valid and not
reli-able, it can be considered whether it will still be included in analysis or referred back to the defini
-tion of research variable in opera-tional way. The
last stage, after the data analysis was performed, the author can draw conlusions on the analysis re-sults and interpret it.
Variable Operationalization
As revelaed in the identification of research problem, that the main subjects studies were Mutation(X1) andCareer Development (X2) as
independent variables, and Performance (Y) as dependent variables.
Data Source
There are two data sources used in this re-search namely primary data and secondary data.
Primary data is concrete data from the field that is obtained from interview and the questionnaires to respondents and field observations by researchers. Secondary data is data or basic material derived from written sources that can be divided into the source of books and scientific magazines, sources of archives, personal documents and official docu
-ments on the object of research (government in -stitution of Karawang Municipality) related to the
problem studied.
Population, Sample and Sample Collecting Techniques
In determining the data to be used in this re
-search, population and sample data that will be used as research material to be analyzed should be determined first.
Population according to Sugiyono (2010:80) is a “generalization area consist of objects/subjects
that have certain qualities and characteristics set
by researchers to be studied and then drawn con
-clusions”. The population in this research was all echelon IV structural officials in the Karawang Municipality of 935 people.
This sampling technique was used by the au
-thor because the population (all echelon IV struc
-tural officials in Karawang Municipality) is di -vided into 2 groups of positions, namely echelon
IV/a officials and echelon IV/b officials. While for
samples collecting of respondents in this research
was using the cochran formula in Harun Ar Rasyid (1994:75) which quoted by Ridwan and Engkos Achmad Kuncoro, (2007:58) as follows:
Source: Harun Ar Rasyid (1994:75) in Ridwan and Engkos Achmad Kuncoro, (2007:58))
Explanation
N = Number of population data sources
t = Normal curve value based on the selected real level (α=0.05 price=1.96)
p = Proportion of one of the unit compared q = 1-p
d = Error level in percent (set at 5%)
Based on the formula, then the number of re
-search samples can be calculated and determined the amount as follows:
p = 681/926 = 0,7354
(proportion for echelon IV/a officials)
p = 245/926 = 0,2646
(proportion for echelon IV/b officials)
t2.p.q = 1,962 x 0,7354 x 0,2646 = 0,7475
d2 = 0,052 = 0,0025
n(min) = 266,1998 rounded to 226
The minimum sample of the calculation
re-sults, according to Cochran is assumed to be only 95% that can be observed. Furthermore, based on
the data obtained from the measurement results (95% of minimum sample), it was assumed that only 95% that can be obtained. Based on this con -sideration, the expected sample size of n(har)is:
n(har) = {n(har) ⁄ (0,95 x 0,95)} n(har) = { 226 ⁄ 0,9025 }
n(har) = 250,415 rounded to 250
Thus, the sample drawn from this research
was 250 people. The number of samples was then determined based on the number of each sample according to the level of echelon by Proportionate Stratified Random Sampling.
Data collection techniques used in this study were through questionnaires, interviews and ob -servations.
1. Questionnaires were distributed to respond
-ents to measure research variables. The ques -tionnaire was arranged in the form of likert scale, where the questionnaire was compiled
with five answer choices in each item, each of which was given a score or weight of 5,4,3,2,1 as shown in Table 3 below.
2. Interview was conducted by question and an -swer with respondents and other related
par-ties, intended to obtain additional information
related to this research.
3. Observation in this research was conducted by directly observing the research object to deter -mine the condition, event and phenomenon oc-cured in the research location.
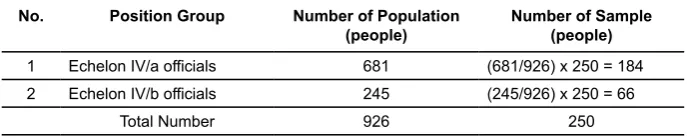
Table 2
The number of sample per position group
No. Position Group Number of Population (people)
Number of Sample (people)
1 Echelon IV/a officials 681 (681/926) x 250 = 184
2 Echelon IV/b officials 245 (245/926) x 250 = 66
Total Number 926 250
Source: Data Collection Technique
Table 3 Answer Categories
Answer Categories Answer Score
Strongly Agree = Very Good
Agree = Good
Moderately Agree = Moderately Good Disagree = Not Good Strongly Disagree = Very Not Good
Validity Test
Validity is a measure that shows the levels of
validity of an instrument. A valid instrument has high validity. Conversely, a less valid instrument
means to have low validity (Arikunto, 2006: 168). Instrument validity test is conducted to determine how far the research instrument is able to reflect
the contents in accordance with the things and properties measured. That is, every item of the in-strument has really depicted the whole contents or
constructs theory which is the basis for the prepa
-ration of the instrument. For this test, product mo
-ment correlation formula was used (Riduwan and Engkos Achmad Kuncoro, 2007: 217) as follows:
Source: Riduwan and Engkos Achmad Kuncoro, 2007:217)
Explanation:
rcount = Correlation coefficient
∑Xi = Number of item scores
∑Yi = Number of total scores (all items)
n = Number of respondents
Next, it was calculated with the t-test with the formula:
Explanation:
tcount= Value of tcount
n = Number of respondents r = Correlation Coefficient rcount
Distribution (table t) forα = 0,05 and freedom degree of (dk = n-2)
Rule of decision.
If tcount > ttable means valid otherwise
tcount < ttable means not valid
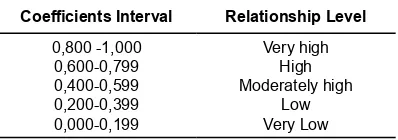
If the instrument is valid, then seen from the interpretation criteria of the correlation index (r) as follow:
Table 4
Interpretation of Correlation Coefficients of r Value
Coefficients Interval Relationship Level 0,800 -1,000
Sources: Husein Umar, 2009
Reliability Test
Reliability is the level of ability of a research instrument to be able to measure a variable repeat
-edly and able to produce information or data the same or very little variation. In other words the instrument is able to show the accuracy, stability
and consistency in generating data from the
meas-ured variable (Arikunto, 2006: 171). Instrument reliability testing in this research was conducted by split half technique from Spearman Brown (Riduwan and Engkos Achmad Kuncoro, 2007: 217) with the following formula:
Explanation:
r11 = internal reliability of all instruments
rb = product moment correlation between first and second section
To determine whether the correlation
coef-ficient is significant or not, (tabel r) distribution forα = 0.05 orα = 0.01 with freedom degree (dk =
n-2) was used. Then made a decision comparing r11with rtable. As for the rule of decision: if r11 > rtable
means reliable and r11 < rtabel means not reliable.
Data Normality Test
According to Usman and Akbar (2008: 109)
normality testing is used to test whether
continu-ous data is normally distributed so that analysis with validity, reliability, T test, correlation and regression can be performed. On the other hand
some experts claim that the normality test is not required to the data equal to or more than 30
pieces or called large samples. But there are also experts who claim that the data has been consid
However, the normality test was used in this study to determine whether a data follows the
normal distribution or not. Data normality test
usedskewness ratio and kurtosis ratio. Skewness
ratio is skewness value divided by standard error
skewness, while kurtosis ratio is kurtosis value
divided by standard error kurtosis. As a guide, if the ratio of kurtosis and skewness is between -2 to +2, then the data distribution is normal (Santoso, 2000: 53).
Skewness is a measurement of the level of
asymmetry (spread) of data distribution around the mean. The normal distribution is a symmetri
-cal distribution and the skewnessvalue is 0. The
positive value ofskewness indicates the tip of the
tendency extending toward the positive value (the
right-hand side of the curve is longer). A negative skewness indicates the tip of the tendency
extend-ing toward the negative value (the left-hand tail
curve is longer).
Skewness formula is as follows:
To calculate the standard error of skewness is
as follows:
Kurtosis describes the peakedness or flatness of data distribution as compared to the normal dis
-tribution. In the normal distribution, the value of
kurtosis equals to 0. Positive kurtosis value shows
a relatively tapered distribution, whereas a nega
-tive kurtosis value indicates a rela-tively flat distri
-bution. The kurtosis formula is:
Sources: Santoso, 2000:53
To calculate the standard error of this kurtosis
is as follows:
Where SE sis Standar error of kurtosis
Data Transformation
The results of data collection obtained through
questionnaires from respondents is ordinal data.
Because in this study, the analysis method used is
the path analysis, which is one method of
paramet-ric analysis, then the variables measured must use data with Interval scale. Therefore, the data needs to be increased to an interval scale by the method of successive interval. According to (Riduwan and Engkos Achmad Kuncoro, 2007: 30): “The steps
of transforming ordinal data into interval data are
as follows:
a. first, consider each item of respondents’ an
-swer from the questionnaire distributed; b. on each item, it is determined how many peo
-ple get the 1,2,3,4, and 5 score which called as
frequency;
c. each frequency is divided by the number of re -spondents and the result is called proportion;
d. determine the cumulative proportion value by
adding the proportion value sequentially per column score;
e. use the normal distribution table, calculate the Z value for each cumulative proportion ob -tained;
f. determine the highest density value for each Z
value obtained (by using high density table); g. determine the scale value by using the formu
-la:
Source: Riduwan and Engkos Achmad Kun
-coro, 2007:30
h. determine the transformation value by formu
-la: Y=NS+[1 + | NSmin |]
A tool for calculating data transformation from ordinal to interval with the method of successive
interval is Microsoft Office Excel software. Fur
-thermore, before the statement items in the ques -tionnaire used in the study, the validity and
reli-ability test were performed first.
The number of scores used to obtain position
information of items in the answer categories
Where
RS = Scale range
N = Number of samples
m = Number of answer alternatives to each item
Process Stage
a. Determining the lowest and highest score by
multiplying samples of 250 respondents with
the lowest and highest value, obtained: Lowest range: 250 x 1 = 250 Highest range: 250 x 5 = 1.250 b. Range of each criterion:
RS=(250 (5-1))/5=200
Cumulative Analysis
Quantitative analysis is used to answer the for
-mulation of problem number 4 that will explain
how much the mutation and career development
affects the performance of echelon IV structural officials in the Government of Karawang Munici
-pality either partially or simultaneously based on
the results of data collection through questionnaire
Correlation Analysis of Moment Product
In this research moment product correlation
analysis was one approach to determine the
close-ness between one variable with other variable, by formula:
RESEARCH RESULTS
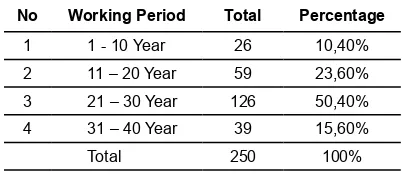
Tabel 5
Number of Respondents by Period of Work
No Working Period Total Percentage
1 1 - 10 Year 26 10,40%
2 11 – 20 Year 59 23,60%
3 21 – 30 Year 126 50,40%
4 31 – 40 Year 39 15,60%
Total 250 100%
Source: Data Processing Results, 2012
Based on Table 5, it presents data on the re
-spondent’s working period. Working period of 1-10 years is 26 people (10,40%), working pe
-riod of 11-20 year is 59 people (23,60%), work
-ing period of 21-30 year is 126 person (50,40%) and working period of 31-40 years is 39 people (15.60%).
From validity test result of performance vari
-able as much as 11 or all item of question stated
as valid.
Reliability Test
From the data processing results by using SPSS software, reliability testing result from all variable was obtained, as shown in Table 7.
Data Normality Test
The results of data normality test by the help of SPSS version 14 is as shown in Table 8, it shows that the skewness ratio = 0.278/154 = 1.805, while kurtosis ratio = -0,552/0,307 = -1,798. Since the skewness ration and kurtosis ration are between -2 to +2, it can be concluded that data distribution
is normal.
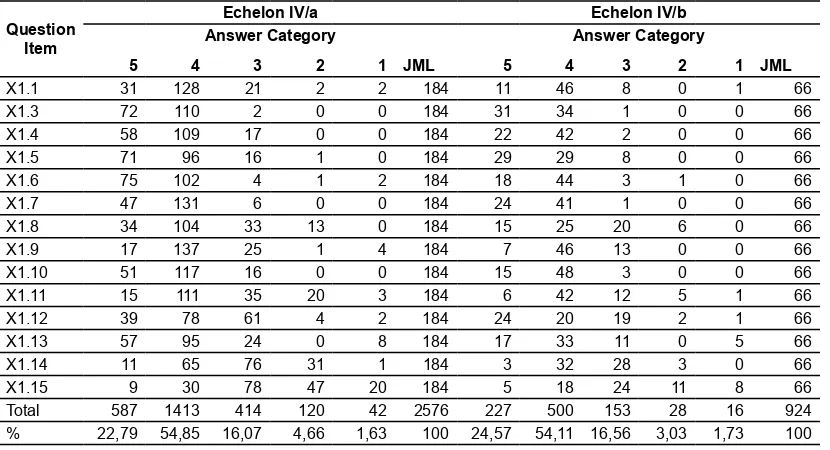
Based on Table 9, it shows the comparison of the number of respondent to the item mutation variable statement both echelon IV/a and IV/b each category of answers do not show a significant difference. The majority respondents both echelon IV/a and IV/b answered agree, with 54.85% for echelon IV/aand 54.11% for echelon IV/b.
Based on Table 10, it shows that echelon IV structural officials respond to career develop
-ment variables with strongly agree which is for
indicators of career satisfaction and loyalty to the
organization. While they responds agree to the in
-dicators of interested to be promoted, equal career opportunities, educational background, training, flexibility to socialize and relationship between
people, institution/company policies and trust to superiors.
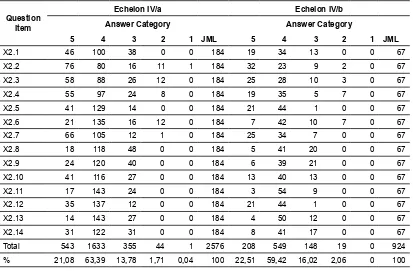
Based on Table 11, it shows that the percent
-age comparison of the number of respondents an
-swer to the items of career development variable, both echelon IV/a and IV/b do not show a signifi
Table 6
Validity Test Result of Performance Variable (Y)
No. item r Count r critical Explanation
Y.1 0,485 0,3 Valid
Y.2 0,553 0,3 Valid
Y.3 0,631 0,3 Valid
Y.4 0,461 0,3 Valid
Y.5 0,513 0,3 Valid
Y.6 0,453 0,3 Valid
Y.7 0,506 0,3 Valid
Y.8 0,486 0,3 Valid
Y.9 0,581 0,3 Valid
Y.10 0,519 0,3 Valid
Y.11 0,570 0,3 Valid
Source: Data was processed using SPSS version 14.0 Year 2012
Table 7
Reliability Testing Result
Number Variable R Count R Critical Explanation
1. Mutation (X1) 0, 776
0,70
Reliable
2. Career Development (X2) 0, 868 Reliable
3. Performance (Y) 0, 842 Reliable
Source: Data was processed using SPSS version 14.0 Year 2012
Table 8 Descriptive Statistics
N Skewness Kurtosis
Statistic Statistic Std. Error Statistic Std. Error
Unstandardized Residual 250 ,278 ,154 -,552 ,307
Valid N (listwise) 250
Source: Data was processed using SPSS version 14.0 Year 2012
Table 9
Recapitulation of Respondents Answer of mutation variables based on statement item and echelon
Question
Item
Echelon IV/a Echelon IV/b
Answer Category Answer Category
5 4 3 2 1 JML 5 4 3 2 1 JML
X1.1 31 128 21 2 2 184 11 46 8 0 1 66
X1.3 72 110 2 0 0 184 31 34 1 0 0 66
X1.4 58 109 17 0 0 184 22 42 2 0 0 66
X1.5 71 96 16 1 0 184 29 29 8 0 0 66
X1.6 75 102 4 1 2 184 18 44 3 1 0 66
X1.7 47 131 6 0 0 184 24 41 1 0 0 66
X1.8 34 104 33 13 0 184 15 25 20 6 0 66
X1.9 17 137 25 1 4 184 7 46 13 0 0 66
X1.10 51 117 16 0 0 184 15 48 3 0 0 66
X1.11 15 111 35 20 3 184 6 42 12 5 1 66
X1.12 39 78 61 4 2 184 24 20 19 2 1 66
X1.13 57 95 24 0 8 184 17 33 11 0 5 66
X1.14 11 65 76 31 1 184 3 32 28 3 0 66
X1.15 9 30 78 47 20 184 5 18 24 11 8 66
Total 587 1413 414 120 42 2576 227 500 153 28 16 924
% 22,79 54,85 16,07 4,66 1,63 100 24,57 54,11 16,56 3,03 1,73 100
Table 10
Recapitulation of Career Development Variable
No Indicator Item
Code
Total
Score Category
1 Interested to be promoted X2.1 1014 Agree
2 Career satisfaction X2.2 1054 Strongly Agree
3 Equal career opportunities X2.3 1017 Agree
4 Educational background X2.4 1015 Agree
X2.5 1047 Agree
5 Training X2.6 964 Agree
6 Loyalty to the organization X2.7 1070 Strongly Agree
7 Flexibility to socialize and relationship between people X2.8 955 Agree
X2.9 969 Agree
8 Institution/company policy X2.10 1014 Agree
X2.11 987 Agree
9 Concern of superiors X2.12 1043 Agree
X2.13 979 Agree
10 Superiors trust X2.14 991 Agree
Source: data processing result by SPSS, 2012
Table 11
Recapitulation of Respondents Answers on Career Development Variable based on Statement item and echelon
Question
Item
Echelon IV/a Echelon IV/b
Answer Category Answer Category
5 4 3 2 1 JML 5 4 3 2 1 JML
X2.1 46 100 38 0 0 184 19 34 13 0 0 67
X2.2 76 80 16 11 1 184 32 23 9 2 0 67
X2.3 58 88 26 12 0 184 25 28 10 3 0 67
X2.4 55 97 24 8 0 184 19 35 5 7 0 67
X2.5 41 129 14 0 0 184 21 44 1 0 0 67
X2.6 21 135 16 12 0 184 7 42 10 7 0 67
X2.7 66 105 12 1 0 184 25 34 7 0 0 67
X2.8 18 118 48 0 0 184 5 41 20 0 0 67
X2.9 24 120 40 0 0 184 6 39 21 0 0 67
X2.10 41 116 27 0 0 184 13 40 13 0 0 67
X2.11 17 143 24 0 0 184 3 54 9 0 0 67
X2.12 35 137 12 0 0 184 21 44 1 0 0 67
X2.13 14 143 27 0 0 184 4 50 12 0 0 67
X2.14 31 122 31 0 0 184 8 41 17 0 0 67
Total 543 1633 355 44 1 2576 208 549 148 19 0 924
% 21,08 63,39 13,78 1,71 0,04 100 22,51 59,42 16,02 2,06 0 100
Table 12
Performance Variable Recapitulation
No Indicator Item
Code
Total
Score Category
1 Fulfillment of all necessary resources Y1 1064 Very Good
Y2 1076 Very Good
2 Activity result is in te form of product/service (physicand/ or non physic)
Y3 1121 Very Good
Y4 1089 Very Good
3 Functioning output activity Y7 1109 Very Good
4 Suitability of each prodct/service with the needs and
expectation of the community;. Y8 1128 Very Good
5 Punctuality Y5 1082 Very Good
6 Procedure conformity Y6 1076 Very Good
7 Output usability Y9 1076 Very Good
Y10 1078 Very Good
8 measurement of the effect of degree of social, economic,
environment or other public effect Y11 1076 Very Good
Source: data processing result by SPSS, 2012
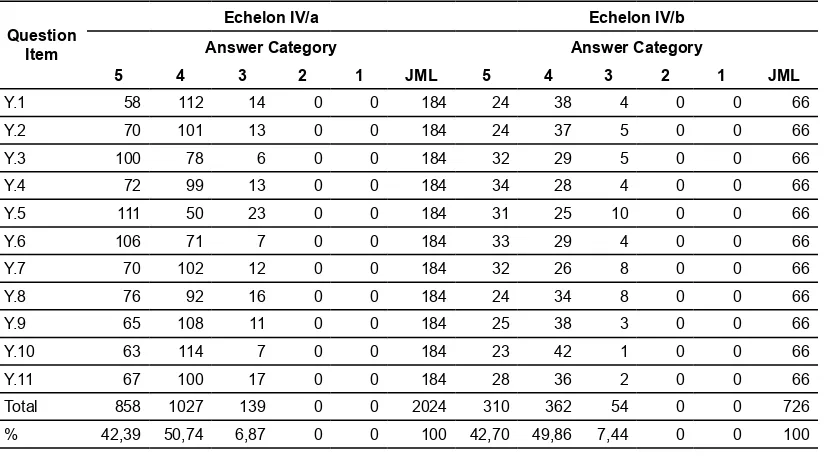
Table 13
Recapitulation of Respondents Answers on Performance Variable based on statement item and echelon
Question
Item
Echelon IV/a Echelon IV/b
Answer Category Answer Category
5 4 3 2 1 JML 5 4 3 2 1 JML
Y.1 58 112 14 0 0 184 24 38 4 0 0 66
Y.2 70 101 13 0 0 184 24 37 5 0 0 66
Y.3 100 78 6 0 0 184 32 29 5 0 0 66
Y.4 72 99 13 0 0 184 34 28 4 0 0 66
Y.5 111 50 23 0 0 184 31 25 10 0 0 66
Y.6 106 71 7 0 0 184 33 29 4 0 0 66
Y.7 70 102 12 0 0 184 32 26 8 0 0 66
Y.8 76 92 16 0 0 184 24 34 8 0 0 66
Y.9 65 108 11 0 0 184 25 38 3 0 0 66
Y.10 63 114 7 0 0 184 23 42 1 0 0 66
Y.11 67 100 17 0 0 184 28 36 2 0 0 66
Total 858 1027 139 0 0 2024 310 362 54 0 0 726
% 42,39 50,74 6,87 0 0 100 42,70 49,86 7,44 0 0 100
Source: Data processing result of 2012
Based on the opinion of respondents from each
item questionnaire, recapitulation of performance
variables was made as follows at Table 12. Based on Table 12, it shows that structural of
-ficials of echelon IV respond very well to all indi
-cator of performance variable of fulfillment of all
required resources, activity result is in te form of
product/service (physic and/or non physic), func
-tioning output activity, suitability of each prodct/
service with the needs and expectation of the com-munity; punctuality, procedure conformity, output
usability, as well as measurement of the effect of
degree of social, economic, environment or other
public effect.
Based on the recapitulation of respondents’ an
-swers grouped by statement item and echelon, can be seen in the Table 13.
Based on the Table 13, it shows the percent
-age comparison of the number of respondents to the statement item performance variable both ech
-spondents of both echelon IV/a and IV/b answered agree, with 50,74% for echelon IV/a and similarly with echelon IV/b by 49,86%.
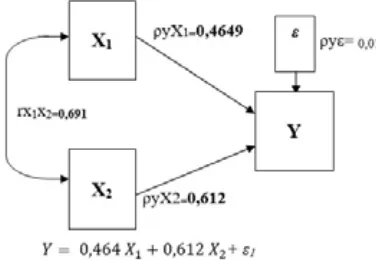
Based on the above table it is discovered that the direct effect of mutation(X1) on the perfor
-mance (Y) is 0.215 or 21.5%, the indirect effect of mutation (X1) through career development (X2) on the performance of Official (Y) is 0.196 or 19.6% .
While the direct effect of career development (X2) on the performance of Officials (Y) is 0.375 or 37.5%, indirect effect of career development (X2) through mutation (X1) on official perfor
-mance (Y) is 0.196 or 19.6%.
The extent of partial effect of mutationvariable (X1) either direct or indirect effect to performance of echelon IV structural official (Y) equal to 0,411 or 41,1%. While the amount of partial effect of career development variable (X2) either direct or indirect effect to the performance of echelon IV structural official (Y) is 0.571 or 57.1%.Overall can be described as follows:
Figure 2. Sub-structure 3: Overall Effect of Inde -pendent Variable (X) to De-pendent Variable (Y)
Table 14
Direct and Indirect Effect of Variable X1and X2to Y
Effect Path Formula Calculation
Extent of
Effect
Variable X1
Direct X1-Y ρyx12 0.464 x 0.464 0,215
Through X2 X1-X2-Y ρyx1.rx1x2.ρyx2 0.464 x 0.691 x 0.612 0,196 X1 Total Effect 0,411 Variable X2
Direct 0,306 ρyx22 0.612 x 0.612 0,375
Through X1 0,171 ρyx2.rx2x1.ρyx1 0.612 x 0.691 x 0.464 0,196 X2 Total Effect 0,571
Total Effect of X1and X2variables 0,982
Effect of Other Variables 0,018
Source: Data processing result of 2012
CONCLUSION
This research entitled “The Effect of Mutation and Career Development on the Performance of Echelon IV Structural Officer in Karawang Mu
-nicipality Government” with a sample size of 250 people Structural Officers of Echelon IV.
The data were analyzed descriptively and
verificatively (Data Analysis Method using Path Analysis) with the help of SPSS 14. The results showed:
1. Implementation of mutation was responded: a. strongly agree for indicator: encouragement
to achieve higher career, high spirit,
outstand-ing ability, opportunity to achieve insight and
knowledge, organization concern in gaining insight and knowledge.
b. agree for indicator:The Right Man on The Right job, eliminate boredom and burnout, in -crease passion and morale in working
2. Appreciation to outstanding employees, career
development implementation was responded:
a. strongly agree for indicator of career satisfac-tion and loyalty to the organizasatisfac-tion.
b. agree for indicator of interested to be pro -moted, equal career opprtunity, educational
background, training, flexibility in socializing
and human relationship, institution/company
policy and superior’s trust.
3. Official Performance was responded very good for all indicators of Fulfillment of all necessary
resources.
-formance of echelon IV structural officials is 21,5% while indirect effect is equal to 19,6% in total mutationeffect to the performance of echelon IV structural officer equal to 41,1%. In the hypothesis testing, it is known that there is a significant relationship.
5. The direct partial effect between career de
-velopment with echelon IV structural officials performance is 37.5%, while the indirect effect is 19.6%, the total effect of career development on the performance of echelon IV structural officials is 57.1%. In the hypothesis testing, it is known there is a significant relationship. 6. The simultaneous effect between mutation
variables and career development on the per
REFERENCES
ArikuntoS. 1998. Prosedur Penelitian. Rineka Cipta. Jakarta.
Dessler G. 1986. Manajemen Personalia: Teknik dan Konsep Modern. Terjemahan. Edisi Ketiga. Pener
-bit Erlangga. Jakarta.
Gauzali S. 2000. Manajemen Sumber Daya Manusia. Penerbit Gunung Agung. Jakarta.
Gibson L, James J M, Ivancevuch and James HD Jr. 1996.Organisasi: Perilaku, Struktur, Proses. Bina
-rupa. Jakarta.
Irianto J. 2001. Tema-Tema Pokok Manajemen Sumber Daya Manusia. Insan Cendekia. Surabaya.
Irianto J 2001. Isu-Isu Strategis Pengembangan Sumber Daya Manusia. InsanCendekia, Surabaya.
Keputusan Kepala Lembaga Administrasi Negara Nomor: 239/IX/6/8/2003 tentang Perbaikan Pedoman Penyusunan Pelaporan Akuntabilitas Kinerja Instansi Pemerintah.
Mangkunegara A.A Anwar Prabu, 2004, Manajemen Sumber Daya Manusia Perusahaan, Remaja Ros
-dakarya, Bandung.
Martoyo, Susilo. 2000. Manajemen Sumber Daya Manusia. Rineka Cipta, Jakarta.
Mathis, Robert L., John H. Jackson.2009. Human Resource Management – Manajemen Sumber Daya Manusia. Edisi Sepuluh, Salemba Empat, Jakarta.
Mondy, R.W., Noe, R.M., Premeaux, S.R..1993. Human Resource Management.(5rd ed.). Massachu
-setts: Allyn and Bacon.
Nawawi, Hadari. 2006 . Evaluasi dan Manajemen Kinerja di Lingkungan Perusahaan dan Industri, Gad
-jah Mada University Press, Yogyakarta
Nazir, Moh. 1998. Metode Penelitian. Jakarta Ghalia Indonesia.
Niti Semito, Alex S.1991. Manajemen Personalia (Manajuemen Sumber Daya Manusia), Ghalia Indo
-nesia, Jakarta.
Peraturan Pemerintah Nomor 9 Tahun 2003 tentang Wewenang Pengangkatan, Pemindahan dan Pem
-berhentian Pegawai Negeri Sipil.
Peraturan Menteri Negara Pendayagunaan Aparatur Negara Nomor PER/9/M.PAN/5/2007 tentang Pedoman Umum Penetapan Indikator Kinerja Utama di lingkungan Instansi Pemerintah.
Prawirosentono, Suryadi. 1999. Manajemen Sumber Daya Manusia: Kebijakan Kinerja Karyawan, BPFE, Yogyakarta.
Purwanto, Iwan. 2008 . Manajemen Strategi, Yrama Widya, Bandung.
Ranupandojo, Heidjrachman dan Suad Husnan. 2002. Manajemen Personalia, BPFE-Yogyakarta.
Riduwan, dan Kuncoro, Engkos Achmad. 2007. Cara Menggunakan dan Memakai Analisis Jalur (Path Analysis), Alfabeta, Bandung.
Santoso, Singgih.2000. Buku Latihan SPSS Statistik Parametrik, PT Elex Media Komputindo, Jakarta.
Sastrohadiwiryo, Siswanto, B. 2002 .Manajemen Tenaga Kerja Indonesia, BumiAksara, Jakarta.
Sedarmayanti.2010. Manajemen Sumber Daya Manusia (Reformasi Birokrasi dan Manajemen Pegawai Negeri Sipil), Refika Aditama, Bandung.
Siagian. P. Sondang. 2008. Manajemen Sumber Daya Manusia, Bumi Aksara, Jakarta.
Simamora, Henry. 2000. Manajemen Sumber Daya Manusia. Edisi I. Cetakan I. Jakarta:STIE YKPN.
Soetjipto, Budi W., dkk.. 2002. Paradigma Baru Manajemen Sumber Daya Manusia. Jogyakarta: Amara Books.
Sugiyono.2002a.Metode Penelitian Administrasi.Bandung :Alfabeta.
Sugiyono. 2010b. Metode Penelitian Kuantitatif, Kualitatif, dan R & D. Bandung :Alfabeta.
Sugiyono.2010c.Statistik untuk Penelitian. Bandung :Alfabeta.
Umar Husein, 2005, Riset Sumber Daya Manusia Dalam Organisasi, Gramedia Pustaka Utama, Jakarta
Undang-Undang Nomor 8 tahun 1974, tentang Pokok-Pokok Kepegawaian sebagaimana telah diubah dengan Undang-Undang Nomor 43 tahun 1999;
Usman, Husaini, dan Purnomo Setiady Akbar, 2008. Metodologi Penelitian Sosial, Bumi Aksara, Jakarta.
Veithzal, Rivai.2005. Manajemen Sumber Daya Manusia Untuk Perusahaan. Jakarta : PT Raja Grafindo
Persada.
Veithzal, Rivai. 2005. Performance Appraisal. Jakarta : PT. Rajagrafindo Persada.
Wahyudi, Bambang.2002. Manajemen Sumber Daya Manusia. Bandung : CV. Sulita.
Wibowo. 2009. Manajemen Kinerja. Edisi Kedua. Jakarta :Rajawali Pers.
Wirawan. 2009. Evaluasi Kinerja Sumber Daya Manusia, Teori, Aplikasi dan Penelitian, Salemba Em