LUNG DISORDERS DETECTION BASED ON IRISES IMAGE
USING COMPUTATIONAL INTELLIGENT ART
Anna Triwijayanti K.1, Hadi Suwastio2, Rini Damayanti3
1,2Electrical Department - Telkom School of Engineering, Bandung
3Tidusaniy Green Health Center Bandung
1[email protected], 2[email protected], 3[email protected]
Abstract
Iridology as a way of revealing human organs and tissues conditions is done by iridologist by taking the image of both irises of the patients. This can be done by using a digital camera and observe each iris on the LCD display or connect the camera to a computer or a television set and observe it through the display. Research on computerized iridology has been performed before by using artificial neural network of back propagation, which is a kind of supervised learning algorithm, as the classifier [13]. Such system should be able to retain its stability while still being plastic enough to adapt to arbitrarily input patterns. Adaptive Resonance Theory (ART), another kind of artificial neural network which uses unsupervised learning algorithm, has some important traits, such as real-time learning, self-stabilizing memory in response to arbitrarily many input patterns, and fast adaptive search for best match of input-to-stored patterns [9]. That way, ART architecture is expected to be the best stable and adaptable solution in changing environment of pattern recognition. In this research, the lung disorders detection is simply designed through the steps of segmentation, extraction of color variations, transformation of lung and pleura representation area in iris image to binary form as the input of ART 1, and pattern recognition by ART 1 neural network architecture. With 32 samples and 4 nodes of output layer of ART1, the system is able to determine the existences of the four stadiums of lung disorders (acute, subacute, chronic and degenerative) in relatively short time process (approximately 1.8 to 3.2 seconds) with the accuracy of stadium recognition 91.40625% by applying the vigilance parameter value of 0.4.
Keywords: iridology, lung, pleura, segmentation, ART 1 neural network
1. Introduction
The irises of a person’s eyes have the ability to reveal conditions of the organs or tissues of the body, which is known as iridology. Iridology itself is supposed to be used as a pre-diagnostic tool.
Originating from Greek iridos which means rainbow
and ologi which means science, iridology can be defined as the science of analyzing the delicate structures of the iris of the eye. Iridology reveals the presence of tissue inflammation in the body, where it is located, and what stage it has reached; acute, subacute, chronic, or degenerative. This is possible because there are 28,000 individual nerve fibers connect with every cell and chromatophore in the iris stroma, the main body of the iris [7].
Condition of the left body parts is represented on the left side iris, and the condition of the right body parts is represented on the right side of the iris likewise. For organs or tissues which exist on both sides of the body, the representation of the organs and tissues are on both sides of the irises, left and right side as well.
The aim of this final project is to design highly-accurate lung disorders stadium detection and to establish a user-friendly tool that can make lung disorders analysis easier for iridologists or common people toward iridology as well.
The experimental research on this lung disorders stadiums detection is performed by setting the right parameters of the Canny edge detection, center point of pupil, pupil radius, iris radius, the
boundary of lung and pleura area representation, the threshold value of extraction, the vigilance parameter of ART 1 neural network. The accuracy is measured by comparing the stadium results by the system with the stadium decisions of iridologist.
2. System Design
The system design process is illustrated on Figure 1.
2.1 Image acquisition and cropping
The eye image is acquired using digital camera on condition that the lighting is regulated such a way that it will not reflect on the iris parts that will be analyzed; those are lung and pleura area. A static standard is required to get the best acquisition of a quite small eye image. The device used is digital camera Casio QV-8000SX and Photo Loader as the interface to transfer the pictures from camera flash memory to a personal computer.
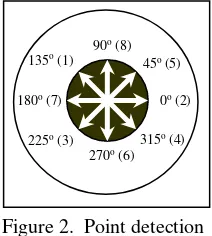
0o (2) 45o (5) 90o (8) 135o (1)
180o (7)
225o (3) 270o (6)
315o (4)
Figure 2. Point detection
The cropping process can be performed by using the additional tool such as ACD FotoCanvas Lite 1.1, Adobe Photoshop 6, or Corel Photo-Paint 10 (or the newer version of each). The cropping results in image sized 200 x 200 pixels, with pupil center is regulated to be approximately at pupil center considering that this will affect the next process [3]. The cropped image is then saved in BMP (Bitmap Windows) format, considering that the system designed here does not regard any compression of images and other types of image storage.
2.2 Color to Grayscale Conversion
Conversion from RGB to grayscale image is performed by eliminating the hue and saturation information, while the luminance information is maintained. Grayscale is considered as:
B G
R
Y 0.3 0.59 0.114 (1)
So there will only be one value for each pixel with three values (red, green, and blue) of the original RGB image.
2.3 Iris Segmentation
To localize the iris part, the first thing to do is to determine the center point of pupil and then determine the inner and outer iris boundaries. Due to the obvious difference of intensity (brightness) around these boundaries, consequently the edge detection method can be applied easily to acquire the edge information [10] as depicted on Figure 2.
After the edges have been detected, the circumference of pupil is traced by searching pixel by pixel on eight directions, moving from center point of pupil (this is why in image cropping the center should be estimated to be in the middle of pupil, even though not exactly in the center). This process can be seen in Table 1.
The eight pixel by pixel tracing is different, because the movement of tracing is performed according to each different direction.
No. Direction x tracing y tracing
1 135o x = x– 1 y = y– 1
2 0o x = x + 1 y
3 225o x = x– 1 y = y + 1
4 315o x = x + 1 y = y + 1
5 45o x = x + 1 y = y– 1
6 270o x y = y + 1
7 180o x = x– 1 y
8 90o x y = y– 1
Pixel tracing is carried out by comparing pixel value on that point to a certain threshold value and will stop when pixel with gray level 1 (black) is found, that is pupil boundary which is the result of edge detection.
The coordinate of center point of the circle is calculated by using the derivation of the circle equation:
2
22
b y a x
r (2) where:
r = circle radius (unknown)
(a ,b) = center circle coordinate (unknown) (x,y) = points of the 8-angles direction
Coordinate of center point (a,b) with a is the center coordinate on horizontal axis (x axis) and b is the center coordinate on vertical axis (y axis). The coordinates of eight points will then be used to find six center points. These six points are then accumulated and the mean value is taken and will be used as the estimated center point of the circle.
After the estimated pupil center point has been found, the next step is to calculate the pupil radius by using circle equation (2). Radius calculation is performed by considering the estimated pupil center point and the eight points located at the pupil Figure 1. System Design Flow Chart
for Both Sides of The Eyes
Classification Classification using
ANN (ART1)
Lung Disorders Stadium Decision Eye Image Acquisition
Lung and Pleura Area Segmentation
Extraction
Image Analysis
Binary value Representation Grayscale Conversion
Image Cropping Eyes
R
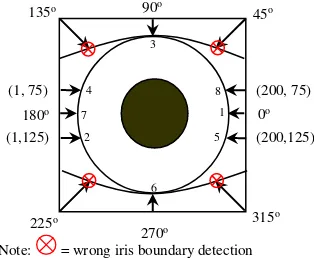
value so the estimated pupil radius can be found.The other thing that should be taken into consideration is that most of the iris images are not only the iris, but also include other boundaries such as the eyelids that will result in error detection, as illustrated on Figure 3.
The cross signs locate the points where error detection can possibly occur. That is why the tracing through these directions is changed over. The eight points coordinates on the outer iris boundaries are then used to calculate the center point and radius of the iris, using the same calculation of pupil
In scaling process, the right and left irises begin to be distinguished due to the differences of lung and pleura representations, as shown on Table 2 above. Scaling here means that the parameters is adjusted referring to the iridology chart.
This step is required considering that pupil it retrieves, the smaller pupil diameter will be due to its contraction. On the other hand, pupil dilates toward light with low intensity so it will be wider.
Before separating the lung and pleura area representations as shown on Figure 4, the corners a, b, c, d, e, and f should be calculated first. Using basic trigonometry, it is obvious that:
v
Therefore the corners of lung and pleura area can be acquired by using the following formulations as written in Table 3. detection of point. This procedure involves computing the sum of products of the coefficients
Figure 4. Lung and Pleura Area of Right Iris Figure 3. Iris Outer Boundary Detection
Note: = wrong iris boundary detection 0o
Table 2. Iris Size Scaling Toward Iridology Chart
where zi is the gray level of the pixel associated with
the mask coefficient wi. The response of the mask is
defined with respect to its center location.
w1 w1 w3
w4 w5 w6
w7 w8 w9
A point has been detected at the location on which the mask is centered if |R| > T, where T is a nonnegative threshold, and R is the sum given above. Basically, all that this formulation does is measure the weighted differences between the center point and its neighbors. The idea is that the gray level of an isolated point will be quite different from the gray level of its neighbors. Because there is no any threshold regulation exists, the threshold value T in this system is chosen by trial and error to get the best result of extraction. The main consideration in choosing threshold value is that the extracted points consist of the pixels with discolorations needed in classifying process.
2.5 Binary Representation
The outputs of segmentation and extraction stages are still images with RGB values with decimal three channels format. Considering that the classifier is adaptive resonance theory 1 neural network, this data format must be converted to binary data so they can fit the classification requirement. This is done by using decimal to binary data conversion with length of 8 bits for each color channel.
For instance, the color of red (255, 0, 0) will be represented as binary data 111111100000000000 00000, the green color (0, 255, 0) will be represented as binary data 000000001111111 00000000, etc.
2.6 Classification by ART 1 neural network
The architecture of adaptive resonance theory 1 (ART 1) neural network in this classification stage is designed with 24 nodes of input layer, regarding to 24 bits of each pixel, and 4 nodes of output layer, regarding to 4 stadiums of lung disorders; acute, sub acute, chronic, and degenerative.
One of the traits of this architecture must be modified to get the correct implementation because the number of category nodes has to be kept 4 nodes, representing the 4 stadiums. The modification is to limit the system, so new learned pattern will not make new category node.
The main processes in ART 1 can be divided into four phases, as shown on Figure 6 [14]: (1) recognition, (2) comparison, (3) searching, and (4) learning stage.
3. System Analysis
3.1 Algorithm analysis
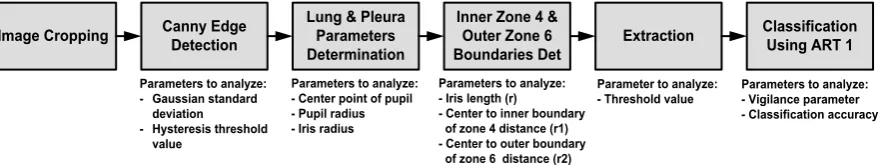
The steps of experimental design in this paper are shown in Figure 7.
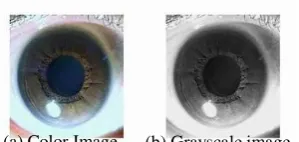
3.2 Color to Gray Scale Image Conversion
The main idea in this detection system is how to use the information carried by color image (RGB color model) to detect the lung and pleura disorders stadiums. However, there are some steps in the implementation design that are considerably more efficient by processing the image in grayscale levels due to the complexity of color processing. An example of color to grey scale image conversion is given on Figure 8.
Reset while Closeness < rho
Initialize network parameters
Initialize weights
Initialize return variables
Recognition stage
Comparison stage
Searching stage
Learning stage Input pattern
Output Category
Figure 6. Classification Using ART 1 Architecture Figure-5. The 3 3 Mask Used for
Detecting Isolated Points
Figure 7. Experimental Design of Analysis
Image Cropping Canny Edge
Detection
Lung & Pleura Parameters Determination
Inner Zone 4 & Outer Zone 6 Boundaries Det
Extraction Classification
Using ART 1
Parameters to analyze: - Gaussian standard
deviation
- Hysteresis threshold value
Parameters to analyze: - Center point of pupil - Pupil radius - Iris radius
Parameters to analyze: - Iris length (r)
- Center to inner boundary of zone 4 distance (r1) - Center to outer boundary of zone 6 distance (r2)
Parameter to analyze: - Threshold value
3.3 Canny Edge Detection
The bigger the standard deviation is set, the less the number of edges resulted as can be seen on Figure 9. This is because the bigger the standard deviation, the more the noise suppression is.
High threshold value determines how high a pixel’s probability must be for it be considered part of an actual edge, and the low threshold value determines how low the neighboring pixel’s probability must be for not be considered part of the same edge. In this system, the Gaussian standard deviation used is 1. This usage of standard deviation value is chosen by experiments.
3.4 Pupil and Iris Parameters Determination
In this system, the hysteresis threshold value is chosen to be 0.1 with considering that the edges will be proper as the input of the coming process as shown on Figure 10. The edges should not be too loose or dense to support successful pixel by pixel tracing. The most important thing to take into consideration in this parameter setting of edge detection is that the detection result should contain the boundaries of pupil and iris.
3.5 Lung and Pleura Segmentation
To segment the lung and pleura area representations, the parameters of pupil and iris should be determined first because these parameters (the center point coordinates of the pupil circle, the pupil/inner iris radius and also the outer iris radius)
will be used to rescale the iris toward the iridology chart.
The thing should be taken into consideration when calculating the center point coordinates of both pupil and iris circle is that the denominator part of coordinates calculation must not equal to zero in order that a and b coordinates not be infinite numbers.
The denominator of a coordinate equation (D) must not equal to zero, so that a ≠ infinite. Because D = 2(x1-x2) and D ≠ 0, so x1≠ x2. In order that b ≠
infinite, the denominator of b coordinate equation (EG-DH) must not equal to zero. Because E = 2(y1
-y2), D = 2(x1-x2), G = 2(x2-x3), and H = 2(y2-y3), this
means that EG ≠ DH, and (y1-y2) (x2-x3) ≠ (x1-x2) (y2
-y3). This way, the requirements that should be
fulfilled are if (y1-y2) = 0 or (x2-x3) = 0, so (x1-x2) ≠ 0
or (y2-y3) ≠ 0, and vice versa, if (x1-x2) = 0 or (y2-y3)
= 0, so if (y1-y2) ≠ 0 or (x2-x3) ≠ 0.
By using trial and error in system
implementation level, these conditions can be achieved by arranging the concatenation of the eight points coordinates in the circumference of pupil and iris circles according to the order (1) 135o, (2) 0o, (3)
225o, (4) 315o, (5) 45o, (6) 270o, (7) 180o, (8) 90o.
One of way to find out the accuracy of center point coordinates is by calculating the Euclidian distance between the center point acquired from the system and the center point as the reference as depicted on Figure 11. This distance is stated by the equation:
DE = [(x1–x2)2 + (y1-y2)2]1/2 (9)
For this distance measure, the pixel having a distance less than or equal to some value r from (x,y) are the point contained in a disk of radius r centered at (x,y). In the implementation, (x1,y1) is set to be the
reference measurement of center point coordinates and (x2,y2) is set to be the acquired center point
coordinates from the system. The lower the Euclidian distance is, the closer the two compared center points, which also means that the center detection is less error. On the other hand, the higher the Euclidian distance is, the higher the center detection error by the system.
Euclidian Distance of Center Points Detected
0 2 4 6 8 10
0 2 4 6 8 10 12 14 16 18 20 22 24 26 28 30
Sample No.
p
ix
e
l(
s
)
From the calculation of Euclidian distances of the samples, it can be concluded that the average value of the Euclidian distances is 3.112 with the standard deviation 1.69. The pupil and iris radius determination results will affect in the iris image
Std = 0.5 Std = 1 Std = 1.5
Figure 9. Effect of Varying the Gaussian St. Dev.
Figure 10. Hysteresis Threshold Setting in Canny Edge Detection (a) t = 0.0001 (b) t = 0. 1 (c) t = 0.4
Figure 11. The Euclidian Distance of Center Point Detections
(a) Color Image (b) Grayscale image
mapping toward the iridology chart. First the parameter of this pupil radius is compared to the reference pupil radius of each image samples.
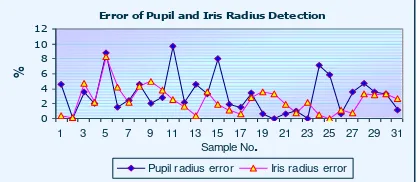
From the sample measurement, the average percentage of pupil radius differences is 3.029% and 2.469% for iris radius detection. The differences which appear in this detection can be caused by the existences of broken edges in the edge detection result which lead to the failure of the pixel tracing of pupil boundary.
Error of Pupil and Iris Radius Detection
0 2 4 6 8 10 12
1 3 5 7 9 11 13 15 17 19 21 23 25 27 29 31
Sample No.
%
Pupil radius error Iris radius error
.
Rather alike the pupil radius determination, the iris radius is calculated by tracing pixel by pixel to compare the pixel value of edges. The differences between the two determination is that the pixel tracing of pupil boundary is performed radially from the center point of image to outer, meanwhile the pixel tracing of iris boundary is moving from outer side of the image to the center point. The restriction of these two determinations is alike; the possibility of incorrect boundary detection is affected by the existence of broken boundary edges.
From the sample measurement, the average percentage of pupil radius differences is 3.029% and 2.469% for iris radius detection as can be seen on Figure 12. The differences which appear in this detection can be caused by the existences of broken edges in the edge detection result which lead to the failure of the pixel tracing of pupil boundary.
Error of Lung and Pleura Boundary Detection
0 2 4 6 8 10
1 3 5 7 9 11 13 15 17 19 21 2 2 2 2 31 Sample No.
%
r = length of zone 4, 5, and 6
r1 = distance of center to inner boundary of zone 4
r2 = distance of center to outer zone 6
After the center point, pupil radius and iris radius have been determined, the next step is using these parameters to locate the lung and pleura areas. To perform this, the lengths of inner zone 4 and outer zone 6 have to be calculated first. This should
be done because in addition to the lung and pleura are located between 8 to 10 o’clock for the right iris and 2 to 4 o’clock for the left iris, they are located in zone 4, 5 and 6 as mentioned previously.
The average error percentage of inner boundary of zone 4 to the outer boundary of zone 6 distances is 3.88%. The average error percentage of center
point to inner boundary of zone 4 length is 2.496%,
meanwhile the average error percentage of center point to outer boundary of zone 6 length is 2.47%. The results are given on Figure 13.
3.6 Extraction
The aim of this extraction process is to get the pixels which are adequately qualified to give the information about the stadiums. Simply to say, the extracted pixels will also contain the unwanted information because the extraction method used here is not smart enough to classify the four stadiums. It is the responsibility of the next process to classify these four stadiums and separate the useless information.
By experiment, the threshold values those are
suitable enough to separate the pixels’ colors
differences are 0 for the lower threshold and 15 for the upper threshold.
3.7 Binary Representation
In the implementation level, the input of classifier (binary character format) must be converted into the proper form so it is suitable with the calculation process.
3.8 Classification Using ART 1
The vigilance parameter (ρ) determines the similarity tolerated by the classifier. The bigger the value ρ is, the higher the degree of similarity of intra class pattern groupings.
The degree of similarity required for intraclass pattern groupings is adjustable so that many class groupings of highly similar patterns are created when a similarity threshold value is set to a high level. At the other extreme, fewer classes are created when the threshold is set to a low value. In the latter case, class members may possess a lesser degree of similarity. This phenomenon can be seen on Table 4.
Similarity threshold value (rho)
Effect on similarity of class members
High Highly similar patterns Low Lesser degree of similarity
Vigilance parameter which is symbolized as rho (ρ) has the value that ranges from one to zero. Rho equals to 1 means that no other input pattern is recognized excluded the trained patterns.
Figure 12. The Error Percentages of Pupil and Iris Radius Determination
Figure 13. The Percentage of Inner Boundary of Zone 4 and Outer Boundary of Zone 6
The architecture will then have to decide what it will do toward these new patterns; whether it will make new categories for these new patterns or not. In this implementation, unknown kind of patterns is treated as normal condition; which is outside of the four stadium categories.
In this experimental research, the vigilance parameter is varied from the biggest rho value (1) to 0.1 to get the proper range of rho which gives the best result of classification. From the trial, this vigilance parameter range is 0.5 to 0.1; meanwhile the best detection of the four stadiums (91.40625%) is resulted by rho 0.4 as shown in Table 5.
89.84375% 91.40625% 81.25%
The performance of this classification system implementation is done by comparing the stadium decisions detected by the system with the stadiums decided by the iridologist as shown in Figure 14. The accuracy is measured for each stadium of each sample. This measurement is performed by using the value of vigilance parameter 0.4 to get better 91% for degenerative stadium as given in Table 6.
3.9 Speed of System
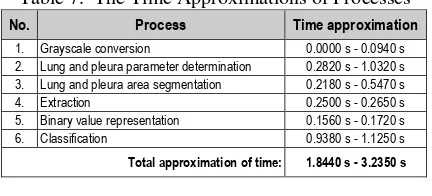
The time calculation of processes in the system is shown in Table 7.
No. Process Time approximation
1. Grayscale conversion 0.0000 s - 0.0940 s 2. Lung and pleura parameter determination 0.2820 s - 1.0320 s 3. Lung and pleura area segmentation 0.2180 s - 0.5470 s 4. Extraction 0.2500 s - 0.2650 s 5. Binary value representation 0.1560 s - 0.1720 s 6. Classification 0.9380 s - 1.1250 s
Total approximation of time: 1.8440 s - 3.2350 s
From the time measurement above, the total time approximation of process ranges from 1.8440 seconds to 3.2350 seconds. This time approximation shows that the system implementation approaches the speed of a real time application.
Figure 14. Decision Comparison
Algorithm by
Table 5. The Accuracy of The Four Stadiums
of Lung Disorders Using Three Different rhos Table 6. The Accuracy of Each Stadium
of Lung Disorders rho = 0.4
4. Conclusions and Further Research
4.1 Conclusions
1. The average sensitivity of lung and pleura
parameters achieved by using the setting of Gaussian standard deviation 1 and hysteresis threshold 0.1 are:
a. 2.027% error for x-coordinate
b. 2.005% for y-coordinate of center point detection
c. 3.029% error of pupil radius detection d. 2.469% error of iris radius detection e. 3.88% error of the length of iris detection f. 2.496% error of center point to inner
boundary of zone 4 distance detection g. 2.47% error of center point to outer boundary
of zone 6 distance detection
2. The architecture of ART 1 neural network in this
lung and pleura stadiums detections consists of 24 input nodes of layer F1, according to the 24-bit of binary RGB value of each pixel; meanwhile the output nodes of layer F2 are set to be 4, according to the amount of the four stadiums to detect.
3. The vigilance parameter value which results the best accuracy of system is 0.4, which gives the accuracy 91.40625% of the right lung stadiums detection.
4. The accuracy of each right lung samples is a. 100% acute stadium;
b. 97% subacute stadium;
c. 78% chronic stadium;
d. 91% degenerative stadium.
5. The approximation of time needed for the whole
processes is ranging from 1.8440 seconds to 3.2350 seconds.
4.2 Further Research
1. Taking the accuracy and speed achieved by this lung and pleura stadiums detection into consideration, the system may be implemented practically in real time implementation or online pre-diagnosis for new employees medical test examination.
2. Neural network of adaptive resonance theory 1 (ART 1) can also be implemented in biometric system, while varying the vigilance parameter value to accommodate the sensitivity of the identification system.
References
[1] Gonzalez, Rafael C. and Woods, Richard E.,
1993, Digital Image Signal Processing,
Addison-Wesley Publishing Company, USA.
[2] Green, Bill, 2002, Canny Edge Detection
Tutorial
[3] Handayani, Irma, 2002, Identifikasi Iris Mata Menggunakan Filter Gabor Wavelet dan
Jaringan Syaraf Tiruan, STT Telkom,
Bandung.
[4] Haykin, S., 1994, Neural Networks: A
Comprehensive Foundation, Macmillan, New
Jersey.
[5] Heins, L.G. and Tauritz, D.R., May/June 1995, Adaptive Resonance Theory (ART): An Introduction.
[6] Jensen, B., 1980, Iridology Simplified, Bernard Jensen Enterprises, Escondido, California.
[7] Jensen, B., 1984, What is Iridology?, Bernard Jensen Publisher, Escondido, California.
[8] Ninov, Val, April 1997, ART 1 Matlab
Simulation Function, Concordia University, Montreal, Canada.
[9] Patterson, Dan W., 1996, Artificial Neural
Network: Theory and Applications, Prentice Hall, Singapore.
[10] Schalkoff, Robert J., 1992, Pattern
Recognition: Statistical, Structural and Neural Approach, John Wiley & Sons, Inc, Canada.
[11] Shinyoung Lim, Lee, Byeon, and Kim,
Efficient Iris Recognition through
Improvement of Feature Vector and Classifier
[12] Sid, M.A., and Ahmed, 1995, Image
Processing: Theory, Algorithms, &
Architecture, McGraw-Hill, Singapore.
[13] Suherman, E., Eko Mulyanto, Purnomo, Mauridhi Hery, 2002, Deteksi Tingkat Energi melalui Iris Mata dengan Pengolah Citra dan
Jaringan Syaraf Tiruan, Proceeding of
Seminar on Intelligent Technology and its Applications (SITIA 2002), Institut Teknologi Sepuluh Nopember, Surabaya.
[14] Tanaka, T. and Weintzenfeld, A., Adaptive Resonance Theory.
[15] www.milesresearch.com/iris pigmentation.html
[16] Yong Zhu, Tan, and Wang, Biometric