(1)
Bobby Fernando, Mahasiswa Teknik Informatika, Fakultas Teknik, Universitas Kristen Duta Wacana, Yogyakarta. Email: [email protected]
A retail company usually produce large sales transactions data. These data can be utilized with the application of data mining, which is also known as knowledge data discovery. Association rules is one of the most famous data mining study that can be used to generate items that frequently purchased together in sales transactions.
This project is a web-based data mining project for a company called Amigo Group. The algorithm used for association rules implementation is called FP-Growth algorithm. This algorithm will form a data structure called FP-Tree and extract the rules based on its FP-Tree. The result of this application will be used to help Amigo Group’s managers understand about customers buying behavior and analyze pattern of items which are usually purchased together. Then, the manager can create marketing strategies in order to increase sales of the items.
Key Words: Data Mining, FP-Growth, FP-Tree.
1. Introduction
1.1. Problem background
There are some problems underlying the existence of this project. The first problem
is that there is no data mining techniques implemented in Amigo Group’s system yet.
Amigo Group’s managers and assistants still decide the price and make assumption based
on the previous transaction manually (manual system). The second problem is the
capabilities of the shop managers to do manual analysis are not good because most of them
are only graduates from senior high school level and do not continue to higher education
level. Based on those problems, the managerial level of Amigo Group decide that they need
a data mining system with affinity analysis capabilities to help their managers in doing
analysis on sales transactions data.
1
Teknik Informatika, Fakultas Teknologi Informasi,Universitas Kristen Duta Wacana
2
1.2. Constrains
Application constraints regarding with this application are as follow:
• The system uses three years data (2006 - 2008) from ‘Bimbo’ shop (one of Amigo Group’s branches).
• The system will provide six special event options for the system.
• The system will generate only pair of items in every rule generated.
• User (Manager) cannot recover his / her own password.
• The dashboard visualization’s method is using Bar Charts.
2. Basic of Theories
the rules satisfy both of the threshold (minimum support and minimum confidence), then the
rules are considered as an interesting rule.
2.2. FP-Growth Algorithm
FP-Growth Algorithm is one of the currently fastest and most popular algorithm for
frequent itemset mining. There are two big steps to implement FP-Growth Algorithm:
• Step 1: Build a compact data structure called FP-Tree
• Step 2: Extracts frequent itemset directly from the FP-tree
2.2.1. Step 1: Build FP-Tree
First of all, prepare the transaction data that will be used for this application. Figure
Figure 1. ‘sales transactions’ table
The next step is to decide minimum support of the system. Minimum support is one
example of threshold that must be set in order to eliminate items that are not satisfied the
number of support in the sales transactions data. For this example, set the minimum support
= 3.
The next step is to create two tables called ‘header item’ table and ‘ordered sales
transactions’ table. The ‘header item’ table can be generated by counting support of each
item and then remove the items that are not satisfy the minimum support. The rest of the
items that satisfy the number of threshold then ordered in descending sort and inserted into
‘ordered sales transaction’ table.
Figure 2. ‘header item’ table
Figure 3. ‘ordered sales transaction’ table
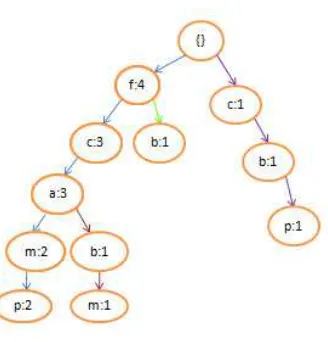
The final step of this step 1 is to create the FP-Tree based on the data on Figure 3. The top
node of the tree is always called a “ROOT” and direct child of “ROOT” is called a ‘level 1
node’. The first item in each of the TID is the ‘level 1 node’ of the tree, but if the ‘level 1
node’ is already existing, just add 1 (+1) to its support. There is no need to create a new
Figure 4. The FP-Tree
2.2.2 Step 2: Extract and Mining Rules from FP-Tree
In the beginning of ‘Step 2’, The FP-Tree data that has been generated from the
previous process will be processed into ‘conditional pattern bases’ table. To create
‘conditional pattern bases’ table, do these following steps for non-level 1 node:
• Starting at the frequent header table in the FP-Tree.
• Traverse the FP-Tree by following the link of each frequent item.
• Accumulate all of transformed prefix paths of that item to form conditional pattern base.
Figure 5. The process of making ‘conditional pattern bases’ table
After the ‘conditional pattern bases’ table has been generated, the next step is create
‘conditional pattern tree’ from each of frequent item in ‘conditional pattern bases’ table. At
this time, remember that the minimum support is three. For each of the item on ‘conditional
pattern bases’ table, extract the frequent item and its support. Find nodes with same value
and merge it into one value with summed support value. An example on Figure 6 tells the
Because ‘m’ has {fca:2},{fcab:1} as its conditional pattern-base data, then the
extraction of the pattern become:
• f:2, c:2, a:2 and
• f:1, c:1, a:1, b:1
The same nodes are f, c, and a, The merged nodes value for each of them are f:3, c:3, a:3
and b:1. At this stage, the minimum support elimination occur again, b:1 will be eliminated
because its support is not satisfy the minimum support value. So, f:3, c:3, and a:3 becomes
the conditional FP-Tree data for node ‘m’.
Figure 6. Process of creating conditional FP-Tree data for node ‘m’.
The final steps of every association rules algorithm is to mine the frequent-pattern
(the rules) generated from the processes. The rules can be generated by doing combination
on pivot items with its ‘conditional FP-Tree’ items. Figure 7 display the final result
Figure 7. ‘Frequent-pattern generated’ table
3. Implementation
The implementation of FP-Growth algorithm comes in a form of wizard setup. To
run the wizard, a user must log into the system by using ‘manager’ level of user account.
The setup wizard will have six steps (six pages) and must be done sequentially in order to
generate the result. The result of this wizard will be displayed in the ‘dashboard’ page and
‘rules’ page.
3.1. Capture of some steps in the wizard page
Figure 9. Steps of the wizard – chose data range based on period of time
Figure 10. Steps of the wizard – frequent itemset generation
3.2. Capture of the result interface in the ‘rules’ page
Figure 11. Rules generated in ‘datatables’ interface
Figure12. Rules generated in dashboard interface
4. Result Analysis and Explanation
To analyze the generated rules, several tables have been made to compare the result
of this application.
Table 1. Result of top 3 rules from January 2006 – December 2008
(minimum support > 100)
No Rules Support Confidence
1 CELANA PENDEK KAOS ==> LGN PDK 0.0590 % 74.161 %
2 CLN COKLAT FAMATEX ==> HEM KOJAR
PUTRA 0.0190 % 56.6137 %
3 CELANA PENDEK JEANS ==> LGN PDK 0.0910 % 54.3374
Table 1 display the top 3 rules based on the confidence level of the rules. By
looking at those top 3 rules, an analysis can be made, the sales transactions data shows that
most of ‘Bimbo’ shop customers are usually buy shorts and shirts together. The second rule
reflects that a male trouser with brand ‘FAMATEX’ is usually purchased together with
t-shirts with brand ‘KOJAR’. These rules are generated based on three years data. The
support level of rules 1 (0.0590 %) means that the numbers of transactions that include
shorts and shirts together is 0.0590 % compared with the total numbers of items available in
the database during three years period. The confidence percentage of rules 1 (74.161 %)
reflects the confidentiality level / how sure we can trust the integrity of rule: ‘CELANA
PENDEK KAOS ==> LGN PDK’.
Table 2. Comparison of top 1 rule from three years ‘Idul Fitri’ data
(minimum support > 10)
Idul Fitri
orientation are usually increased because lots of customers need new stuff to support their
daily activities.
Table 2 display the comparison of the most popular items that frequently purchased
together during the ‘Idul Fitri’ Feast Day based on the confidence level of the rules. By
looking at those rules, the manager can realize that there is a trend changing of customer’s
wear during the ‘Idul Fitri’ Feast Day. The 2006 result shows that most of the customer are
still buy Moslem wear to overcome the ‘Idul Fitri’ Feast Day. They purchased ‘Daleman
kerudung’ for woman together with ‘Sarung dewasa’ for men in one transaction. But in
2007 and 2008 ‘Idul Fitri’ Feast Day, the pattern of items that bought together do not
related with Moslem wear anymore. Customers pretend to choose more casual wear like
shorts, shirts, t-shirts, and long jeans. The managers can take advantages here by creating a
promotional product mix for the most ‘famous’ items that usually purchased together or
even for some items that are still in the average support and confidence number in order to
increase their point of sales.
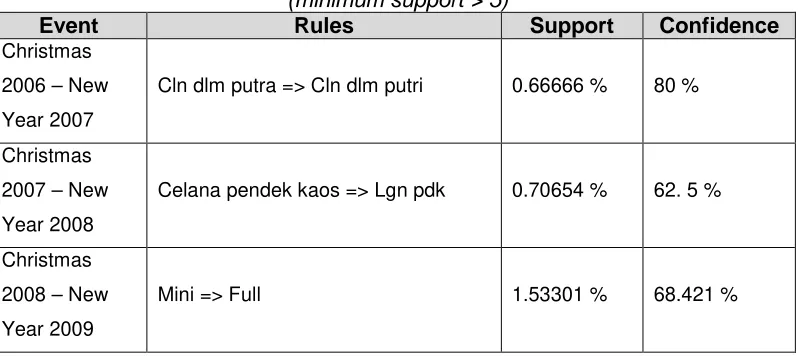
Table 3. Comparison of top 1 rule from three years ‘Christmas and New year’ data
Table 3 display the comparison of the most popular items that frequently purchased
together during the ‘Christmas and New Year’ period based on the confidence level of the
rules. By looking at those rules, the manager can realize that items that occurs in the top
rules are not highly affected by Christmas / New Year, but more related with geographical
weather and the rainy season during the end of the year. The shop employees of Amigo
Group can do cross-selling to their customers to offer items that usually purchased together
in the end of the year. Based on the result, underwear for women are the most frequent
items that usually bought during the ‘Christmas and New Year’ period. This is considering
as an interesting rule because the application can generate result that is unpredictable (there
is no relation between underwear and Christmas).
In addition, the manager can also make per-year rules analysis to create a catalog
design. The catalog design can contain promotional product mix, best-offer products and
special price for most frequent-pattern. Hopefully, this catalog design will help the
company to increase sales and gain more business profits.
4. Conclusion
Based on research and rules that have been generated, the conclusions are as follow:
1) This application can be used as a tool to help sales transaction analysis and the result reflects affinity analysis between items.
2) The rules which are generated by the system can be used for marketing strategies and decision making to support business strategies. The example of marketing
strategies are promotional product mix, cross-selling and catalog design.
3) This project has met its objectives and the application successfully generate pair of association rules.
4) In the future, this application can be developed to generate more items combination in the rule.
Bibliography
Agrawal, R, Mannila, H, Srikant, R, Toivonen, H & Verkarno, AI. (1996). Fast discovery of Association Rules.
Viewed 5 May 2010, http://sci2s.ugr.es/keel/pdf/algorithm/capitulo/agrawal96.pdf
Borgelt, C. An Implementation of FP-Growth Algorithm. Viewed 19 August 2010,
http://www.google.co.id/url?sa=t&source=web&cd=2&ved=0CCcQFjAB&url=http%3A%2F%2Fciteseerx.
ist.psu.edu%2Fviewdoc%2Fdownload%3Fdoi%3D10.1.1.162.1209%26rep%3Drep1%26type%3Dpdf&rct=
j&q=An%20Implementation%20of%20the%20FP-
Gutierrez, N. (2006). Demystifying Market Basket Analysis. Viewed 18 August 2010,
http://www.information-management.com/specialreports/20061031/1067598-1.html
Han, J & Kamber, M. (2001). Data Mining – concepts and techniques. Morgan Kaufmann, San Fransisco.
Margahny, MH & Mitwaly, AAD. (2005). Fast Algorithm for Mining AssociationRules. Paper presented to the
AIML 05 Conference, Cairo, Egypt, 19-21 December.
Verhein, F. (2008). Frequent Pattern Growth (FP-Growth) Algorithm An Introduction. Viewed 18 August 2010,