DEFORMATION MEASUREMENT USING SENTINEL-1A/B IMAGERY
M. Crosetto a, *, O. Monserrat , N. Devanthéry a a, M. Cuevas-González a, A. Barra a, B. Crippa b
a Centre Tecnològic de Telecomunicacions de Catalunya (CTTC/CERCA), Division of Geomatics, Av. Gauss 7, E-08860,
Castelldefels (Barcelona), Spain - (mcrosetto, omonserrat, ndevanthery, mcuevas, abarra)@cttc.cat b Department of Geophysics, University of Milan, Via Cicognara 7, I-20129, Milan, Italy - [email protected]
Commission III, WG III/3
KEY WORDS: Deformation, monitoring, atmosphere, time series.
ABSTRACT:
Land deformation monitoring based on C-band Synthetic Aperture Radar Sentinel-1A/B imagery is the main focus of this paper. This type of data is exploited using a Persistent Scatterer Interferometry technique. The paper describes a deformation monitoring strategy, which is related to a specific monitoring scenario: a relatively small deformation area of interest surrounded by a stable area. In the case study considered in this work, the scenario corresponds to an area of potential subsidence induced by underground water pumping. In this specific case, the deformation area of interest has a radius of approximately 1 km. The proposed monitoring strategy takes advantage of the specific scenario at hand, and, in particular, of the availability of stable areas close to the area that potentially is affected by deformation. In this paper we briefly describe the proposed data analysis strategy. The key component of the strategy, i.e. the estimation of the atmospheric component, is illustrated in detail. Some examples of the two main products of the procedure, i.e. the deformation velocity map and the deformation time series, are discussed.
* Corresponding author
1. INTRODUCTION
This paper is focused on land deformation monitoring using C-band Sentinel-1A/B imagery and the Persistent Scatterer Interferometry (PSI) technique. The PSI technique represents an advanced class of the differential interferometric SAR techniques, which makes use of multiple SAR images acquired over the same site and appropriate tools to separate the deformation signal of interest from other components of the PSI observations, such as the residual topographic error component, the atmospheric component and the phase noise. For a comprehensive review of PSI, see Crosetto et al. (2016).
The PSI techniques have experienced a major development in the last decades, which has been mainly related to C-band data from ERS-1/2, Envisat and Radarsat sensors. The advent, in 2007, of very high resolution X-band data (TerraSAR-X and CosmoSkyMed) enabled a major step forward for the PSI techniques, e.g. see Strozzi et al (2009), Crosetto et al. (2010), Gernhardt and Bamler (2012) and Lan et al. (2012).
A new significant improvement comes from the availability of C-band data from the sensors on board the Sentinel-1A and 1B satellites. The potential of Sentinel-1-based PSI has been documented in the literature. Barra et al. (2016) and Barra et al (2017) use Sentinel-1 data for landslide detection and mapping. A case study related to a mega-landslide is described in Dai et al. (2016). Different studies concern volcano monitoring, e.g. see González et al. (2015) and De Luca et al. (2016). Examples related to subsidence monitoring are discussed in Crosetto et al. (2015) and Shirzaei et al. (2017). Finally, a case of infrastructure monitoring (long bridges) is described in Huang et al. (2017).
In this work we address the deformation monitoring over an urban area. In particular, we consider a specific monitoring scenario by assuming that the area to be monitored is surrounded by a stable area. The monitoring strategy exploits this stable area. In Section 2 we describe the proposed monitoring strategy. The results of the deformation monitoring are discussed in Section 3.
2. PROPOSED PROCEDURE
The proposed procedure involves the following steps.
• Generation of a redundant stack of multi-look interferograms.
• 2+1D phase unwrapping of the redundant multi-look interferograms (Devanthéry et al., 2014).
• Identification of a stable area in the surroundings of the area of interest.
• Atmospheric component estimation using the stable area. This component is assumed to be linear.
• Removal of the estimated atmospheric component from the original single-look interferograms.
• Estimation of linear deformation velocity and residual topographic error using the periodogram (Biescas et al., 2007).
• Removal of the residual topographic error from the original single-look interferograms.
• 2+1D phase unwrapping of the redundant single-look (residual topographic error-free) interferograms. Generation of the deformation time series.
• Estimation of the deformation velocity starting from the time series.
• Geocoding.
The International Archives of the Photogrammetry, Remote Sensing and Spatial Information Sciences, Volume XLII-2/W7, 2017 ISPRS Geospatial Week 2017, 18–22 September 2017, Wuhan, China
This contribution has been peer-reviewed.
3. A MONITORING CASE STUDY
The monitoring case study considered in this work concerns an urban area with ongoing constructions works. The construction works involve underground water pumping, which can potentially induce subsidence in an area of approximately 1 km radius around the construction area, hereafter referred to as study area. A wider area, of approximately 16 km2, was considered in the monitoring.
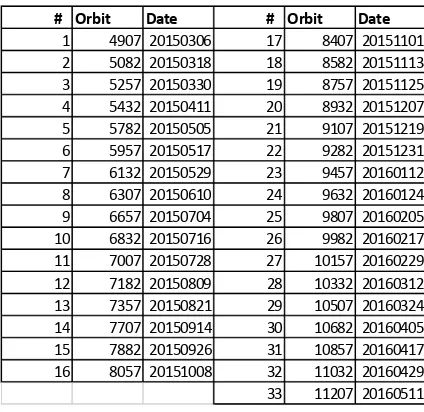
The first analysis was based on 33 Sentinel-1 images, covering the period from October 2015 to May 2016, see Table 1. Figure 1 illustrates the atmospheric component estimation using the stable area. The figure on the top shows the phase of the 33 images, which cover an area of approximately 16 km2. All the values of the first image are set to zero. The black circles in the middle of the area indicate the 1 km radius study area. The figure in the middle show the linear atmospheric components that were estimated without considering the 1 km radius study area. Finally, the figure at the bottom shows the residual phase after removing the linear atmospheric component.
# Orbit Date # Orbit Date
1 4907 20150306 17 8407 20151101
2 5082 20150318 18 8582 20151113
3 5257 20150330 19 8757 20151125
4 5432 20150411 20 8932 20151207
5 5782 20150505 21 9107 20151219
6 5957 20150517 22 9282 20151231
7 6132 20150529 23 9457 20160112
8 6307 20150610 24 9632 20160124
9 6657 20150704 25 9807 20160205
10 6832 20150716 26 9982 20160217
11 7007 20150728 27 10157 20160229
12 7182 20150809 28 10332 20160312
13 7357 20150821 29 10507 20160324
14 7707 20150914 30 10682 20160405
15 7882 20150926 31 10857 20160417
16 8057 20151008 32 11032 20160429
33 11207 20160511
Table 1: Sentinel-1 dataset used in this work.
Figure 1. Atmospheric component estimation using a stable area. 33 original phases that cover an area of approximately 16 km2 (top). The black circles show the study area (1 km radius, approximately). Linear atmospheric components (middle). Residual phase
after removing the linear atmospheric component (bottom).
The International Archives of the Photogrammetry, Remote Sensing and Spatial Information Sciences, Volume XLII-2/W7, 2017 ISPRS Geospatial Week 2017, 18–22 September 2017, Wuhan, China
This contribution has been peer-reviewed.
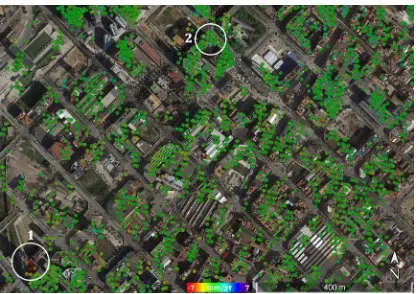
Figure 2. Deformation velocity map over a portion of the area of interest.
Figure 3. Deformation time series of point 1, whose location is shown in Figure 2.
Figure 4. Deformation time series of point 2, whose location is shown in Figure 2.
The International Archives of the Photogrammetry, Remote Sensing and Spatial Information Sciences, Volume XLII-2/W7, 2017 ISPRS Geospatial Week 2017, 18–22 September 2017, Wuhan, China
This contribution has been peer-reviewed.
One may notice that, after removing the atmospheric phase component, the 12th image (highlighted by a red circle) shows a rather strong phase variation in comparison with the other images. This image, which is probably affected by strong local atmospheric artefacts, was discarded in the following processing.
After removing the atmospheric component, we estimated the linear deformation velocity and residual topographic error. After removing the latter component, we estimated the time series using the 2+1D phase unwrapping. Subsequently, from the time series we estimated the deformation velocity. Figure 2 shows an example of deformation velocity. From this image one may appreciate the spatial density of the Sentinel-1 based measurements. In general, the area shown in Figure 2 is stable. We consider in the following the deformation time series of two points that cover the period from May 2015 to December 2016.
Point 1 shows a deformation away from the satellite, which accumulates approximately 6 mm in the radar line-of-sight, see Figure 3. Notwithstanding the rather noisy appearance of the time series, the deformation pattern is well-defined. In addition, the point is also clearly visible in the deformation velocity map.
Point 2 shows a more complex deformation pattern, which is approximately sinusoidal. It is worth observing that in the deformation velocity map the point correctly appear as basically “stable”. This point shows displacements that are due to thermal expansion. This is evident by considering the plot of the temperature of the area of interest in correspondence to the time of acquisition of the Sentinel-1 images, see the grey line in Figure 4. One may appreciate that the black (displacement) and the grey (temperature) lines show a strong temporal correlation. This example illustrates the deformation monitoring potential of the medium resolution Sentinel-1 data.
REFERENCES
Barra, A., Monserrat, O., Mazzanti, P., Esposito, C., Crosetto, M., & Scarascia Mugnozza, G., 2016. First insights on the potential of Sentinel-1 for landslides detection. Geomatics, Natural Hazards and Risk, 7(6), 1874-1883.
Barra, A., Monserrat, O., Crosetto, M., Cuevas-Gonzalez, M., Devanthéry, N., Luzi, G., & Crippa, B., 2017. Sentinel-1 data analysis for landslide detection and mapping: first experiences in Italy and Spain. Proc. of Workshop on World Landslide Forum, 201-208. Springer, Cham.
Biescas E., Crosetto M., Agudo M., Monserrat O., Crippa B., 2007. Two radar interferometric approaches to monitor slow and fast land deformations. Journal of Surveying Engineering, 133(2), 66-71.
Crosetto, M., Monserrat, O., Iglesias, R., Crippa, B., 2010. Persistent Scatterer Interferometry: potential, limits and initial C- and X-band comparison”. Photogrammetric Engineering & Remote Sensing, 76(9), 1061-1069.
Crosetto, M., Devanthéry, N., Cuevas-González, M., Monserrat, O., Crippa, B., 2015. Exploitation of the full potential of PSI data for subsidence monitoring. Proc. of Nisols, Ninth International Symposium on Land Subsidence, 15-19 November 2015, Nagoya (Japan). Proc. IAHS, 372, 311-314, doi:10.5194/piahs-372-311-2015, 2015.
Crosetto, M., Monserrat, O., Cuevas-González, M. Devanthéry, N., Crippa, B., 2016. Persistent Scatterer Interferometry: a review. ISPRS Journal of Photogrammetry and Remote Sensing, 115, 78-89.
Dai, K., Li, Z., Tomás, R., Liu, G., Yu, B., Wang, X., Cheng. H. Chen, J., Stockamp, J., 2016. Monitoring activity at the Daguangbao mega-landslide (China) using Sentinel-1 TOPS time series interferometry. Remote Sensing of Environment, 186, 501-513.
De Luca, C., Bonano, M., Casu, F., Fusco, A., Lanari, R., Manunta, M., ... & Zinno, I. (2016). Automatic and Systematic Sentinel-1 SBAS-DInSAR Processing Chain for Deformation Time-series Generation. Procedia Computer Science, 100, 1176-1180.
Devanthéry, N., Crosetto, M., Monserrat, O., Cuevas-González, M., Crippa, B., 2014. An approach to Persistent Scatterer Interferometry. Remote Sensing, 6, 6662-6679.
Gernhardt, S., Bamler, R., 2012. Deformation monitoring of single buildings using meter-resolution SAR data in PSI. ISPRS Journal of Photogrammetry and Remote Sensing, 73, 68-79.
González, P. J., Bagnardi, M., Hooper, A.J., Larsen, Y., Marinkovic, P., Samsonov, S.V., Wright, T.J., 2015. The 2014– 2015 eruption of Fogo volcano: Geodetic modeling of Sentinel‐1 TOPS interferometry. Geophysical Research Letters, 42(21), 9239-9246.
Huang, Q., Crosetto, M., Monserrat, O., & Crippa, B. (2017). Displacement monitoring and modelling of a high-speed railway bridge using C-band Sentinel-1 data. ISPRS Journal of Photogrammetry and Remote Sensing, 128, 204-211.
Lan, H., Li, L., Liu, H., Yang, Z., 2012. Complex urban infrastructure deformation monitoring using high resolution PSI. J. Selected Topics in Applied Earth Observations and Remote Sensing, 5(2), 643-651.
Shirzaei, M., Bürgmann, R., & Fielding, E. J. (2017). Applicability of Sentinel‐1 Terrain Observation by Progressive Scans multitemporal interferometry for monitoring slow ground motions in the San Francisco Bay Area. Geophysical Research Letters, 44(6), 2733-2742.
Strozzi, T., Teatini, P., Tosi, L., 2009. TerraSAR-X reveals the impact of the mobile barrier works on Venice coastland stability. Remote Sensing of Environment, 113(12), 2682-2688. The International Archives of the Photogrammetry, Remote Sensing and Spatial Information Sciences, Volume XLII-2/W7, 2017
ISPRS Geospatial Week 2017, 18–22 September 2017, Wuhan, China
This contribution has been peer-reviewed.