Keywords: Conceptual Model, Location-Based Services (LBS), Mobile Payments (M-Payment), Mobile Services, Partial Least Square (PLS), Perceived Risk
INTRODUCTION
The smartphone, now a valuable and critical business tool for mobile delivery of products and services, has been investigated by academics, professionals, and the media (Bauer, Barnes, Reichardt, & Neumann, 2005; Gao & Küpper, 2006; Hsu & Kulviwat, 2006; Leppäniemi & Karjaluoto, 2005; Varshney & Vetter, 2002). Industry experts predict that the range and ex-tent of mobile products and services available through smart mobile devices will increase
exponentially in the coming months and years, as more and more commercial entities realize their profit potential.
The widespread penetration of smart mobile devices facilitates the rapid growth of mobile based services. A location-based service (LBS) provides services location-based on the user’s geographical location. It is possible to classify LBSs based on the target market: customer (B2C) and business-to-business (B2B), the service type: infotainment, navigation, information provision, games, emergency response, supply chain manage-ment and tracking (Giaglis, Kourouthanassis, &
Drivers and Inhibitors of
Mobile-Payment Adoption
by Smartphone Users
Pavel Andreev, University of Ottawa, Canada Nava Pliskin, Ben-Gurion University of the Negev, Israel
Sheizaf Rafaeli, University of Haifa, Israel
ABSTRACT
Tsamakos, 2003) or, as classified in this study, the delivery mode: pull and push (Paavilainen, 2002). The Pull services are sent to the user upon request while the Push services are non-request based (Unni & Harmon, 2007). According to industry analyses of the current mobile LBS market, the main drivers of this market’s rapid growth include success of new mobile business models, expansion of mobile advertising, expanding of network coverage and increasing of high speed mobile Internet (Pyramid Research, 2011).
Another factor related to this growth is mobile payments (M-Payments). Leading play-ers in the mobile market provides a variety of solutions facilitating of M-Payments. Google proposes, for instance, smartphones with built-in NFC-powered digital wallets (http://www. google.com/wallet/ retrieved on November 24th, 2011). While the share of NFS-enabled smartphones is predicted to reach 30% to 50% of the market by 2014, mobile network op-erators, banks, and third parties have provided other technological and business solutions. For example, billionaire Richard Branson invested in the startup Square, which proposes an in-novative M-Payment solution by integrating the existing technologies of smartphone and credit card (https://squareup.com/ retrieved on November 24th, 2011).
Despite visible M-Payment advantages and regardless of the noticeable agiotage around ex-pectations for M-Payment boom, the status quo shows that there are still many factors inhibiting user willingness to M-Pay. Indeed, a study by the Portio Research (2010) demonstrated that, in 2009, 81.3 million people worldwide M-Paid (2% of mobile subscribers) and forecasted the rise to nearly 490 million (8% of mobile sub-scribers), by the end of 2014, raising interest in investigating factors driving and inhibiting the willingness to M-Pay.
The objective of this study is thus to in-crease understanding of M-Payment drivers and inhibitors, through modeling and empirically assessing the willingness of users to M-Pay. The study’s scope is limited to Push-LBS for which users exercise less control over their
interaction with the service provider (Xu, Hock-Hai, Tan, & Agarwal, 2010) and since behavioral attitudes and intentions regarding Push-LBS remain blurred and hardly addressed by literature. Moreover, while adoption of ad-vanced mobile devices facilitates new business opportunities for mobile commerce sector, the future of the Push-LBS boom depends on user willingness to M-Pay.
The next section explores the theoretical grounding for the development of conceptual model described in the third section. Then we outline the methods of data collection and analysis, followed by description of the results obtained via empirical assessment using the partial least square (PLS) approach to structural equation modeling (SEM). The last section is devoted to the discussion and the conclusions.
THEORETICAL BACKGROUND
Past research mostly explored drivers of technology adoption leaving inhibitors out of the model. The model development in this study considers, in addition to perceived ease of use and perceived usefulness, two drivers discussed already in the M-Payment context, two trust drivers and perceived risk as an inhibitor.
Vendor Trust. In buyer–seller relationships, trust is defined as the willingness of the buyer to be vulnerable to a seller based on the belief that the seller will transact in a manner consistent with the buyer’s confident expectations (Pavlou & Gefen, 2004). Consumer trust in an online vendor has significant effects on their decisions to purchase from the vendor’s website (Chau, Hu, Lee, & Au, 2007). In general, consumers find it substantially more difficult to judge the trustworthiness of a vendor in an online set-ting than in the conventional business context (Reichheld & Schefter, 2000). Consequently, vendor trust can significantly affect customer intention to purchase online (Gefen & Straub, 2003). Applying this concept to mobile com-merce, trust is crucial given the anonymous buyer-seller interactions and the lack of formal contractual agreements (Lie, Fang, & Pavlou, 2010). Andreev, Duane, and O’Reilly (2011) found that Vendor Trust is a key factor ex-plaining the willingness of smartphone users to M-Pay for mobile media services.
Mechanism Trust. Mechanism trust per-tains to the infrastructure and regulation norms that enables transactions between users and LBS providers (Treiblmaier & Chong, 2007). Dinev (2006) examined trust in the Internet as a mechanism and found that many users are well aware that there is a certain amount of risk that data are captured during transmission even if the vendor is trustworthy. Cheung and Lee (2003) recommend that in the highly impersonal domain of Internet commerce, an objective third party and the government should play an important role with regard to the underlying mechanism. Duane, O’Reilly, and Andreev (2011) found that dividing the trust construct into vendor trust and mechanism trust is es-sential to revealing the real different impact of the trust domain on the willingness to M-Pay.
Specifically in the context of mobile commerce, they proposed that an independent objective third party and the government would play roles in establishing legislation and standards of service. Mechanism trust is thus critical in the context of this study as it imposes a risk factor of its own.
Perceived Ease of Use. Following TAM re-search (Davis, 1989; Venkatesh & Davis, 1996), and given the technical limitations of mobile devices, ease of use becomes an imminent factor in acceptance of mobile applications (Schierz, Schilke, & Wirtz, 2010). Schierz et al. (2010) noted that ease of use becomes even more im-portant for M-Payment services which need to provide benefits when it comes to ease of use.
Perceived Usefulness. TAM research has illustrated that both perceived ease of use and perceived usefulness and determine the con-sumer’s attitude toward use (Viehland & Leong, 2007). Dahlberg (2008) demonstrated the role of perceived usefulness in explaining acceptance of mobile payments and more recent research (Xu et al., 2010) found perceived usefulness as a critical driving factor in LBS adoption.
Perceived Risk. Featherman and Pavlou (2003) validated empirically the direct and indirect negative impact of perceived risk on user adoption intention, deriving the definition of perceived risk from Bauer (1960) as combina-tion of uncertainty and seriousness of outcome. M-Payments pose security risks and uncertainty for smartphone users similar to those associated with the non-mobile Internet technology (Guo, Wang, & Zhu, 2004; Gururajan, 2006). Indeed, according to previous research (Chen, 2008; Im, Kim, & Han, 2008; Suh & Han, 2002), consumers are concerned with security and privacy when using their smartphones to M-Pay. Authentication, confidentiality, data integrity and non-repudiation are also mentioned in the literature as key risk issues (Chen, 2008).
MODEL DEVELOPMENT
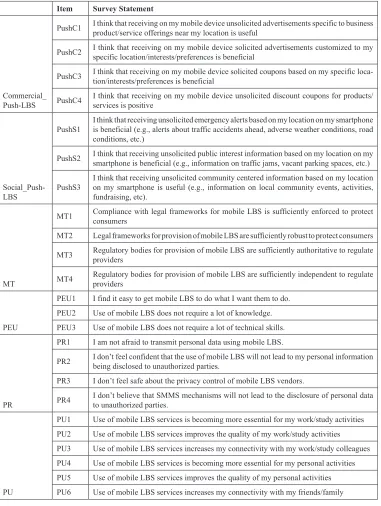
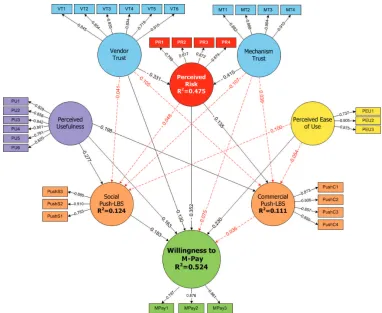
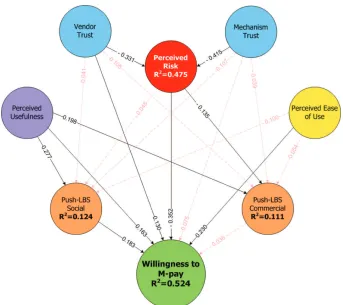
the literature on conceptual models regard-ing technology adoption, trust, and behavior and expands conceptual models developed in previous research on willingness to M-Pay (Andreev et al., 2011; Duane et al., 2011), is depicted in Figure 1. The model contains the five constructs presented in the previous sec-tion as theoretically crucial for explaining the willingness to M-Pay: four drivers - Vendor Trust (VT), Mechanism Trust (MT), Perceived Usefulness (PU), and Perceived Ease of Use (PEU) as well as one inhibitor – Perceived Risk (PR). Two additional constructs, willingness to engage in Social Push-LBS and willingness to engage in Commercial Push-LBS are also included in the proposed model. Initially, the Willingness to engage in Push-LBS construct was developed for this study during modeling but, based on factor analysis, was divided into the two social and commercial Push-LBS con-structs. This split makes sense since people use their smartphones to communicate with their social network (Noll, 2006). They use Social Push-LBS as unsolicited personalized LBS of a social nature where public information or localized emergency or notification alerts are pushed, and Commercial Push-LBS as unsolicited personalized LBS of commercial nature where targeted marketing, promo-tions, discounts, and special offers are pushed (O’Reilly & Duane, 2010; Xu et al., 2010). The rest of this section is devoted to defining 19 research hypotheses, which represent relation-ships between the research constructs depicted in Figure 1. In operationalising the constructs in this study, indicators from the literature were adopted in developing survey questions for the data-collection phase and the construct items along with their associated survey statements are depicted in Table 1. Since the main goal of the conceptual model is exploring impacts on willingness to M-Pay and for the sake of model parsimony, some relationships between presented in the model constructs mentioned in the literature (e.g., relation between PEU and PU) were omitted from the model.
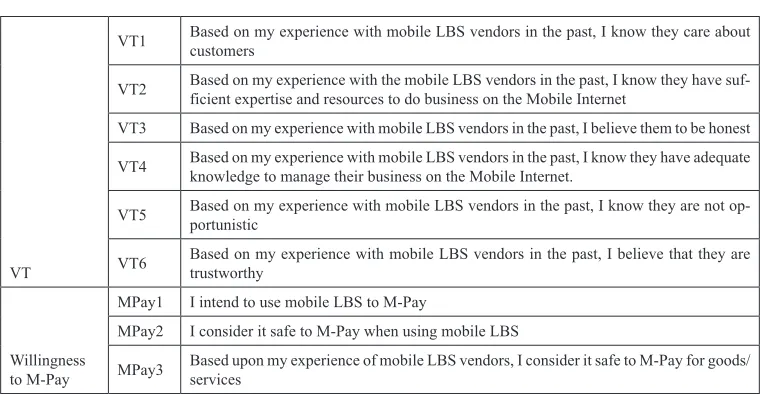
Willingness to M-Pay. The widely ac-cepted three dimensions of intention (MPay1), and safety (MPay2) and (MPay3) were em-ployed to measure this variable.
Vendor Trust. The widely accepted three dimensions of competence, integrity and be-nevolence were employed in six (two for each domain) reflective indicators to measure the Vendor Trust construct, and the following four hypotheses were derived:
Hypothesis 1: User trust in mobile LBS vendors positively impacts upon their willingness to engage in Social Push-LBS.
Hypothesis 2: User trust in mobile LBS vendors positively impacts upon their willingness to M-Pay.
Hypothesis 3: User trust in mobile LBS vendors positively impacts upon their willingness to engage in commercial Push-LBS. Hypothesis 4: User trust in mobile LBS vendors
decreases perceived risk.
Mechanism Trust. Four indicators reflect-ing perceptions of smartphone users regard-ing the legal framework and regulatory-body legislations were employed to measure the Mechanism Trust construct in this study and, by analogy with Vendor Trust, four similar hypotheses were derived:
Hypothesis 5: Mechanism trust decreases perceived risk.
Hypothesis 6: Mechanism trust positively impacts upon user willingness to engage in social Push-LBS.
Hypothesis 7: Mechanism trust positively impacts upon user willingness to M-Pay. Hypothesis 8: Mechanism trust positively
impacts upon user willingness to engage in commercial Push-LBS.
measure the Perceived Risk construct, and three hypotheses were derived:
Hypothesis 9: Perceived risk negatively impacts upon user willingness to engage in social Push-LBS.
Hypothesis 10: Perceived risk negatively impacts upon user willingness to M-Pay. Hypothesis 11: Perceived risk negatively
im-pacts upon user willingness to engage in commercial Push-LBS.
Perceived Usefulness. Six manifest indica-tors were employed to measure reflections of the Perceived Usefulness construct on different
aspects of LBS usability, and three hypotheses were derived:
Hypothesis 12: Perceived usefulness positively impacts upon customer willingness to engage in Social Push-LBS.
Hypothesis 13: Perceived usefulness positively impacts upon customer willingness to make an M-Payment.
Hypothesis 14: Perceived usefulness positively impacts upon customer willingness to engage in Commercial Push-LBS.
Perceived Ease of Use. Three indicators were employed to measure reflections of the
Table 1. Items and survey statements
Item Survey Statement
Commercial_ Push-LBS
PushC1 I think that receiving on my mobile device unsolicited advertisements specific to business product/service offerings near my location is useful
PushC2 I think that receiving on my mobile device solicited advertisements customized to my specific location/interests/preferences is beneficial
PushC3 I think that receiving on my mobile device solicited coupons based on my specific loca-tion/interests/preferences is beneficial
PushC4 I think that receiving on my mobile device unsolicited discount coupons for products/services is positive
Social_Push-LBS
PushS1 I think that receiving unsolicited emergency alerts based on my location on my smartphone is beneficial (e.g., alerts about traffic accidents ahead, adverse weather conditions, road conditions, etc.)
PushS2 I think that receiving unsolicited public interest information based on my location on my smartphone is beneficial (e.g., information on traffic jams, vacant parking spaces, etc.)
PushS3 I think that receiving unsolicited community centered information based on my location on my smartphone is useful (e.g., information on local community events, activities, fundraising, etc).
MT
MT1 Compliance with legal frameworks for mobile LBS is sufficiently enforced to protect consumers
MT2 Legal frameworks for provision of mobile LBS are sufficiently robust to protect consumers
MT3 Regulatory bodies for provision of mobile LBS are sufficiently authoritative to regulate providers
MT4 Regulatory bodies for provision of mobile LBS are sufficiently independent to regulate providers
PEU
PEU1 I find it easy to get mobile LBS to do what I want them to do. PEU2 Use of mobile LBS does not require a lot of knowledge. PEU3 Use of mobile LBS does not require a lot of technical skills.
PR
PR1 I am not afraid to transmit personal data using mobile LBS.
PR2 I don’t feel confident that the use of mobile LBS will not lead to my personal information being disclosed to unauthorized parties.
PR3 I don’t feel safe about the privacy control of mobile LBS vendors.
PR4 I don’t believe that SMMS mechanisms will not lead to the disclosure of personal data to unauthorized parties.
PU
PU1 Use of mobile LBS services is becoming more essential for my work/study activities PU2 Use of mobile LBS services improves the quality of my work/study activities PU3 Use of mobile LBS services increases my connectivity with my work/study colleagues PU4 Use of mobile LBS services is becoming more essential for my personal activities PU5 Use of mobile LBS services improves the quality of my personal activities PU6 Use of mobile LBS services increases my connectivity with my friends/family
Perceived Ease of Use construct, and three hypotheses were derived:
Hypothesis 15: Perceived ease of use positively impacts upon customer willingness to engage in Social Push-LBS
Hypothesis 16: Perceived ease of use positively impacts upon customer willingness to make an M-Payment.
Hypothesis 17: Perceived ease of use positively impacts upon customers’ willingness to engage in Commercial Push LBS.
Willingness to engage in Social and Com-mercial Push-LBS. Three indicators (PushC1 to PushC3) were employed to measure the Social Push-LBS construct, four indicators (PushS1 to PushS4) were used to measure the Commercial Push-LBS construct, and two hypotheses were derived:
Hypothesis 18: User willingness to engage in Social Push-LBS positively impacts upon customer willingness to M-Pay.
Hypothesis 19: User willingness to engage in Commercial Push-LBS positively impacts upon customer willingness to M-Pay.
The next section elaborates upon the method employed in this study.
METHOD
Data Collection
A survey questionnaire instrument was used to test the developed model (Figure 1). Following generation of an initial version of the instrument according to Hair et al. (2006), the authors conducted a pre-test by asking veteran users of mobile devices to respond to the question-naire in order to assess the semantic content of construct items and to facilitate refinement of the items to be included in the survey. At the end of the pre-test process, best-fitting question-naire items that reflected the definitions of the constructs were retained (Table 1). Data were collected in March to April 2011 by posting the final survey questionnaire on “Attentive”, a feedback-management solutions from Ransys Feedback Technologies that facilitated a web-based survey, inviting members of the target population by mail, Facebook, or forums to respond online.
VT
VT1 Based on my experience with mobile LBS vendors in the past, I know they care about customers
VT2 Based on my experience with the mobile LBS vendors in the past, I know they have suf-ficient expertise and resources to do business on the Mobile Internet
VT3 Based on my experience with mobile LBS vendors in the past, I believe them to be honest
VT4 Based on my experience with mobile LBS vendors in the past, I know they have adequate knowledge to manage their business on the Mobile Internet.
VT5 Based on my experience with mobile LBS vendors in the past, I know they are not op-portunistic
VT6 Based on my experience with mobile LBS vendors in the past, I believe that they are trustworthy
Willingness to M-Pay
MPay1 I intend to use mobile LBS to M-Pay
MPay2 I consider it safe to M-Pay when using mobile LBS
MPay3 Based upon my experience of mobile LBS vendors, I consider it safe to M-Pay for goods/services
The study targeted Israeli university stu-dents who were ahead of the general public in adopting smartphones since the three leading mobile network operators have chosen stu-dents and soldiers as a target population prior expanding their marketing campaigns to the entire population. One operator went as far as to sign an agreement with the Student Union which dramatically increased the growth of the student sector among the community of smartphones users. According to the agree-ment, students received significant benefits in both purchasing smartphones and subscribing to unlimited data plans. Another reason for targeting the Israeli student population is that recent research shows (e.g., Scevak, 2010) that the age group is a very critical factor in the adoption of advanced mobile devices and the usage of mobile media services, including location-based ones and that people under the age of 30 are significantly more willing to M-Pay than people in younger or older age groups. Hence college and university students form the best target population, especially since they are more financially independent than teenag-ers. This is especially true in Israel where the
average age of undergraduate students is 25, older than in other countries. Despite offering legitimate justifications for targeting Israeli students, further research should target a wider population to reveal and explore more diverse patterns than observed in this study.
Data Analysis
The data collected were statistically analyzed mainly using a component-based Partial Least Squares (PLS) structural equation modeling (SEM) model-testing tool with reflective constructs for model evaluation. The PLS SEM approach is appropriate since it allows simultaneous exploration of both the measure-ment (outer) model, relating the measuremeasure-ment variables (MVs) to their latent variables (LVs), and the structural (inner) model, relating the LVs to each other (Chatelin, Vinzi, & Tenen-haus, 2002; Diamantopoulos, 2006; TenenTenen-haus, Vinzi, Chatelin, & Lauro, 2005). In addition, the component-based PLS approach allows for testing of the relationships in the model with less restrictive requirements than the covariance-based SEM approach. Another reason for
choosing the PLS tool is that it is considered appropriate for testing models at an early stages of development (Fornell & Bookstein, 1982), as is the case in this study.
RESULTS
Descriptive Statistics
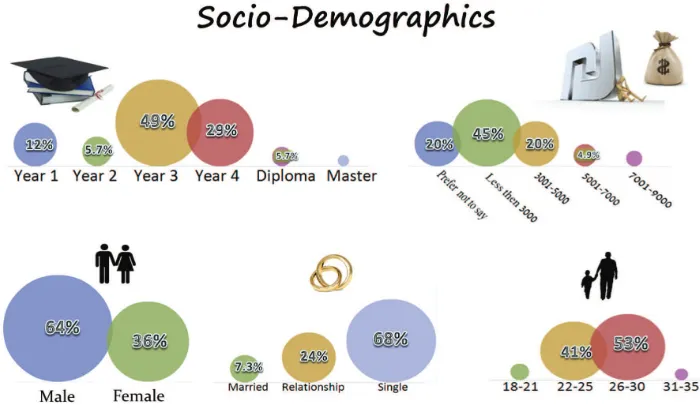
The survey data were collected during March to April 2011at Ben-Gurion University of Negev (BGU), Israel. The request to participate in the survey was sent to the students via mail, Face-book, and BGU student forums. One hundred and twenty two valid responses were received from smartphone users. Figure 2 presents the socio-demographic segmentation of the
respon-dents, revealing that a typical respondent is an undergraduate unmarried student, 22 to 30 years old, who holds a part-time job. The Internet is accessed via a mobile phone for less than one hour per day by 77% of respondents, while 50% talk on their mobile phone for less than an hour per day. More than 10 text messages per day are sent by 42% of the respondents, but 73% never send an MMS message, while 28% never send a mail message from their smartphones and 68% never M-Pay via their smartphones. Thus the mobile technology profile of a typical respondent is someone who accesses the Internet via their mobile phone for less than an hour per day, regularly uses their mobile phone for talking, SMS and email but rarely for sending MMS messages or for M-Paying.
Model Evaluation
SmartPLS 2.0 M3 was employed for evaluating the PLS model. Although a sample size of 122 is relatively small, it is sufficient to get reliable PLS results because it meets the generally ac-cepted rule of thumb that defines the minimum sample size as 10 times the most complex relationship within the research model (Chin, 1998). In the studied research model, the most complex construct has six reflective indicators, leading to a minimum necessary sample size of 60 respondents.
PLS models with reflective constructs have a well-defined and widely accepted evaluation technique. The list of assessment criteria, first summarized and proposed by Chin (1998), was accepted and further adopted by researchers from different research fields (e.g., Gefen, Straub, & Boudreau, 2000; Henseler, Ringle, & Sinkovics, 2009; Tenenhaus et al., 2005). Step 1 of the evaluation process for the PLS path model involves testing the quality of the measurement (outer) models. If Step 1 is suc-cessful and the latent constructs are reliable and valid, Step 2 is pursued to assess the structural (inner) model (Henseler et al., 2009).
Assessment of Measurement Models
To assess the measurement model, we performed tests showing that the manifest variables (indica-tors) in the research model are reliable and valid.
Reliability. The estimated values of the Cronbach’s α for all constructs are above 0.8, indicating that all items are equally reliable. Composite reliability for all constructs at above 0.88 demonstrates internal consistency. As depicted in Figure 3, the magnitude of all indicators is higher than the minimum required value of 0.707, indicating individual reliability (Chin, 1998; Gefen et al., 2000; Henseler et al., 2009). The test results indicate that all indica-tors are reliable.
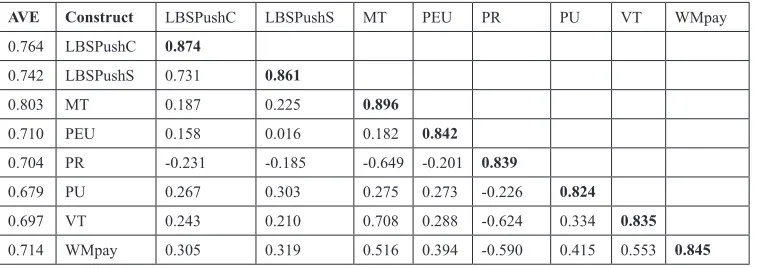
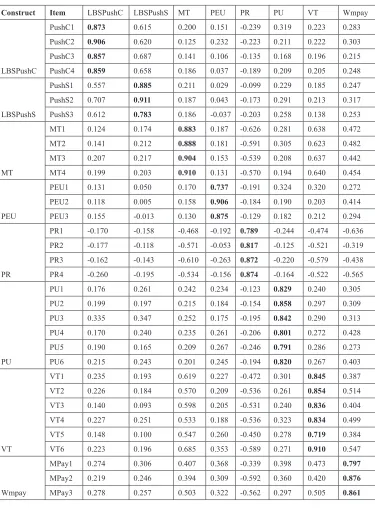
Validity. For validating constructs, we examined the convergent and discriminant validities. Sufficient convergent validity is indicated since the first column in Table 2 shows that the average variance extracted (AVE) for all constructs is higher than 0.5. Discriminant validity refers to two appropriate patterns of the construct inter-indicators. First, the variance of a construct should be aligned more with their own indicators than with other constructs. For this purpose, we compared construct cross-correlation and the square root of each con-struct’s AVE. Table 2 shows that all constructs have sufficient discriminant validity since the square root of each latent construct’s AVE (along the diagonal) is larger than the correlation of the specific construct with any other reflective construct (under the diagonal) in the research model. Second, the results of the cross-loading test in Table 3 demonstrate that an indicator of any specific construct has a higher loading on its own construct than on any other construct.
Table 2. Construct cross-correlation matrix and AVE analyses
AVE Construct LBSPushC LBSPushS MT PEU PR PU VT WMpay 0.764 LBSPushC 0.874
0.742 LBSPushS 0.731 0.861
0.803 MT 0.187 0.225 0.896 0.710 PEU 0.158 0.016 0.182 0.842 0.704 PR -0.231 -0.185 -0.649 -0.201 0.839
Table 3. Discriminant validity - cross loadings
Construct Item LBSPushC LBSPushS MT PEU PR PU VT Wmpay
LBSPushC
PushC1 0.873 0.615 0.200 0.151 -0.239 0.319 0.223 0.283 PushC2 0.906 0.620 0.125 0.232 -0.223 0.211 0.222 0.303 PushC3 0.857 0.687 0.141 0.106 -0.135 0.168 0.196 0.215 PushC4 0.859 0.658 0.186 0.037 -0.189 0.209 0.205 0.248
LBSPushS
PushS1 0.557 0.885 0.211 0.029 -0.099 0.229 0.185 0.247 PushS2 0.707 0.911 0.187 0.043 -0.173 0.291 0.213 0.317 PushS3 0.612 0.783 0.186 -0.037 -0.203 0.258 0.138 0.253
MT
MT1 0.124 0.174 0.883 0.187 -0.626 0.281 0.638 0.472 MT2 0.141 0.212 0.888 0.181 -0.591 0.305 0.623 0.482 MT3 0.207 0.217 0.904 0.153 -0.539 0.208 0.637 0.442 MT4 0.199 0.203 0.910 0.131 -0.570 0.194 0.640 0.454
PEU
PEU1 0.131 0.050 0.170 0.737 -0.191 0.324 0.320 0.272 PEU2 0.118 0.005 0.158 0.906 -0.184 0.190 0.203 0.414 PEU3 0.155 -0.013 0.130 0.875 -0.129 0.182 0.212 0.294
PR
PR1 -0.170 -0.158 -0.468 -0.192 0.789 -0.244 -0.474 -0.636 PR2 -0.177 -0.118 -0.571 -0.053 0.817 -0.125 -0.521 -0.319 PR3 -0.162 -0.143 -0.610 -0.263 0.872 -0.220 -0.579 -0.438 PR4 -0.260 -0.195 -0.534 -0.156 0.874 -0.164 -0.522 -0.565
PU
PU1 0.176 0.261 0.242 0.234 -0.123 0.829 0.240 0.305 PU2 0.199 0.197 0.215 0.184 -0.154 0.858 0.297 0.309 PU3 0.335 0.347 0.252 0.175 -0.195 0.842 0.290 0.313 PU4 0.170 0.240 0.235 0.261 -0.206 0.801 0.272 0.428 PU5 0.190 0.165 0.209 0.267 -0.246 0.791 0.286 0.273 PU6 0.215 0.243 0.201 0.245 -0.194 0.820 0.267 0.403
VT
VT1 0.235 0.193 0.619 0.227 -0.472 0.301 0.845 0.387 VT2 0.226 0.184 0.570 0.209 -0.536 0.261 0.854 0.514 VT3 0.140 0.093 0.598 0.205 -0.531 0.240 0.836 0.404 VT4 0.227 0.251 0.533 0.188 -0.536 0.323 0.834 0.499 VT5 0.148 0.100 0.547 0.260 -0.450 0.278 0.719 0.384 VT6 0.223 0.196 0.685 0.353 -0.589 0.271 0.910 0.547
Wmpay
Assessment of the Structural Model To assess the structural model, we performed tests regarding explanatory power and predic-tive power as well as predicpredic-tive relevance.
Explanatory power. The research model explains 52.4% of the variance of the depen-dent construct, Willingness to M-Pay (Figure 3). According to Chin’s criteria (Chin, 1998), the model explains the dependent construct at a moderate explanation level, since cut-off R2
values of 0.67, 0.33, or 0.19 for endogenous latent variables are indicative of substantial, moderate, or weak explanation levels respec-tively (Chin, 1998, p. 323). Vendor Trust and Mechanism Trust explain Perceived Risk also at a moderate level with R2 =0.475. Perceived
Usefulness is the only significant factor influ-encing willingness to engage in Commercial Push-LBS and explains 11.1% of its variance. Then Perceived Ease of Use and Perceived Use-fulness constructs explain 12.4% of willingness to engage in Social Push-LBS. We explored changes in R2 to investigate the substantive
impact of each independent construct on the
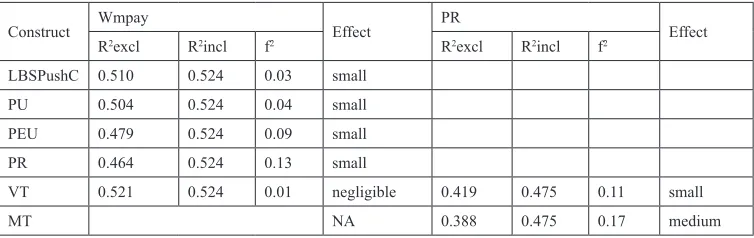
dependent constructs, carrying out the effect size technique by re-running seven PLS estimations and excluding in each run one of the explain-ing latent constructs. Chin (1998) proposed to use the effect size f2 of PLS constructs which,
similar to Cohen’s implementation for multiple regression, the cut-offs f2 levels for small,
medium, and large effects are 0.02, 0.15, and 0.35. Table 4 represents a summary of the quan-titative results of the effect-size test, showing that Vendor Trust has hardly any direct impact on the Willingness to M-Pay (f2=0.01). The
effects of all other constructs were found to be small. We also found that, on Perceived Risk, Vendor Trust has a small effect (f2=0.11) and
Mechanism Trust has a medium effect (f2=0.17)
Predictive power. The t-test for each path coefficient was conducted with 300 subsample repetitions, employing the bootstrapping re-sampling procedure for testing the statistical significance of the path coefficients.. The evaluation of the structural model showed that nine paths coefficients are statistically insig-nificant (see dotted arrows in Figure 3).
Table 4. Effect size test
Construct Wmpay Effect PR Effect
R2excl R2incl f2 R2excl R2incl f2
LBSPushC 0.510 0.524 0.03 small PU 0.504 0.524 0.04 small PEU 0.479 0.524 0.09 small PR 0.464 0.524 0.13 small
VT 0.521 0.524 0.01 negligible 0.419 0.475 0.11 small
MT NA 0.388 0.475 0.17 medium
Table 5. Blindfolding test for predictive relevance
Construct SSO SSE Q2
LBSPushC 488 448.67 0.08
LBSPushS 366 332.80 0.09
PR 488 323.61 0.34
Predictive relevance. We also performed the Stone and Geisser Q2 test for evaluation of the
structural model’s predictive relevance. Accord-ing to Chin (1998), Q2 reflects an index of
good-ness of reconstruction by model and a negative Q2 indicates absence of predictive relevance,
while a positive Q2 provides evidence that the
omitted observations were well-reconstructed and that predictive relevance is achieved. As demonstrated in Table 5, all values of Q2 are
positive, indicating predictive relevance. Table 6 illustrates that 10 of the 19 research hypotheses are supported by the findings of the model estimations and data analyses in this study.
DISCUSSION AND
CONCLUSION
Understanding user willingness to M-Pay has become an important issue for researchers and
practitioners. While Pull-LBS has been the focus of much research, Push-LBS remains under-investigated despite its commercial potential. The goal of this study is to increase the understanding of M-Payment drivers and inhibitors through modeling and empirically assessing the willingness of users to M-Pay via smartphones for Push-LBS.
Past research has demonstrated that trust is a key factor influencing the Willingness to M-Pay (Andreev et al., 2011), with Vendor Trust revealed as the critical aspect and Mechanism Trust found statistically insignificant (Duane et al., 2011). Our study adds further empirical evidence of the insignificance of Mechanism Trust in explaining user willingness to M-Pay.
The empirical analysis presented in this study reveals that the direct impact of Vendor Trust on Willingness to M-Pay is rather small, with Vendor Trust being strongly mediated by Perceived Risk. Indeed, Perceived Risk is the
Table 6. Summary of hypothesis testing
Vendor Trust
→ LBSPushSoc H1 + Not Supported - -→ WillToMPay H2 + Supported 0.130 0.000 → LBSPushCom H3 + Not Supported - -→ PerceivedRisk H4 - Supported -0.331 0.000
Mechanism Trust
→ PerceivedRisk H5 - Supported -0.415 0.000 → LBSPushSoc H6 + Not Supported - -→ WillToMPay H7 + Not Supported - -→ LBSPushCom H8 + Not Supported -
-PerceivedRisk
→ LBSPushSoc H9 - Not Supported - -→ WillToMPay H10 - Supported -0.352 0.000 → LBSPushCom H11 - Supported -0.135 0.000
PerceivedUsefulness
→ LBSPushSoc H12 + Supported 0.277 0.000 → WillToMPay H13 + Supported 0.163 0.000 → LBSPushCom H14 + Supported 0.198 0.000
PerceivedEaseOfUse
-main inhibitor of Willingness to M-Pay. In other words, Perceived Risk has the highest negative impact on Willingness to M-Pay. Moreover, the magnitude of this inhibitor’s negative impact is at least twice the magnitude of any driver’s positive impact (Figure 4). Consequently, to significantly reduce any fears that smartphone users may harbor which inhibit user willingness to M-Pay, the main challenge for practitioners with regard to M-Payments is to facilitate reduction of Perceived Risk by evaluating the potential risks as well as establishing, monitor-ing, and reviewing appropriate data protection and privacy safeguards.
The findings also reveal that Perceived Ease of Use has a strong positive impact on Willingness to M-Pay. In terms of impact mag-nitude, this factor is second after Perceived Risk. Interpreting this finding for practitioners,
the key point is that issues pertaining to us-ability are more important than those pertaining to usefulness in terms of impacts on Willingness to M-Pay.
The respondents were asked a series of questions regarding their attitudes towards various Push-LBS services. The analysis of responses shows that the context of the service in question mattered, with social preferred to commercial and strong positive attitude found toward emergency Push-LBS services. Thus, our findings reveal that consumers are willing to pay for Social Push-LBS but not for Commercial LBS. Practitioners of Commercial Push-LBS might therefore consider incorporating some social context into their service portfolio to attract potential users.
In addition to meeting the central goal of clarifying the impacts of a variety of factors on
Willingness to M-Pay, the empirical findings of the study reveal some interesting patterns. The analysis explains 47.5% of the variance as-sociated with Perceived Risk and suggests that the main risk factors are related to Vendor and Mechanism Trust, with the role of Mechanism Trust being critical in explaining Perceived Risk. This suggests that respondent risk perception of M-payments is perhaps elevated by their concern with the weakness of existing legal framework and regulatory-body legislations with regard to M-Payments.
The study shows that both Vendor and Mechanism Trust have no impact on the will-ingness to engage in Social and Commercial Push-LBS. Thus, to understand Push-LBS driv-ers, practitioners need to explore factors other than trust. The finding that respondents willing to engage in Social Push-LBS are also indiffer-ent to Perceived Risk, demonstrates that Social Push-LBS smartphone users acknowledge and overcome privacy and security concerns. In addition, Perceived Risk negatively impacts those smartphone users who are not in favor of participation in Commercial Push-LBS.
Another key finding of this study for practitioners in charge of prioritizing services is that Perceived Usefulness has positive im-pacts on the willingness to engage in Social and Commercial Push-LBS, and smartphone users value Social Push-LBS benefits more than Commercial Push-LBS benefits.
Perceived Ease of Use was found not to affect the willingness to engage in both Social Push-LBSs and Commercial Push-LBSs. One explanation for this finding is that Ease of Use is a non-issue for students who are very experi-enced with mobile devices. However, previous research conducted in another country (Andreev et al., 2011) demonstrated that Perceived Ease of Use has positive impact on the willingness to engage in mobile services. This contradic-tion points to this study’s main limitacontradic-tion, i.e., its focus on a specific demographic segment in one country. For the sake of generality, further research should collect data from a wider user population around the world.
The finding of this study, that Perceived Risk is the main inhibitor of user willingness to M-Pay is consistent with past research. The finding that the magnitude of this inhibitor’s negative impact is at least twice the magnitude of any driver’s positive impact, is the study’s main added value compared to previous work. Based on this finding, it is safe to suggest that the tangible benefits of this service must outweigh the intrusion, privacy, and security concerns of users before the full potential of M-Payments would be realized.
ACKNOWLEDGMENT
We acknowledge with deep appreciation and much gratitude the great work of Shani As-saraf and Osnat Nahmias who assisted during their senior year as students in the Department of Industrial Engineering and Management at Ben-Gurion University of the Negev.
REFERENCES
Andreev, P., Duane, A., & O’Reilly, P. (2011). Con-ceptualising consumer perceptions of contactless m-payments through smart phones. Paper presented at the IFIP WG 8.2 International Federation for Information Processing on Researching the Future, Turku, Finland.
Bauer, H. H., Barnes, S. J., Reichardt, T., & Neu-mann, M. M. (2005). Driving consumer acceptance of mobile marketing: A theoretical framework and empirical study. Journal of Electronic Commerce Research, 6(3), 181–192.
Bauer, R. A. (1960). Consumer behavior as risk taking. Dynamic marketing for a changing world. In Proceedings of the 43rd Conference of the American Marketing Association (pp. 389-398).
Chen, L. (2008). A model of consumer acceptance of mobile payment. International Journal of Mo-bile Communications, 6(1), 32–52. doi:10.1504/ IJMC.2008.015997
Cheung, C. M. K., & Lee, M. K. O. (2003). An integrative model of consumer trust in internet shop-ping. In Proceedings of the European Conference on Information Systems (p. 48).
Chin, W. W. (1998). The partial least squares approach to structural equation modeling. In Marcoulides, G. A. (Ed.), Modern methods for business research (pp. 295–336). Mahwah, NJ: Lawrence Erlbaum. Dahlberg, T., Mallat, N., Ondrus, J., & Zmijewska, A. (2008). Past, present and future of mobile pay-ments research: A literature review. Electronic Com-merce Research and Applications, 7(2), 165–181. doi:10.1016/j.elerap.2007.02.001
Dahlberg, T., Mallat, N., & Öörni, A. (2003). Trust enhanced technology acceptance model - consumer acceptance of mobile payment solutions: Tentative evidence. Stockholm Mobility Roundtable, 22-23. Dahlberg, T., & Oorni, A. (2007). Understanding changes in consumer payment habits - Do mobile pay-ments and electronic invoices attract consumers? In Proceedings of the 40th Annual Hawaii International Conference on System Sciences (p. 50).
Davis, F. D. (1989). Perceived usefulness, perceived ease of use, and user acceptance of information tech-nology. Management Information Systems Quarterly, 13(3), 319–340. doi:10.2307/249008
Diamantopoulos, A. (2006). The error term in formative measurement models: Interpretation and modeling implications. Journal of Model Manage-ment, 1(1), 7–17. doi:10.1108/17465660610667775 Dinev, T. (2006). Why spoofing is serious internet fraud. Communications of the ACM, 49(10), 76–82. doi:10.1145/1164394.1164398
Duane, A., O’Reilly, P., & Andreev, P. (2011, December 6). Trusting m-payments - Realising the potential of smart phones for m-commerce: A conceptual model & survey of consumers in Ireland. In Proceedings of the International Conference on Information Systems (p. 22).
Featherman, M. S., & Pavlou, P. A. (2003). Predict-ing e-services adoption: A perceived risk facets perspective. International Journal of Human-Com-puter Studies, 59(4), 451–474. doi:10.1016/S1071-5819(03)00111-3
Fornell, C., & Bookstein, F. L. (1982). Two structural equation models: LISREL and PLS applied to con-sumer exit-voice theory. JMR, Journal of Marketing Research, 19(4), 440–452. doi:10.2307/3151718 Gao, J., & Küpper, A. (2006). Emerging technolo-gies for mobile commerce. Journal of Theoretical and Applied Electronic Commerce Research, 1(2). Gefen, D., & Straub, D. W. (2003). Managing user trust in B2C e-services. E-service Journal, 2(2), 7–24. doi:10.2979/ESJ.2003.2.2.7
Gefen, D., Straub, D. W., & Boudreau, M.-C. (2000). Structural equation modeling and regression: Guide-lines for research and practice. Communications of the Association for Information Systems, 4(7), 1–10. Giaglis, G. M., Kourouthanassis, P., & Tsamakos, A. (2003). Towards a classification framework for mobile location services. In Mennecke, B. E., & Strader, T. J. (Eds.), Mobile commerce: Technology, theory and applications (pp. 67–85). Hershey, PA: IGI Global. doi:10.4018/978-1-59140-044-8.ch004 Guo, C., Wang, H. J., & Zhu, W. (2004). Smart-phone attacks and defenses. In Proceedings of Third ACM Workshop on Hot Topics in Networks, San Diego, CA. Gururajan, R. (2006). A discussion on security risks in mobile commerce. e-Business Review (Federal Reserve Bank of Philadelphia), 7(2), 9–39. Hair, J. F. Jr, Black, W. C., Babin, B. J., Anderson, R. E., & Tatham, R. L. (2006). Multivariate data analysis. Upper Saddle River, NJ: Prentice Hall. Henseler, J., Ringle, C. M., & Sinkovics, R. R. (2009). The use of partial least squares path modeling in international marketing. Advances in International Marketing, 20, 277–319.
Hsu, H. Y. S., & Kulviwat, S. (2006). An integrative framework of technology acceptance model and personalisation in mobile commerce. International Journal of Technology Marketing, 1(4), 393–410. doi:10.1504/IJTMKT.2006.010734
Im, I., Kim, Y., & Han, H. J. (2008). The effects of perceived risk and technology type on users’ accep-tance of technologies. Information & Management, 45(1), 1–9. doi:10.1016/j.im.2007.03.005
Leppäniemi, M., & Karjaluoto, H. (2005). Factors influencing consumers’ willingness to accept mo-bile advertising: A conceptual model. International Journal of Mobile Communications, 3(3), 197–213. doi:10.1504/IJMC.2005.006580
Lie, T., Fang, W., & Pavlou, P. A. (2010). The trian-gular relationship among vendor, user and technol-ogy on trust in mobile commerce: A cross cultural comparison. Retrieved from www.ntpu.edu.tw/ads/ doc/paper%20lee.doc
Moore, G. C., & Benbasat, I. (1991). Development of an instrument to measure the perceptions of adopting an information technology innovation. Information Systems Research, 2(3), 192–222. doi:10.1287/ isre.2.3.192
Noll, J. (2006). Services and applications in future wireless networks. Telektronikk, 102(3-4), 61–71. O’Reilly, P., & Duane, A. (2010). Smart Mobile Media Services (SMMS). Paper presented at the 8th International Conference on Advances in Mobile Computing and Multimedia, Paris, France. Paavilainen, J. (2002). Mobile business strategies: Understanding the technologies and opportunities. Reading, MA: Addison-Wesley.
Pavlou, P. A., & Gefen, D. (2004). Building ef-fective online marketplaces with institution-based trust. Information Systems Research, 15(1), 37–59. doi:10.1287/isre.1040.0015
Portio Research. (2010). Mobile payments 2010-2014. Retrieved November 22, 2011, from http:// www.portioresearch.com/Mob_payments10-14. html
Pyramid Research. (2011). Report forecasts location-based services to reach $10.3 billion by 2015. Retrieved November 22, 2011, from http://www.screenmediadaily.com/news-pyramid- research-location-based-mobile-services-market-forecast-0014001363.shtml
Reichheld, F. F., & Schefter, P. (2000). E-loyalty. Harvard Business Review, 78(4), 105–113. Rogers, E. M. (1995). Diffusion of innovations. New York, NY: Free Press.
Rogers, E. M. (2002). Diffusion of preventive in-novations. Addictive Behaviors, 27(6), 989–993. doi:10.1016/S0306-4603(02)00300-3
Scevak, N. (2010). Forrester Research mobile me-dia and messaging forecast, 2010 to 2015 (Western Europe). Retrieved from http://www.forrester.com/ rb/Research/research_mobile_media_and_messag-ing_forecast,_2010/q/id/57671/t/2
Schierz, P. G., Schilke, O., & Wirtz, B. W. (2010). Understanding consumer acceptance of mobile payment services: An empirical analysis. Elec-tronic Commerce Research and Applications, 9(3), 209–216. doi:10.1016/j.elerap.2009.07.005 Suh, B., & Han, I. (2002). Effect of trust on customer acceptance of Internet banking. Electronic Com-merce Research and Applications, 1(3-4), 247–263. doi:10.1016/S1567-4223(02)00017-0
Tenenhaus, M., Vinzi, V. E., Chatelin, Y.-M., & Lauro, C. (2005). PLS path modeling. Computa-tional Statistics & Data Analysis, 48(1), 159–205. doi:10.1016/j.csda.2004.03.005
Treiblmaier, H., & Chong, S. (2007). Antecedents of the intention to disclose personal information on the Internet: A review and model extension. In Proceed-ings of the Sixth Annual International Workshop on Computer Human Interaction (p. 19).
Unni, R., & Harmon, R. (2007). Perceived effective-ness of push vs. pull mobile location-based advertis-ing. Journal of Interactive Advertising, 7(2), 28–40. Varshney, U., & Vetter, R. (2002). Mobile commerce: Framework, applications and networking support. Mobile Networks and Applications, 7(3), 185–198. doi:10.1023/A:1014570512129
Venkatesh, V., & Davis, F. D. (1996). A model of the antecedents of perceived ease of use: Develop-ment and test. Decision Sciences, 27(3), 451–481. doi:10.1111/j.1540-5915.1996.tb01822.x
Viehland, D., & Leong, R. (2007). Acceptance and use of mobile payments. Paper presented at the 18th Australasian Conference on Information Systems, Toowoomba, QLD, Australia.
Pavel Andreev is a Assistant Professor at the Telfer School of Management, University of Ot-tawa. Dr. Andreev earned his PhD in the Department of Industrial Engineering and Management at Ben-Gurion University of the Negev, Israel in 2009. In 2009-2010 Dr. Andreev worked as a Research Fellow and Visiting Professor at the Business Information Systems Department, Uni-versity College Cork, Ireland, where he was member of the Open Code, Content and Commerce (O3C) project. During the 2010-2011 academic year, Dr. Andreev was a Postdoctoral Fellow and Visiting Professor at Sagy Center for Internet Research and the Study of the Information Society, the Graduate School of Management, University of Haifa, Israel. Dr. Andreev’s main research interests are related to research on Organizational Behavior and Development and to research on Personal/Social Patterns. His worked has been published in a number of interna-tional journals including Transportation Research Part C: Emerging Technologies, and he has presented at leading conferences such as the International Conferences on Information Systems.
Nava Pliskin acquired her PhD and SM degrees from Harvard University and her BSc degree from Tel-Aviv University. She is a tenured full professor at the Department of Industrial Engineering
and Management in Ben-Gurion University, Israel, where she is in charge of the Information Systems programs and heads the Information Systems Management track at the Academic Pro-gram for the Israeli Air Force Flight Course. The Harvard Business School invited her during 1996-1997 to serve as a Visiting Associate Professor and hold the Thomas Henry Carroll Ford Foundation Chair. Professor Pliskin is conducting research on topics related to management and strategy of information systems and her research papers have been published such leading journals as: Journal of the Association for Information Systems, ACM Transactions on Information Systems, Information Society, Communications of the ACM, IEEE Transactions on Engineering Management, and Decision Support Systems.
Sheizaf Rafaeli has been Head of the Graduate School of Management at the University of Haifa since 2006. Prof. Rafaeli (BA, Haifa University, MA, Ohio State University, MA, and PhD, Stan-ford University) also serves as founding Director of the Center for the Study of the Information Society and a Professor at the Graduate School of Management of the University of Haifa Israel, since 1998. Prof. Rafaeli’s interests are in computers as media. He has published on this topic in journals such as Behavior and Information Technology, Communication Research, Computers and the Social Sciences, Computers and Human Behaviour (CHB), Journal of Communication,
Information and Software Technology, Information Systems Research (ISR), Information Systems Journal (ISJ), the European Journal of Information Systems (EJIS), the International Journal of Electronic Business, the International Journal of Human-Computer Studies(IJHCS), Computers and Education, the International Journal of Simulation and Process Modelling (IJSPM), and the