ANALYSIS OF PRESSURE LOSS IN CHANNEL EXPERIMENTAL
FACILITY
Kiswanta, Sudarno
Center for Nuclear Reactor Technology and Safety (CNRTS)-BATAN Gd. 80 Kawasan Puspiptek-Serpong, Tangerang Selatan, Banten
Telp.021-7560912 / Fax. 021-7560913 Email : [email protected]
ABSTRACT
ANALYSIS OF PRESSURE LOSS IN CHANNEL EXPERIMENTAL FACILITY. Channel Experiment Facility (ExNal) is an experimentation facility that can be used to simulate the flow rate of coolant to the research reactor. ExNal can be used to understand the potential occurrence of vibration in the fuel plate. Potential vibration is necessary to know due to vibration can accelerate materials fatique and ultimately could lead to material damage such as cracked fuel and even rupture. From previous research facilities have not been able to achieve the critical speed of 18.062 m/s. The purpose of this study is to analyze the loss of pressure that occurs in parts ExNal. That methodology of research done by calculating the pressure loss through the approach of critical velocity coolant flow that can be known pump efficiency at the ExNal facility. The result showed 0.64 bar of total loss pressure and 64% of pump efficiency. Therefore, parameters such as fluid velocity, flow rate and pressure has not approached the expected results, the capacity of the pump must be improved.
Keywords: experimental channel, the pressure loss, pump efficiency, critical speed, vibration
ABSTRAK
ANALISIS KERUGIAN TEKANAN PADA FASILITAS EKSPERIMEN KANAL. Fasilitas
Eksperimen Kanal (ExNal) adalah sebuah fasilitas eskperimen yang dapat digunakan untuk mensimulasikan kecepatan aliran pendingin pada reaktor riset. ExNal mampu digunakan untuk memahami potensi terjadinya vibrasi pada pelat bahan bakar. Potensi vibrasi ini perlu diketahui karena vibrasi dapat mempercepat kelelahan material dan akhirnya akan dapat memicu terjadinya kerusakan material bahan bakar seperti retak dan bahkan pecah. Dari penelitian sebelumnya fasilitas ini belum mampu mencapai kecepatan kritis sebesar 18,062 m/s. Tujuan dari penelitian ini adalah menganalisis rugi-rugi tekanan yang terjadi pada bagian-bagian ExNal. Metodologi penelitian dilakukan dengan perhitungan kerugian tekanan melalui pendekatan kecepatan kritis aliran pendingin sehingga dapat diketahui efisiensi pompa pada fasilitas ExNal. Dari hasil penelitian diperoleh kerugian tekanan total sebesar 0,64 bar dan efisiensi pompa sebesar 64%. Oleh karena parameter-parameter seperti kecepatan fluida, debit aliran dan tekanan belum mendekati hasil yang diharapkan,maka kapasitas pompa harus ditingkatkan.
Kata kunci : eksperimen kanal, rugi tekanan, efisiensi pompa, kecepatan kritis, vibrasi
INTRODUCTION
Channel Experiment Facility (ExNal) is a research facility for experiments of flow rate of coolant fuel plates research reactor [1]. Therefore the flow rate of coolant can affect fuel plate vibration, the magnitude of the critical cooling speed is necessary to be known [2]. Therefore critical speed is the speed of the cooling during the vibration plate of fuel began to be happened. Vibrations that occur on the plates of fuel could accelerate material fatigue and lead to damage to fuel materials such as cracks, it can even lead to rupture the fuel. Surely fuel damage will leave a serious impact on the safety of reactors which will eventually threaten the community and environment [3,4].
calculate the loss of pressure and pump efficiency at fixed loop. The purpose of this study was to determine the loss of pressure by calculating approach to the critical velocity coolant flow that can be known pump efficiency at facilities ExNal. The purpose of this study is to modify the design of the pump to be able to achieve critical velocity flow so that experiments can be continued.
TEORY
Description of Channel Experiment Facility (ExNal)
ExNal consists of (1) test section plate fuels, (2) pumps, water-cooled (3) flow control valves, (4) pipe, (5) water reservoir tank, (6) flow meter, (7) P inlet pressure test section, (8) P outlet pressure test section, and (9) of the flange pipe joints as shown schematically in Figure 1. Meanwhile, the actual image of ExNal facility is shown in Figure 2. in operating conditions, the sensors in ExNal will measure temperature [°C], the flow rate [L/min] and the cooling water pressure [bar]. By using Figures 1 and 2, ExNal work processes can be explained as follows. The cooling water is in the tank, the water is pumped in up to the part test fuel plate (test section). Section test fuel plates consist of upper plenum, testers channel space and lower plenum. Complete scheme of section plate test this fuel can be seen in Figure 2. Out of water of the test plate through lower fuel plenum. Meanwhile, variations in flow rate can be controlled by the inverter coolant pump and coolant flow divider valve (Valve-1) prior to entry into the upper plenum cooling [1].
Pressure Changes in Fluid Flow Systems
The change in pressure in the fluid flow occurs because of the differences in altitude, the speed difference fluid flow due to changes or differences in cross-section, and friction fluid. Pressure change on the flow without friction can be analyzed with the Bernoulli equation which takes into account changes in pressure into changes in altitude and speed changes [8].
Thus the main concern in analyzing the real flow conditions is the influence of friction. Friction will cause a pressure drop or pressure loss compared to flow without friction. Based on the location of the onset of the loss, the general loss of pressure or friction losses can be classified into two, namely: the loss of major and minor losses [9].
Major losses are due to friction pressure loss of fluid flow on a fixed flow system or constant major. This major losses happens to most cross-section of the flow system and therefore used the term 'major'.
While the losses are minor pressure loss due to friction in the valve - the valve, T connection, the connection L, and the cross-section is not constant. Minor losses covers a small part sectional flow system, so it used the term 'minor'.
Major Pressure losses
Major pressure loses is the pressure loss due to friction in the straight tube flow system which can be calculated by the equation (1) :
(1)
Value f is the friction factor is obtained from the correlation H. Blasius, for turbulent flow in a tube with a smooth surface with an infinite range of Reynolds numbers that can be calculated by the equation (2) :
(2)
For laminar flow f value obtained from the correlation of Hagen-Poiseuille.
(3)
Minor Pressure Losses
In addition to pressure losses due to friction in the system flow tube / pipe straight, there is also the pressure loss due to the curves, widening and narrowing of the cross section, joints, valves, and other accessories. Where is the coefficient of loss on fittings and valves, which are highly dependent on the shape of the component fittings and valves, but not overly influenced by the value of Reynolds number for this type of flow with a large Reynolds number. The values shown in Table 1.
Minor pressures losses to coefficient based are:
(4)
Table 1. Value of loss coefficient, KL [9]
Fitting & Valve Type coefficient of loss, KL
Elbow 90o 0.75
Ball valve with fully open 0.05
Enlargement 1.00 Contraction 0.50
Tee 0.40
Union 0.04
Total Pressure losses
Total pressure losses is the sum of the pressure loss that occurs due to forced convection (forced convection) produced by a circulation pump that causes fluid friction against the tube wall. Pressure losses also occur due to bends and connections that lead to slightly obstructed water flow and pressure losses occur due to differences in cross-sectional area of the surface which is traversed by water.
Based on this, then to calculate the pressure loss (pressure drop) total contained on loop can be used equation (5)
∆P total = ∆P major + ∆P minor (5)
The efficiency of the pump
The pump cannot change the entire kinetic energy into pressure energy because there are some kinetic energy lost in the form loses. Pump efficiency is a factor to calculate this loses. The efficiency of the pump consists of [10]:
a. hydraulic efficiency, taking into account loses due to friction between the impeller and the fluid with loses due to change direction abruptly in the impeller,
b. volumetric efficiency, taking into account the result of the recirculation loses in the ring, bush, and others,
c. mechanical efficiency, taking into account loses due to friction at the seal, packing gland, bearings, and others.
Each pump is designed to the specific capacity and head, although it can also be operated at capacity and head to another. The efficiency of the pump will reach a maximum at the point designed, called the Break Event Point (BEP). For smaller capacity or greater efficiency will be lower. Pump efficiency is the ratio between the power the hydraulic pump with the pump shaft power can be calculated by the equation (6) :
(6) PH is a hydraulic power pumps that can be calculated by the equation (7):
(7)
H is the pump head.
PS is a power symbol of the pump shaft which can be calculated by the equation (8):
(8) with :Hmax is the maximum pump head based on the specifications of the pump.
where [11] :
ηp : pump efficiency (%)
ρ : density of water (998.3 kg/m3 at 20°C) g : Acceleration due to gravity (9.81 m/s2)
Q : Pump capacity (m3/s) H : Head total pump (m) Pp : pump power (watts)
METHODOLOGY
panel pressure pump, flowmeter and display the electrical panel. Record the measurement on the flowmeter, pressure, current and voltage and frequency inverters on the experiment table. Repeat variations pump inverter frequency setting to three times the experiment.
Once all the necessary data obtained by the count of parameters such as the cross-sectional area termohidrolika slit plate fuel channels, flow rate and pressure differences in the system ExNal. Hereafter devised flow rate curve to the pressure differences on ExNal to understand its characteristics.
RESULTS AND DISCUSSION
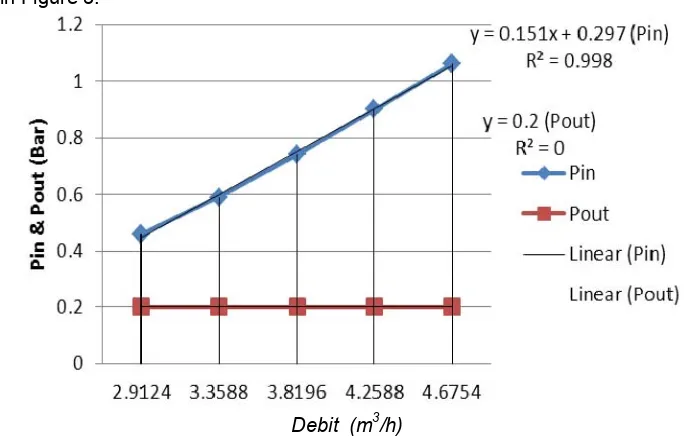
From the data in the form of flow rate at the Excel obtained from experimental results derived from the increasing pressure continuously controlled through an inverter pump is shown in Figure 3.
Debit (m3/h)
Figure 3. The curve relationship between the pressure on water discharge.
Based on Figure 3 shows the increase of flow rate of fluid influenced pressure increase continuously. The inlet pressure (Pin) mounted before the flowmeter and test section shows an increase in proportion to the increase in flow rate. Pout measures the pressure after the test section and gets hydrostatic pressure from the reservoir tank of 0.2 bar. Because the top reservoir tank is open to the atmosphere, the flow rate increase can not raise the pressure so that Pout remains 0.2 bar. Furthermore, the magnitude of this pressure loss will be calculated to determine the total loss that occurs in the loop.
Calculating Pressure Losses
The change in pressure in the fluid flow occurs because of the differences in altitude, the speed difference fluid flow due to changes or differences in cross-section, and fluid friction.
Major Pressure losses
Major pressure losses is the pressure loss due to friction in the straight tube flow system. To calculate the pressure loss of major use equation (1) with the following data :
L = 1100 mm = 1.1 m Dpipa = 3.81mm = 3.81 x 10⁻³ m
= 994.7 kg/m v = 3.798 m/s
= 31730.40 N/m² = 0.31 bar
Minor Pressure Losses
In addition to pressure losses due to friction in the system flow tube / pipe straight, there is also the pressure loss due to the curves, widening and narrowing of the cross section, joints, valves, and other accessories.
is a loss coefficient on fittings and valves, which are highly dependent on the shape of the component fittings and valves, but not overly influenced by the value of Reynolds number for this type of flow with a large Reynolds number. The value of shown in Table 1
Based on the above table total losses obtained as follows:
Elbow 90° = 0.75
To calculate the pressure loss minor use equation (4) with the following data: = 994.7 Kg/m
Total pressure losses is the sum of the pressure loss that occurs due to forced convection (forced convection) produced by a circulation pump that causes fluid friction against the walls of the tube.
To calculate the total pressure loss is used equation (5) with the following data:
∆P mayor = 0.31 Bar
∆P minor = 0.33 Bar
So that ∆P total = ∆P mayor + ∆P minor = 0.64 Bar
Calculating Head Pumps
Head pump is the energy of unity weight that should be provided to drain a liquid that is planned in accordance with the pump installation conditions, or pressure to circulate a liquid, which is generally expressed in units of length can be calculated using equation as follows:
H = ha + Δhp + hl +
1. Head Static (Ha) the distance between the surface of the water tank on the bottom of the tank water pernukaan is 1.5 m.
2. Differences Head pressure on both surface water (Δhp) :
Because of P1 and P2 is an open tank, then P1 and P2 = 0, so that: ΔHp = = 0 m
Head Losses (Hl)
Head frictional losses in the pipeline (hf)
hf = λ
To search for λ we use the formula darcy for turbulent flow, the formula is:
λ = 0.020 + = 0.0325
Then the frictional losses in the pipeline : L = 1100 mm = 1.1 m
v = 3.798 m/s
Dpipe = 3.81mm = 3.81 x 10 -3
m g = 9.81 m/s²
So that hf = λ = 0.69 m
3. Losses head accessories By using the formula:: Ktotal = 4.74
v = 3.798 m/s g = 9.81 m/s²
So that he= Ktot = 3.48 m
After all sections Hl= hf + he = 0.69 + 3.48= 4.17 m
So large Head Total Pump (H) is :
H = 1.5 + 0 + 4.17 + = 6.40 m, So the total pump head is 6.40 m
Calculating Efficiency Pumps
Pump efficiency is the ratio between the power the hydraulic pump with the pump shaft power can be calculated by equation (6) as follows :
PH is a hydraulic power pumps that can be calculated with the following data (equation 7): = 994.7Kg/m
g = 9.81 m/s² H = 6.40 m Q = 4.6764 m /h
So that = = 81.124Watt
Ps is pump shaft power can be calculated by the following data (Equation 8): = 994.7Kg/m g = 9.81 m/s²
H = 9.99 m Q = 4.6764 m /h So that Ps = .Q = 126.629Watt
So the efficiency of the pump is = (81.124/126.629) = 0.64 ≈ 64%
From the data of these calculations will be done for the consideration of modifications to the pump capacity so that it can achieve critical velocity is expected.
CONCLUSION
ACKNOWLEDGEMENT
The authors appreciate greatly to Center for the Nuclear Reactor Safety and Technology of BATAN for the financial support of this research from the 2016 DIPA research budget that makes this research possible.
REFERENCES
1. Subekti, M. et al., Technical Report of Proposed Research 2013: Experimental Device Function Test Critical Cooling Speed In Fuel Innovative Reactor Element Channel, PTRKN-BATAN, Tangerang Selatan, January (2014).
2. MILLER D. R., "Critical Flow Velocities for Collapse of Reactors of Parallel-Plate Fuel Assemblies", Journal of Engineering for Power, Vol. 82, p.83-95, (1960).
3. ENDIAH P.H. Dkk, "Technical Document of PTRKN: User Criteria Document (UCD) Innovative Research Reactor", BATAN-RKN-C2010-01-001, PTRKN-BATAN, Tangerang Selatan, (2010).
4. KAMINAGA M., "Thermal hydraulics Design of JRR-3M", The 38th, 39th and 40th Instructor Training Program - Course of Reactor Engineering I, II & III, JAEA, Tokai, (2010).
5. Kiswanta, Subekti M., Sumijanto, Characterization of Cooling Reactor Flow Rate Using Channel Experimental Facility, Proceedings of National Seminar on Nuclear Energy Technology 2014, PTKRN-PKSEN, Pontianak, June 19, (2014).
6. Kiswanta, KussigitSantoso, Sumijanto, Characterization of Different National Pressure Cooling Flow Debris At Channel Experiment Facility, National Seminar X Nuclear Technology 2014, PTKRN-ISSN, Yogyakarta, September 10, (2014).
7. Kiswanta, Design of Coolant Pump Modification On Channel Experiment Facility, Sigma Epsilon Volume 18, Number 2, May (2014).
8. King, RP.,Introduction to Practical Fluid Flow, Butterworth-Heinemann, Burlington, GBR, (2002).
9. Kiswanta, EdySumarno, JokoPrasetio W., AinurRosidi, Fig. Heru K., Commissioning of Integration of BETA Test Structure (UUB) with HeaTiNG - 02 Testing, Proceedings of 19th National Seminar on Technology and Safety of Nuclear Power Plant and Nuclear Facilities, Yogyakarta, 24-25 September (2013).
10. Sularso, TaharaHaruo, Pump and Compresor, (seventh edition), PT PradnyaParamita, Jakarta, (2000).
![Figure 2. The Channel Experiment Facilities (ExNal) [1]](https://thumb-ap.123doks.com/thumbv2/123dok/4032971.1976391/2.595.87.494.324.757/figure-channel-experiment-facilities-exnal.webp)