Full Terms & Conditions of access and use can be found at
http://www.tandfonline.com/action/journalInformation?journalCode=cbie20
Bulletin of Indonesian Economic Studies
ISSN: 0007-4918 (Print) 1472-7234 (Online) Journal homepage: http://www.tandfonline.com/loi/cbie20
Poverty and Inequality in The Soeharto Era: An
Assessment
Anne Booth
To cite this article:
Anne Booth (2000) Poverty and Inequality in The Soeharto
Era: An Assessment, Bulletin of Indonesian Economic Studies, 36:1, 73-104, DOI:
10.1080/00074910012331337793
To link to this article:
http://dx.doi.org/10.1080/00074910012331337793
Published online: 21 Aug 2006.
Submit your article to this journal
Article views: 310
View related articles
POVERTY AND INEQUALITY IN THE
SOEHARTO ERA: AN ASSESSMENT
Anne Booth*
School of Oriental and African Studies, London
This paper surveys the evidence on trends in poverty and inequality during the years of Soeharto’s presidency. That Indonesia saw a decline in the incidence of poverty, and improvements in other welfare indicators such as infant mortality rates and literacy rates over these years, seems indisputable. Comparative studies show that by the latter part of the 1980s, the headcount measure of poverty in Indonesia was below that in the Philippines although above that in Malaysia and Thailand. But relative poverty has declined more slowly, and indeed increased in some urban areas between 1987 and 1996. The paper also examines evidence on the determinants of rural poverty in Indonesia in 1993, and suggests that rural development programs targeted to the specific needs of poor people in poor areas will be essential if rural poverty is to be further reduced in future years.
article; my more limited aim here is to review some of the evidence relating to poverty and income distribution, and to discuss the policy implications of this evidence.
THE SITUATION IN THE 1960s
How poor were Indonesians in March 1966, when the New Order effectively began? The available evidence indicates that they were very poor indeed. Per capita income in Indonesia was well below that of other Southeast Asian economies for which reliable data are available; indeed real per capita GDP is estimated to have been only 535 international dollars (1985 prices) in 1966, compared with 650 dollars in India.1 The
time series compiled by van der Eng (1992: table A-4) shows that real per capita GDP (in 1983 rupiah) was about the same in 1965–67 as in 1911–13. The household survey data collected between November 1964 and February 1965 indicated that in much of Java over half the rural population fell below a very modest poverty line set in terms of the price of cereals (20 kg per capita per month). The situation was little better in urban areas. Outside Java the incidence of poverty was on average lower, although in Bali, Northern Sulawesi and West Nusa Tenggara it was little different from that in Java (Booth 1988: table 4.19). Only in some parts of Sumatra and Kalimantan was the headcount measure markedly lower than in Java.
actually lower in urban than in rural areas (Sundrum 1973: tables 5 and 7). These trends were reversed only slowly as inflation fell and economic growth accelerated.
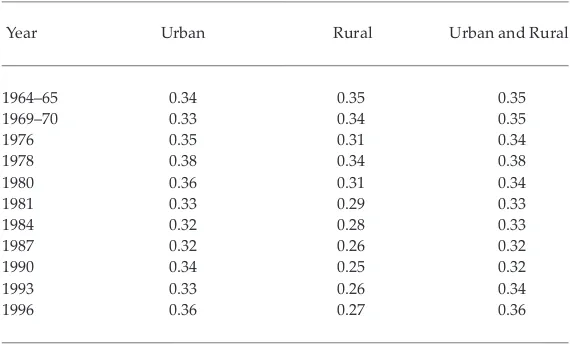
By 1969–70, the Gini coefficient of per capita consumption expenditures in rural Indonesia was 0.34, indicating a moderate degree of inequality. It was slightly lower in urban areas (table 1). International comparisons are difficult, as data for other parts of the developing world often refer to household income rather than expenditure.2 But there is
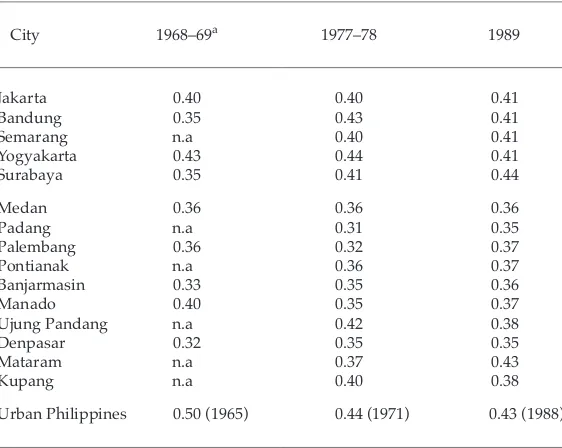
little reason to think that inequalities in rural Indonesia were much lower than those in the rest of Asia, although they were probably lower than in Latin America or Africa. In urban areas, the cost of living surveys carried out in 1968–69 indicated that the Gini coefficient of household income was close to, or rather greater than, 0.4 in Jakarta, Manado and Yogyakarta, although it was lower in Bandung and Surabaya, and in most of the large towns outside Java (table 2). Bearing in mind that the Gini coefficient of urban household incomes in the Philippines in 1971 was 0.44, and that that country is widely considered to have an unequal distribution of
TABLE 1 Trends in the Gini Coefficient of Household per Capita Consumption Expenditure
Year Urban Rural Urban and Rural
1964–65 0.34 0.35 0.35
1969–70 0.33 0.34 0.35
1976 0.35 0.31 0.34
1978 0.38 0.34 0.38
1980 0.36 0.31 0.34
1981 0.33 0.29 0.33
1984 0.32 0.28 0.33
1987 0.32 0.26 0.32
1990 0.34 0.25 0.32
1993 0.33 0.26 0.34
1996 0.36 0.27 0.36
income at least by Asian standards, it would appear that urban income disparities in Indonesia’s larger towns and cities in the latter part of the 1960s were already quite marked.
Although the growth in per capita consumption expenditure that occurred after 1968, combined with a slight fall in rural expenditure inequalities, would have led to some decline in poverty in both urban and rural Indonesia between 1964–65 and 1969–70, there was still widespread concern about the problem of poverty, especially in rural Java. Using the poverty lines proposed by Professor Sajogyo, Sundrum and Booth (1980: table 7) estimated that 61% of the rural population in Java was poor in 1970, and 21% destitute.3In urban Java the percentage
considered destitute was 26%, while outside Java it was 21% in urban
TABLE 2 Urban Inequalities in Indonesia: Gini Coefficient of Household Income
City 1968–69a 1977–78 1989
Jakarta 0.40 0.40 0.41
Bandung 0.35 0.43 0.41
Semarang n.a 0.40 0.41
Yogyakarta 0.43 0.44 0.41
Surabaya 0.35 0.41 0.44
Medan 0.36 0.36 0.36
Padang n.a 0.31 0.35
Palembang 0.36 0.32 0.37
Pontianak n.a 0.36 0.37
Banjarmasin 0.33 0.35 0.36
Manado 0.40 0.35 0.37
Ujung Pandang n.a 0.42 0.38
Denpasar 0.32 0.35 0.35
Mataram n.a 0.37 0.43
Kupang n.a 0.40 0.38
Urban Philippines 0.50 (1965) 0.44 (1971) 0.43 (1988)
aData for Banjarmasin and Manado refer to 1970–71.
areas and 15% in rural areas. While the Sajogyo poverty line was criticised by some analysts, there could be little doubt that the incidence of poverty was very high in many parts of Indonesia in 1970, whatever the poverty line concept used (Esmara 1986: table 9.7). Ravallion and Datt (1996a: 2,480) point out that in 1970, using a comparable poverty line, India’s headcount measure of poverty was very close to that of Indonesia. So there can be little doubt that, in spite of the economic recovery that occurred in the latter part of the 1960s, the great majority of Indonesians were still poor by Asian standards when the first of the Soeharto era five-year plans got under way at the end of that decade.
GROWTH AND EQUITY DURING THE 1970s
The 1970s were, of course, the years when the rapid increase in the world price of oil had important consequences for both economic growth and income distribution in Indonesia. By the mid 1970s there was considerable debate about the distributional consequences of the oil boom, especially in rural areas of the country. It was argued that while the oil boom had led to rapid growth in government expenditure, the benefits of this growth were uneven by sector and region, with urban areas benefiting to a disproportionate extent. In addition, several analysts were pointing to the adverse consequences of the real appreciation of the rupiah (popularly known as the ‘Dutch disease’) for the incomes of producers of non-oil export commodities, especially in the agricultural sector (see, for example, Paauw 1978, for an early statement of this argument). While the rice sector was protected via import controls and producer subsidies, it was argued that the oil boom was harming many millions of smallholder producers of rubber, coffee, tea, pepper and copra. Even before the full effects of the oil boom were felt, the very sharp increase in the price of rice that occurred in 1972–73 was thought to have adversely affected the poorer segments of the population, in whose consumption basket rice and other basic foods had a higher weight. In short, there appeared to be plenty of evidence to support the view that the oil boom was making the rich (especially in urban areas) richer, while the poor might actually have become worse off.
average declined between 1969–70 and 1976 (Booth 1992: table 10.2). Thus the percentage of the population and the numbers falling below the official poverty line actually increased in rural areas between 1970 and 1976 for the country as a whole (table 3).
Inequalities, too, increased between 1969–70 and 1976, in both urban and rural areas. As Asra (1989: table 1) has demonstrated, if the 1976 rural expenditure data are corrected for differential changes in prices by decile groups, then rural expenditure inequalities increased in both Java and the Outer Islands, rather than declining as shown in the unadjusted data (table 1). In urban Java inequalities in expenditure also increased; Booth and Sundrum (1981: table 7.22) estimate that expenditure in the top decile group in urban Java grew by 66% between 1970 and 1976, compared with an increase of less than 20% in the bottom decile groups. On average, real per capita expenditure increased more rapidly in Jakarta
TABLE 3 Headcount Measure of Poverty According to the Central Bureau of Statistics Poverty Line, 1970–96
Year Percentage below Numbers in Poverty
the Poverty Line (millions)
Urban Rural Urban Rural Total
1970a (53.6) (38.7)
1976 38.8 40.4 10.0 44.2 54.2
1978 30.8 33.4 8.3 38.9 47.2
1980 29.0 28.4 9.5 32.8 42.3
1981 28.1 26.5 9.3 31.3 40.6
1984 23.1 21.2 9.3 25.7 35.0
1987 20.1 16.4 9.7 20.3 30.0
1990 16.8 14.3 9.4 17.8 27.2
1993 13.5 13.8 8.7 17.2 25.9
1996 9.7 12.3 7.2 15.3 22.5
aThe 1970 estimates are derived from a poverty line based on the 1976 BPS
pov-erty lines, deflated using the price indices for the bottom 40% of the expenditure distribution, as estimated by Asra (1989): table 3.
than in other urban areas, and more rapidly in urban Java than in urban areas of the Outer Islands (Booth and Sundrum 1981: table 7.20). A consequence of these trends was a sharp increase in urban–rural disparities, especially on Java and especially for non-food items.
Some of these trends were reversed in the years from 1976 to 1981. Asra’s calculations suggest that between 1976 and 1981 the rate of inflation was broadly similar for all decile groups in the expenditure distribution, both in Java and elsewhere (Asra 1989: table 2). In rural areas there was a discernible fall in expenditure inequality. In rural Java on average, real per capita expenditure increased rapidly, although it fell in rural areas outside Java (Booth 1992: table 10.2). The upshot of these trends was a marked decline in the incidence of poverty in both urban and rural areas, although because of faster population growth in urban areas, the numbers under the official poverty line fell more sharply in rural areas (table 3). By 1981 it was estimated that there were 40.6 million Indonesians under the official poverty line, of whom 9.3 million were in urban areas.
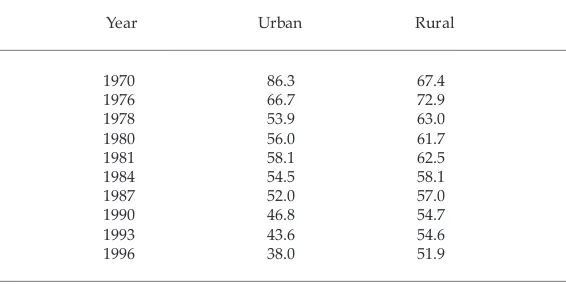
Over the 1970s, average per capita consumption expenditure had increased more rapidly than the official poverty line used by BPS (the Central Bureau of Statistics, since renamed the Central Statistics Agency). Whereas in 1970 the urban poverty line was over 86% of average per capita expenditure, by 1980 it had fallen to only 56% (table 4). The fall in
TABLE 4 BPS Poverty Line as a Percentage of Average per Capita Consumption Expenditure, 1970–96
Year Urban Rural
1970 86.3 67.4
1976 66.7 72.9
1978 53.9 63.0
1980 56.0 61.7
1981 58.1 62.5
1984 54.5 58.1
1987 52.0 57.0
1990 46.8 54.7
1993 43.6 54.6
1996 38.0 51.9
rural areas relative to average per capita expenditure was less rapid but still appreciable.4 Given these trends it is of some interest to look at trends
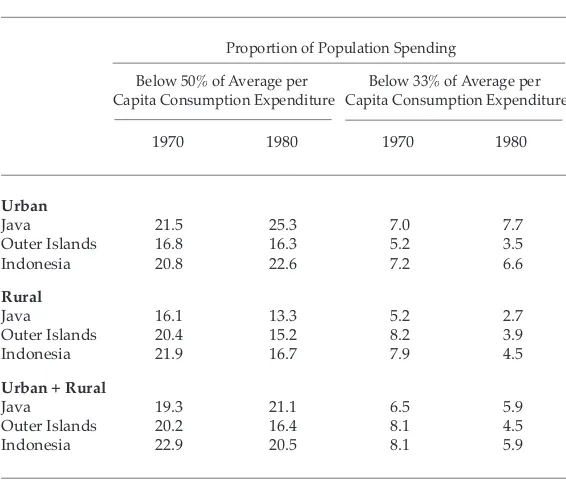
in relative poverty during the 1970s, where relative poverty is defined in terms of the proportion of the population spending less than one half, or less than one third, of average per capita consumption expenditure.5 In
urban Java, relative poverty defined in both these ways actually increased between 1970 and 1980, although in urban areas of the Outer Islands and in rural areas it fell (table 5).
Certainly the decline in the incidence of both absolute and relative poverty in rural areas of Indonesia over the 1970s was a remarkable achievement, especially in comparison with other petroleum economies with substantial agricultural sectors. To what extent was it due to government policy? It is certainly true that the oil boom did see an increase
TABLE 5 Estimates of Relative Poverty, 1970 and 1980
Proportion of Population Spending
Below 50% of Average per Below 33% of Average per Capita Consumption Expenditure Capita Consumption Expenditure
1970 1980 1970 1980
Urban
Java 21.5 25.3 7.0 7.7
Outer Islands 16.8 16.3 5.2 3.5
Indonesia 20.8 22.6 7.2 6.6
Rural
Java 16.1 13.3 5.2 2.7
Outer Islands 20.4 15.2 8.2 3.9
Indonesia 21.9 16.7 7.9 4.5
Urban + Rural
Java 19.3 21.1 6.5 5.9
Outer Islands 20.2 16.4 8.1 4.5
Indonesia 22.9 20.5 8.1 5.9
in government expenditure, although little of this increase was explicitly targeted to the poor. Even the regional development grants, or Inpres grants as they came to be known, were not specifically designed to alleviate poverty, but rather to give provincial and subprovincial levels of government more scope to carry out much needed infrastructure rehabilitation and development.6 After the mid 1970s, the employment
generated by the ‘Inpres kabupaten’ fell continuously (Asher and Booth 1992: table 2.12). The sharp fall in poverty over the latter part of the 1970s was due in part to the successful stabilisation of food prices which, especially in Java, meant that the poor experienced a lower rate of inflation than the rich (Asra 1989: table 3). In addition, the growth in agricultural production that occurred in the 1970s and early 1980s, in considerable part due to the successful dissemination of new production technologies in the foodcrop sector, created new employment opportunities in production, processing and marketing. Indonesian agriculture remained very unmechanised and labour intensive compared with agriculture in most other parts of Asia well into the 1980s, because the small average size of holdings made purchase of agricultural machinery uneconomic for most farmers. In addition, the devaluations of 1978 and 1983 raised the price of farm machinery and discouraged its adoption (Booth 1988: 181).
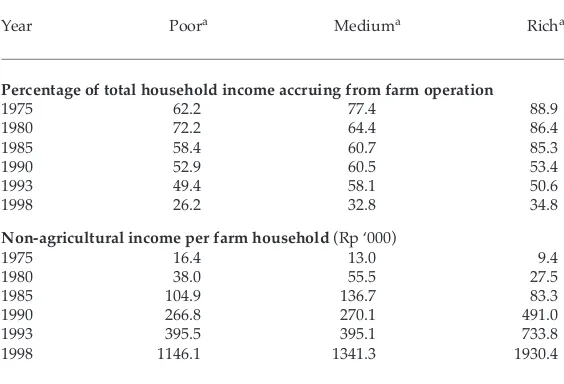
The SAM tables also indicated that, over the decade 1975–85, per capita incomes of farm labourer households (the poorest of the socio-economic groups in the 1975 SAM) grew slightly faster than the national average (table 7), while those of poor farmers (those operating less than 0.5 hectares) grew more slowly, so that by 1985 farm labourer households were earning slightly more on average than poor farm households. But middle and especially larger farmers had increased their incomes even faster over these years, relative both to the national average and to incomes of farm labourers. The income data collected in the 1976 Labour Force Survey (Sakernas) indicated that, in both Java and the rest of the country in 1976, the Gini coefficient of household income distribution was in fact higher in rural than in urban areas, and higher for agricultural households than for any other category of household (Sigit 1985: tables 2 and 3). Clearly we cannot assume that the distribution of incomes within
TABLE 6 Sources of Income for Agricultural Households, 1975–98
Year Poora Mediuma Richa
Percentage of total household income accruing from farm operation
1975 62.2 77.4 88.9
1980 72.2 64.4 86.4
1985 58.4 60.7 85.3
1990 52.9 60.5 53.4
1993 49.4 58.1 50.6
1998 26.2 32.8 34.8
Non-agricultural income per farm household (Rp ‘000)
1975 16.4 13.0 9.4
1980 38.0 55.5 27.5
1985 104.9 136.7 83.3
1990 266.8 270.1 491.0
1993 395.5 395.1 733.8
1998 1146.1 1341.3 1930.4
aPoor farm households are those cultivating less than 0.5 hectares, medium, 0.5 to
one hectare, and rich, over one hectare.
the agricultural sector was especially egalitarian at the time the green revolution was gathering pace in Indonesia in the mid 1970s. Neither can we assume that agricultural household incomes became more equally distributed as a result of the dissemination of the new agricultural technologies, even if the years from 1976 to 1987 were characterised by some decline in inequality in the distribution of per capita consumption expenditures in rural areas (table 1).7
STRUCTURAL ADJUSTMENT POLICIES
AND POVERTY DECLINE, 1981–87
One of the most striking aspects of the decline in poverty in Indonesia since the mid 1970s, as depicted in the official statistics, is that it continued more or less regardless of changing macroeconomic policies. Between 1976 and 1981, the years of the oil boom, the annual average decline in the numbers below the BPS poverty line was 5.6%. After 1981, Indonesia’s revenues from oil exports began to fall, and the government adopted a series of measures designed to increase non-oil exports, diversify the domestic tax base, attract more foreign investment, deregulate the financial sector, and improve the efficiency of public sector enterprises,
TABLE 7 Agricultural Household Incomes as a Percentage of the National Average, 1975–98
Year Labourer Poora Mediuma Richa
1975 52.1 56.2 75.0 110.2
1980 50.8 66.5 76.9 98.8
1985 57.8 55.3 82.7 133.9
1990 49.3 65.1 78.6 122.9
1993 37.9 61.3 73.0 119.1
1995 29.1 45.9 58.9 86.5
1998 28.8 47.4 61.0 90.6
aSee table 6 for definitions of ‘poor’, ‘medium’ and ‘rich’.
measures which have been much discussed (e.g. Pangestu 1991; Azis 1994). Over the years from 1981 to 1987, GDP growth was lower than in the oil boom years, and government expenditures were cut back. But in spite of fiscal austerity and slower GDP growth, the annual percentage decline in the numbers under the official poverty line was only slightly slower than in the oil boom years. In addition, the incidence of relative poverty declined, in both urban and rural areas (table 8).
The Indonesian experience of 1981–87 has attracted considerable attention as one of the few examples of a sustained program of macroeconomic policy reform, along the lines advocated by the World Bank and the IMF, that has not had an adverse effect on poverty (Stewart 1995: 206–8; Thorbecke et al. 1992).8 Thorbecke et al. (1992: 135–6)
developed a structural adjustment model for Indonesia that simulated
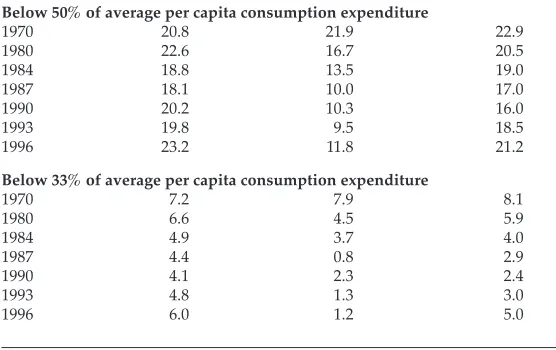
TABLE 8 Estimates of Relative Poverty, 1970–96
Year Urban Rural Urban + Rural
Percentage of the population spending:
Below 50% of average per capita consumption expenditure
1970 20.8 21.9 22.9
1980 22.6 16.7 20.5
1984 18.8 13.5 19.0
1987 18.1 10.0 17.0
1990 20.2 10.3 16.0
1993 19.8 9.5 18.5
1996 23.2 11.8 21.2
Below 33% of average per capita consumption expenditure
1970 7.2 7.9 8.1
1980 6.6 4.5 5.9
1984 4.9 3.7 4.0
1987 4.4 0.8 2.9
1990 4.1 2.3 2.4
1993 4.8 1.3 3.0
1996 6.0 1.2 5.0
the impact of several different retrenchment policies in the 1983–87 period. They found that the policy package actually adopted came quite close to the most favourable simulation in terms of the impact on poverty. They argued that a more drastic budget retrenchment ‘would have resulted in overkill. Economic stagnation and a worsening income distribution would have been a very high price to pay for maintaining the level of public debt prevailing at the outset of the crisis’.
The budget cuts implemented after 1981 were most severe in the more capital-intensive sectors such as energy, transmigration and grants to public enterprises, which did not have much direct impact on employment (Asher and Booth 1992: table 2.7). Government expenditure as a share of GDP (estimated in international dollars; see note 1) fell from 16.1% in 1982 to 14.5% in 1984, and remained at around this level for the rest of the 1980s.9 Indonesia in fact managed to maintain a reasonably
expansionary fiscal stance between 1982 and 1988 while at the same time keeping inflation in check in the wake of two substantial devaluations, thus engineering a substantial real devaluation over these years (Intal 1992: 113). One reason was that domestic monetary growth was held down, although not at the expense of the credit needs of the export sector. In addition, the government relied on foreign borrowing to balance the budget, which reduced the necessity for borrowing from the domestic monetary authorities with potentially inflationary consequences.
Well judged macroeconomic policy thus created an environment in which producers could take advantage of the opportunities created by the large real devaluation to expand traded goods production. At the same time, improved infrastructure and flexible labour markets made it easy for people to move to take advantage of new employment opportunities, or indeed to diversify their sources of income while staying in rural areas. In their analysis of the Susenas for 1984 and 1987, Huppi and Ravallion (1991: 1,672–3) stressed the importance of increasing wage incomes for poor self-employed farmers in Central and East Java. These two provinces accounted for over half the total income gains made by the rural farming poor in the country as a whole over these three years. Outside Java, where wage earning opportunities were less abundant, there was less income diversification, and ‘wage earnings were of little importance in poverty alleviation’ (Huppi and Ravallion 1991: 1,673).
THE RETURN TO RAPID GROWTH, 1987–96
terms of trade declined thus paid off. Non-oil export industries grew rapidly, in response to both the real depreciation of the rupiah and the other reforms aimed at improving incentives for exporters, including the introduction of a duty drawback scheme. The government was also able to push through major tax reforms and, in 1988, a substantial deregulation of the financial system (Nasution 1993; Cole and Slade 1996: 109–15). But although these reforms ushered in a period of faster GDP growth after 1987, which was sustained right up until 1997, the years from 1987 to 1996 witnessed a slower decline in the numbers under the BPS poverty line. This was especially true in rural areas: whereas from 1976 to 1987 the number of people below the official poverty line in rural areas declined at almost 7% per annum, between 1987 and 1996 the annual rate of decline slowed to just over 3% per annum. Drawing attention to this slowdown in a speech in 1994, President Soeharto suggested that increasingly the poor were isolated in ‘pockets of poverty’ which government development programs were not reaching. By the mid 1990s it was
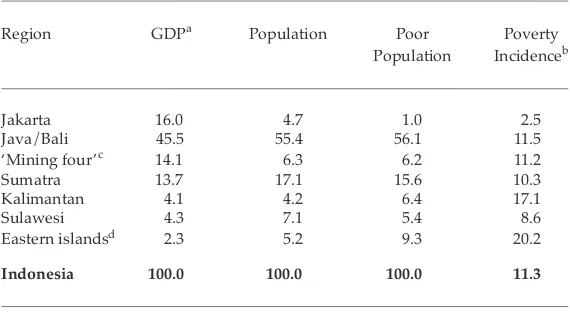
TABLE 9 Regional Breakdown of GDP, Population and Poverty Incidence, 1996 (%)
Region GDPa Population Poor Poverty
Population Incidenceb
Jakarta 16.0 4.7 1.0 2.5
Java/Bali 45.5 55.4 56.1 11.5
‘Mining four’c 14.1 6.3 6.2 11.2
Sumatra 13.7 17.1 15.6 10.3
Kalimantan 4.1 4.2 6.4 17.1
Sulawesi 4.3 7.1 5.4 8.6
Eastern islandsd 2.3 5.2 9.3 20.2
Indonesia 100.0 100.0 100.0 11.3
aGDP data are provisional.
b’Poverty incidence’ refers to the percentage of the population under the BPS
poverty line in 1996.
cProvinces of Aceh, Riau, East Kalimantan and Irian Jaya.
dProvinces of West and East Nusa Tenggara, East Timor and Maluku.
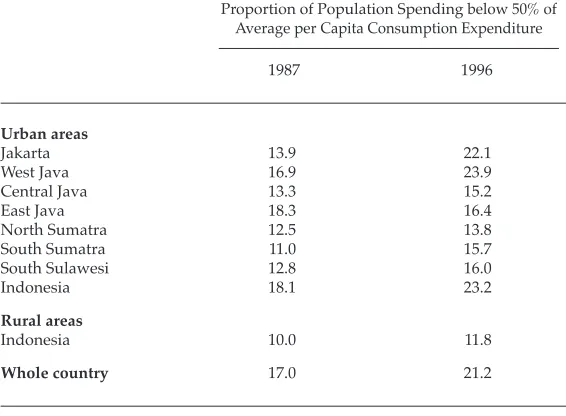
obvious that these pockets of poverty were located in many parts of the archipelago and not just in Java: in 1996 the incidence of poverty was higher in Kalimantan and Eastern Indonesia than in Java and Bali (table 9). The unadjusted household survey data show a rise in inequalities in urban per capita consumption expenditure between 1990 and 1996 (table 1). The household income data collected in the urban cost of living surveys (not yet available for the 1990s) show more or less constant inequality in Jakarta from the late 1960s until the late 1980s, but an increase in the Gini coefficient in Bandung and Surabaya (table 2). Although the proportion of the population under the official poverty line continued to fall in both urban and rural areas, there was an increase in the incidence of relative poverty (defined as the proportion of the population spending less than half the monthly average) in most parts of the country. It was especially pronounced in Jakarta, and in urban areas of West Java (table 10). The rapid population growth of greater Jakarta, and of other large cities in Java, due mainly to a huge influx of migrants, has obviously
TABLE 10 Estimates of Relative Poverty, 1987 and 1996
Proportion of Population Spending below 50% of Average per Capita Consumption Expenditure
1987 1996
Urban areas
Jakarta 13.9 22.1
West Java 16.9 23.9
Central Java 13.3 15.2
East Java 18.3 16.4
North Sumatra 12.5 13.8
South Sumatra 11.0 15.7
South Sulawesi 12.8 16.0
Indonesia 18.1 23.2
Rural areas
Indonesia 10.0 11.8
Whole country 17.0 21.2
led to sharper disparities in consumption expenditure and living standards.
In their study of trends in household expenditure inequalities in Indonesia between 1987 and 1993, Akita, Lukman and Yamada (1999: table III) demonstrate that both Theil and Gini indices increased in urban areas over these years, although most of the increase occurred between 1987 and 1990. There was a slight decline in rural inequalities. These authors decomposed the Theil indices by region and by educational achievement. They found, perhaps surprisingly, that interprovincial inequalities are not a major factor in overall national inequalities, confirming earlier results which showed that interprovincial disparities in household expenditures are far smaller than interprovincial disparities in GDP (Akita and Lukman 1995). They argued that rural–urban inequalities accounted for a much larger share of overall inequalities and thus that policies aimed at reducing them should be given high priority. They also argued that educational attainment was a significant determinant of expenditure inequality, accounting for around 33% of total inequalities by 1993. This finding was confirmed by Cameron (1999: 26), who concluded from her analysis of the household expenditure data for 1984 and 1990 that ‘increased educational attainment was the largest single determinant of the inequality increase’ over these years. The policy implications of these findings are examined in the next section.
Between 1993 and 1996, the Gini coefficient of per capita expenditure in urban Indonesia increased from 0.33 to 0.36; in rural Indonesia it increased only slightly, and remained much lower than that for urban areas (table 1). The increase in relative poverty in rural areas was also much more modest; by 1996 the proportion of the rural population spending less than half of average expenditure was about half that in urban areas (table 10). Some students of rural change in Indonesia find the evidence of quite low expenditure inequalities hard to accept. It must be stressed again that these data refer to expenditure only, not to income or wealth, and attention has already been drawn to the evidence that income inequalities in rural areas of Indonesia in the mid 1970s were much higher than inequalities in per capita consumption expenditure (Sigit 1985).10 There is also evidence that since the mid 1980s the
mechanisms promoting an egalitarian distribution of income in rural areas may have been working less effectively than in the decade 1975–85.
was much larger (table 6). Indeed household incomes for all types of farm households were lower relative to the national average in 1993 than they were in 1990, but only for farm labouring households were they much lower than in 1975 (table 7). To the extent that off-farm employment was having an equalising effect on rural incomes in the late 1970s and early 1980s, this was apparently no longer the case by the early 1990s. The 1990s also saw a steep decline in all agricultural incomes relative to the national average, but the decline was sharpest for agricultural labourer households (table 7). By 1998, per capita disposable incomes in farms operating more than one hectare of land were over three times those of farm labourer households, compared with less than twice in 1980 (BPS 1999: table 3.14). But the SAM data also show that disparities widened between rural and urban areas and especially between the rural poor and the urban well-to-do. In 1985 the ‘upper stratum’ of urban households had an average disposable income per capita of less than four times that of agricultural labour households; by 1998 it was 9.5 times the level of agricultural labour households.11
THE CHANGING TRADE-OFF BETWEEN
GROWTH AND EQUITY IN INDONESIA
The lesson of the years from 1987 to 1996 would seem to be that the elasticity of poverty decline with respect to economic growth fell in Indonesia. In other words, the rapid growth of these years was accompanied by increasing inequality, especially in urban areas, and this increase in inequality reduced the impact of the growth on poverty decline.12 Much more analysis of the available data is needed before we
can arrive at convincing explanations for this, but several hypotheses suggest themselves.
less pro-poor in Indonesia since 1987 could be that it has relied less on agriculture and more on industry.
• Another reason put forward in some official documents, and espoused by former President Soeharto, is that increasingly since the mid 1980s, the poor in Indonesia have been located in remote regions outside Java, and unable to benefit from Java’s rapid manufacturing-based growth. To the extent that these regions are characterised by poor soils, erratic rainfall and poor market access, they have not benefited much from agricultural modernisation either. According to this explanation, there is nothing inherently anti-poor about manufacturing-led growth, but if people are caught in isolated poverty traps which are not connected to the more dynamic parts of the economy, and from which they cannot escape, then they cannot benefit from such growth.
• A third reason why growth has been less egalitarian in Indonesia since the latter part of the 1980s concerns access to education, and especially what may be termed ‘international quality higher education’. People with degrees from the most prestigious domestic universities or from overseas, especially in disciplines such as medicine, accountancy and engineering, have been able to command considerable ‘rents’ in the booming private sector, and their incomes have increased relative to those in other parts of the urban labour force. In spite of the rapid growth in educational enrolments at all levels in Indonesia since the 1970s, access to international quality higher education, or even good quality secondary education, was still severely limited in the late 1980s and early 1990s, and these rents were not dissipated through increased supply. This explains the findings of several analysts that educational disparities contributed significantly to overall expenditure inequalities in these years.
produced in sectors enjoying high levels of protection and quite capital-intensive production technologies. Thus although there was a significant increase in the manufacturing labour force over these years, and indeed over the entire period from 1971 to 1995, the rate of growth was not as fast as in Taiwan or South Korea (Manning 1998: 93–4).13
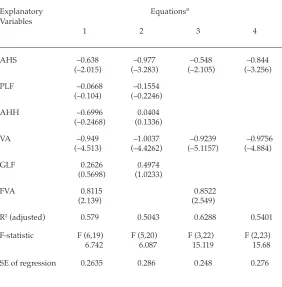
The second explanation, based on the notion of ‘pockets of poverty’, also has considerable empirical support. By 1996, 43% of the poor population were outside Java and Bali; over 20% were in Kalimantan, Sulawesi and the eastern islands (East and West Nusa Tenggara, East Timor and Maluku). There seems to be little doubt that relatively backward agriculture, combined with small holding sizes, was one explanation for the high incidence of rural poverty in these regions. The results of an OLS (ordinary least squares) regression analysis, shown in table 11, indicate that a large part of the interprovincial variation in rural poverty in Indonesia in 1993 can be explained by just three variables: average holding size, value added per hectare in smallholder agriculture, and the proportion of total value added in smallholder agriculture accruing from foodcrop agriculture. In those provinces where per hectare agricultural productivity is low, and this is not compensated by larger holding sizes, and where a higher proportion of agricultural value added accrues from the foodcrop sector than from treecrops, the poverty problem is likely to be worse than the national average. By contrast, in the densely settled provinces of Java/Bali, low holding sizes are more than compensated for by high per hectare productivity, so that agricultural value added per farm household is higher and, in addition, off-farm sources of income are more plentiful. Thus rural poverty levels are lower.14
TABLE 11 OLS Regression Results: Dependent Variable Rural Poverty, 1993 (headcount measure; all provinces)
Explanatory Equationsa
Variables
1 2 3 4
AHS –0.638 –0.977 –0.548 –0.844
(–2.015) (–3.283) (–2.105) (–3.256)
PLF –0.0668 –0.1554
(–0.104) (–0.2246)
AHH –0.6996 0.0404
(–0.2468) (0.1336)
VA –0.949 –1.0037 –0.9239 –0.9756
(–4.513) (–4.4262) (–5.1157) (–4.884)
GLF 0.2626 0.4974
(0.5698) (1.0233)
FVA 0.8115 0.8522
(2.139) (2.549)
R2 (adjusted) 0.579 0.5043 0.6288 0.5401
F-statistic F (6,19) F (5,20) F (3,22) F (2,23)
6.742 6.087 15.119 15.68
SE of regression 0.2635 0.286 0.248 0.276
aAll equations estimated using logs of variables; t ratios given in brackets.
AHS: average holding size.
PLF: percentage of the rural labour force employed in agriculture.
AHH: percentage of agricultural households with more than 70% of household income derived from on-farm activities.
VA: value added per hectare in smallholder agriculture. GLF: growth of the agricultural labour force, 1986–94.
FVA: percentage of total value added in smallholder agriculture from foodcrops.
agricultural development policies are more likely to accrue in the first instance to the non-poor population.15
The third hypothesis I have suggested to explain the fall in the elasticity of poverty decline with respect to GDP growth relates to access to education. Since the late 1960s, Indonesia has witnessed an enormous expansion of educational opportunities at all levels. This expansion has been driven by greatly increased provision of facilities by both the government and the private sector; in addition, parental demand for education has expanded, although this increase has not been uniform by region or by social class. As in most other Asian countries, public subsidies per student rise sharply by level of education. In the mid 1980s, the cumulative public subsidy per student in higher education was more than four times the subsidy to students in primary education (Tan and Mingat 1992: 80).16 Several analyses of household survey data have shown
that enrolments at the primary level vary little by income decile, but at the secondary and tertiary levels the disparity is very marked (Gertler and Rahman 1994: table 4.10; King 1997: 169; Oey-Gardiner 1997: 152–3). King’s analysis shows that government subsidies for primary education are quite strongly pro-poor, because primary-aged children represent twice as large a fraction of the population in the poorest deciles as in the richest, but at the secondary and tertiary levels, especially the latter, the benefits of public subsidies are skewed very heavily towards the richest decile. But public subsidies do not cover the full cost of education even at the primary level. Parental ‘top-up’ contributions have long been required by government schools, and these fees are a higher proportion of household expenditure in poor households (Gertler and Rahman 1994: 180).
least primary qualifications increased. In addition, the level of education required to gain entry to particular occupations has increased, while at the same time new jobs have become available, especially in the factory sector, which demand only relatively modest educational qualifications. Given these changes in the labour market, and the fees associated with post-primary education, which are high relative to average per capita consumption expenditure, it appears that, by the late 1980s, many parents decided there was little point in keeping children in school beyond the primary level, especially when paid employment opportunities for teenagers were increasing. Over the Repelita V period (1989–94), there was an absolute decline in numbers enrolled at both the lower and the upper secondary levels (Booth 1994: table 14).
Thus, by the 1990s differences in the level of educational attainment in the labour force, combined with the still limited access to high quality tertiary education, were an important factor contributing to expenditure inequalities. Akita, Lukman and Yamada (1999: 213–4) point out that if
TABLE 12 Monthly Employee Remuneration by Educational Level (Rp ‘000)
1976 1986 1996
No schooling 7.5a 35.4a 92.1
Not completed primary 122.4
Completed primary 12.7 51.3 145.7
Lower secondary (general) 22.4 77.7 186.7
Lower secondary (vocational) 21.4 76.4 209.3
Upper secondary (general) 31.3 99.0 256.3
Upper secondary (vocational) 24.9 93.6 263.4
Diploma I/II 105.7 333.2
Diploma III/Academy 57.6b 152.4b 419.0
University 487.5
Average 12.4 63.3 207.1
aAverage for no schooling and incomplete primary.
bAverage for academy and university.
there had been no disparities in mean expenditures by educational attainment, total expenditure inequalities would have been much lower. They argue that raising general educational levels in Indonesia should have a significant impact on inequalities over time, other things being equal. But matters may not be as simple as this. Many parents have apparently decided that the costs of keeping children in secondary education (including forgone earnings) outweigh the perceived benefits, and all the evidence suggests that, beyond the primary level, participation in education is very dependent on family income. Although the most recent evidence indicates that the continuation rate from primary to lower secondary education has increased in Indonesia over the 1990s (and has not been much affected by the crisis of 1997–98), it is still the case that many millions of children are not completing the nine-year cycle of primary and lower secondary education (Booth 1999c). An important reason for this is the not inconsiderable fees associated with secondary schooling in Indonesia relative to household incomes, and there is little reason to expect that these will fall in coming years. Thus the findings of King and others that government subsidies at the post-primary levels are skewed to the better off are unlikely to alter in the immediate future. Given the evidence on the incidence of educational expenditures, it could be argued that a better outcome for the poor would be achieved if fees were actually increased at the upper secondary and tertiary levels, and public subsidies reduced.17 The savings could then be used to achieve
the goal of universal nine-year schooling. This would entail building new schools in remote areas, and providing better incentives for teachers to work in such areas. In addition, more funds could be directed to improving existing primary and lower secondary facilities, and increasing teacher remuneration. Only when all children in the 7–15 year age groups are in school should government spending on upper secondary and tertiary facilities be increased, preferably through the provision of means-tested assisted places.
of expanding school facilities in the 1990s did enrolments at the secondary level increase. Even so, Thai industry and commerce are still faced with skill shortages at many levels which will take years to remedy.
CONCLUSIONS
That Indonesia has seen a decline in the incidence of absolute poverty, and improvements in other welfare indicators such as infant mortality rates and literacy rates, over the Soeharto years can hardly be denied. Comparative studies show that by the latter part of the 1980s the incidence of poverty in Indonesia was below that in the Philippines, although well above that in Thailand and Malaysia (Booth 1997a: 67–9; Ahuja et al. 1997: table 2.1; Mizoguchi and Yoshida 1998: table 3). But the decline in relative poverty has been much slower, and indeed relative poverty has increased in urban areas over the 1990s (table 8). One could argue that relative poverty is the more politically sensitive indicator, as people in most parts of the world tend to compare their living standards to those of their fellow citizens in a particular time and place, rather than to their own (or their parents’) living conditions 10, 20 or 30 years ago.18 That the incidence of
relative poverty increased so sharply in some of Indonesia’s largest cities between 1987 and 1996 at a time when average incomes and consumer expenditures were also increasing rapidly is at least a partial explanation for the growing social, racial and religious tensions that were becoming more obvious even before the full impact of the financial crisis hit in the latter part of 1997.
Cross-sectional regression analysis based on the 1993 poverty data published by BPS, and the results of the 1993 Agricultural Census, show that agricultural productivity per hectare and size of holding are still significant determinants of variations in rural poverty by province. The policy conclusion from these findings would seem to be that further emphasis on rural and agricultural development is essential if poverty is to be reduced in Indonesia. However, rural development programs should not be crop-focused as in the past, but must be targeted to the specific needs of poor people in poor regions. More effective rural development programs will also help in limiting the extent of urban poverty.
Government educational policy should therefore give top priority to increasing participation rates among 7–15 year olds, especially in rural areas. But unless more employment can be provided for young people in rural areas, migration to the large towns and cities will continue, aggravating problems of urban poverty and inequality, especially in Java. Rural development and employment programs must remain crucial components of a successful anti-poverty policy until well into the next century.
It is not the purpose of this paper to examine the impact of the financial crisis on living standards in Indonesia; elsewhere I have suggested that some of the very alarming projections about increases in poverty levels that were circulated in the latter part of 1998 were too pessimistic (Booth 1999a).19 The main message of this paper is that, in spite of the poverty
reduction that undoubtedly occurred in Indonesia between 1976 and 1996, problems of poverty and relative deprivation were still serious in the final years of the Soeharto regime, even before the full effect of the financial crisis and the subsequent contraction of national income were evident. The new government will thus have to give high priority to anti-poverty programs. Given that budgetary resources will be constrained at least for the next five years, it is inevitable that much of the debate on poverty policy in Indonesia will focus on more effective methods of targeting. How can the poor be identified? How can the government assist the greatest number of poor people at the lowest cost? What form of assistance is most effective in permanently raising the incomes of the poor above the poverty threshold? A considerable amount of research on these issues has been carried out, both in Indonesia and in other parts of the world, in recent years, and much can be learned from this research.20
But translating the lessons of the past into effective policies will be a formidable challenge, both for economic planners and for the political and administrative apparatus that emerges in the post-Soeharto era.
NOTES
* This paper draws on earlier work done for the ILO–SEAPAT in Manila. I am grateful to Brindha Gunasingham for statistical assistance, and to two referees for helpful comments on a previous draft of the paper.
1 The data are from the Penn World Tables (version 5.6) and are in international dollars, which means that they have been adjusted for differences in purchasing power parities across countries. They are also adjusted for changes in the terms of trade. The data are available from:
2 Sundrum (1973: table 8) found that the Gini coefficient of household expenditures in India in 1961/62 was rather lower than that estimated for rural Indonesia in 1964/65, but higher than that for rural Java in 1967. 3 The Sajogyo poverty line was set in terms of the price of rice; in rural areas the
poverty line was 320 kg of rice per person per year, and the destitution line was 180 kg per person per year. In urban areas the poverty lines were 50% higher. Critics of the Sajogyo poverty lines argued that fixing the poverty threshold in terms of only one staple commodity was bound to produce anomalies, especially when the prices of other basic needs rose less or more rapidly than that of rice.
4 See Booth (1993) for a more detailed discussion of how the official poverty line is estimated and the criticisms that have been made of it. Even allowing for differences in the cost of living, the Indonesian poverty line is very low in comparison with official poverty lines in the Philippines, Thailand and Malaysia. This means that a much higher proportion of the Indonesian population would be classified as poor if the Thai or Malaysian line were used; see Booth (1996, 1997a, 1997b) for further discussion of these points. BPS has used what is often termed the ‘food energy intake’ method of estimating the poverty line, which differs in important ways from the costing of a bundle of basic needs. See Ravallion and Bidani (1994) for a more extensive discussion of methodological problems in the Indonesian context.
5 Relative poverty lines, defined as half the mean or median household income, adjusted for household composition, have been widely used in European studies of poverty; see for example Atkinson (1995), especially chapters 4 and 14. Atkinson (1983: chapter 10) discusses the merits of relative poverty lines in detail. Ravallion (1992: 33) argues that relative poverty lines may be more relevant to developed countries, while absolute poverty lines may be more relevant in poor countries. But it is also arguable that the relative concept is useful in the context of poverty monitoring in fast-growing developing countries. For example, the Korean Development Institute has used a relative poverty line to examine trends in urban and rural poverty in South Korea between 1965 and 1980 (Leipziger, Dollar, Shorrocks and Song 1992: 7–8). See also Esmara (1986: chapter 9) for a useful discussion of different poverty line concepts and their application in Indonesia.
6 A good discussion of the origins of the kabupaten program, which was the original Inpres program, is given by Patten, Dapice and Falcon (1980). Various papers in Devas (1989) discuss the evolution of the Inpres programs over the 1980s. Ravallion (1988) argues that there was little evidence that the allocation of Inpres grants favoured poorer provinces in the mid 1980s, although this had changed by the early 1990s (Booth 1996).
7 Income data from the Labour Force Surveys after 1978 have only been published for wage and salary earners, which could indicate that BPS was not satisfied with the accuracy of the data for other categories of employed workers.
consumption expenditure increased over these years despite the cuts in government expenditure, which had a more severe impact on investment expenditure than on consumption expenditure.
9 These data are taken from the Penn World Tables (see note 1 for internet address).
10 Gini coefficients estimated from expenditure data tend to be lower than those estimated from income data, as poorer families tend to spend more than they earn (i.e. they dissave), while the opposite is true for richer families. See Rao (1984: appendix 14.1) for data on this point from the Philippines. Unfortunately the Susenas surveys do not report income data; it is in fact impossible to say anything about trends in rural income distribution in Indonesia over the Soeharto years, as there are no national data available.
11 It also needs to be stressed that during 1998 inflation was very high (almost 80% over the calendar year). As in earlier periods of high inflation, there is evidence that the effect was greater on the prices of goods and services consumed by the poor. See Booth (1999a) for further details. This means that in real terms the gap between incomes of the rural landless and the urban middle classes widened even more than the nominal data in the SAM indicate. 12 For a useful statistical discussion of the impact of increasing or decreasing
inequalities on poverty, see van der Hoeven (1999).
13 A considerably higher proportion of the non-agricultural labour force in Indonesia in 1992 was absorbed in the service sector than was the case in Taiwan, South Korea and Japan when these economies were at a similar level of GDP per capita (Booth 1999b: table 9).
14 These results for rural areas hold even when the provinces of Java and Bali are excluded; more details are given in Booth and Gunasingham (1997). 15 Sundrum and Booth (1980: table 8) showed that the Gini coefficient of land
distribution in Kalimantan in 1973 was 0.62, compared with 0.48 in Java and 0.51 in Sumatra. But these figures exclude the land held by large estates, both private and government. When estate lands are added in, the distribution of land is more skewed in Indonesia than in Taiwan, although a larger percentage of all land is in holdings under one hectare than in the Philippines or Thailand (Booth 1997c: table 6).
16 Tan and Mingat’s estimates indicate that the level of subsidy per primary student in Indonesia (expressed as a ratio of per capita GNP) was about average for the Asian region, but at the tertiary level it was much lower than average. Public subsidies are less skewed towards higher education in Indonesia than in any other Asian country except Thailand and the Philippines.
17 Colclough (1996) gives a lucid review of the arguments for and against higher fees for upper levels of education in developing countries.
19 As was the case after 1981, it appears that the brunt of the GDP contraction in 1998 was taken by investment rather than consumption expenditures, which did not decline as rapidly as total GDP.
20 Van de Walle (1998) provides a lucid summary of the literature.
REFERENCES
Ahuja, Vinod, Benu Bidani, Francisco Ferreira and Michael Walton (1997),
Everyone’s Miracle? Revisiting Poverty and Inequality in East Asia, World Bank, Washington.
Akita, Takahiro, and Rizal Affandi Lukman (1995), ‘Interregional Inequalities in Indonesia: A Sectoral Decomposition Analysis for 1975–92’, Bulletin of Indonesian Economic Studies 31 (2): 61–82.
Akita, Takahiro, Rizal Affandi Lukman and Yukino Yamada (1999), ‘Inequality in the Distribution of Household Expenditures in Indonesia: A Theil Decomposition Analysis’, The Developing Economies 37 (2): 197–221. Asher, Mukul G., and Anne Booth (1992), ‘Fiscal Policy’, in Anne Booth (ed.), The
Oil Boom and After: Indonesian Economic Policy and Performance in the Soeharto Era, Oxford University Press, Singapore.
Asra, Abuzar (1989), ‘Inequality Trends in Indonesia: A Reexamination’, Bulletin of Indonesian Economic Studies 25 (2): 100–10.
Atkinson, A. (1983), The Economics of Inequality, 2nd ed., Clarendon Press, Oxford. —— (1995), Incomes and the Welfare State: Essays on Britain and Europe, Cambridge
University Press, Cambridge.
Azis, Iwan Jaya (1994), ‘Indonesia’, in J. Williamson (ed.), The Political Economy of Policy Reform, Institute for International Economics, Washington: 385–416. Balisacan, Arsenio M. (1993), ‘Agricultural Growth, Landlessness, Off-farm
Employment, and Rural Poverty in the Philippines’, Economic Development and Cultural Change 41 (3): 533–62
Booth, Anne (1988), Agricultural Development in Indonesia, Allen and Unwin, Sydney for the Asian Studies Association of Australia.
—— (1992), ‘Income Distribution and Poverty’, in Anne Booth (ed.), The Oil Boom and After: Indonesian Economic Policy and Performance in the Soeharto Era, Oxford University Press, Singapore.
—— (1993), ‘Counting the Poor in Indonesia’, Bulletin of Indonesian Economic Studies
29 (1): 53–84.
—— (1994), ‘Repelita VI and the Second Long-term Development Plan’, Bulletin of Indonesian Economic Studies 30 (3): 1–39.
—— (1996), ‘Regional Disparities and Inter-governmental Fiscal Relations in Indonesia’, in Ian Cook, Marcus Doel and Rex Li (eds), Fragmented Asia: Regional Integration and National Disintegration in Pacific Asia, Avebury, Aldershot.
—— (1997b), ‘Rapid Economic Growth and Poverty Decline: A Comparison of Indonesia and Thailand 1981–1990’, Journal of International Development 9 (2): 169–87.
—— (1997c), Rural Development, Income Distribution and Poverty Decline in South East Asia, Paper presented to the Conference on Africa–Asia Collaborative Research, Johannesburg, 3–6 November.
—— (1999a), The Impact of the Crisis in South East Asia on Poverty and Equity: A Preliminary Analysis, Paper presented at the Inaugural Development Studies Association Workshop on ‘The New Poverty Strategies’, University of Reading, April.
—— (1999b), ‘Initial Conditions and Miraculous Growth: Why is South East Asia Different from Taiwan and South Korea?’, World Development 27 (2): 301–21. —— (1999c), ‘Survey of Recent Developments’, Bulletin of Indonesian Economic
Studies 35 (3): 1–38.
Booth, Anne, and B. Gunasingham (1997), Poverty in Indonesia, Paper prepared for ILO/SEAPAT, Manila.
Booth, Anne, and R.M. Sundrum (1981), ‘Income Distribution’, in Anne Booth and Peter McCawley (eds), The Indonesian Economy in the Soeharto Era,Oxford University Press, Kuala Lumpur.
BPS (Central Bureau of Statistics) (1973), Survey Sosial Ekonomi Nasional, Tahap Ke-empat (Oktober 1969 – April 1970): Pengeluaran untuk Konsumsi Penduduk
[National Socio-Economic Survey Phase 4 (October 1969 – April 1970, Expenditure for Consumption], Jakarta.
—— (1982a), Survey Sosial Ekonomi Nasional: Pengeluaran untuk Konsumsi Penduduk, Jawa, February 1980,Jakarta.
—— (1982b), Survey Sosial Ekonomi Nasional, Pengeluaran untuk Konsumsi Penduduk, Luar Jawa, February 1980, Jakarta.
—— (1987), Sensus Pertanian 1983, Seri I: Sampel Pendapatan Petani [Agricultural Census 1983, Series I: Farmers Income Sample], Jakarta.
—— (1988), Indikator Tingkat Hidup Pekerja 1986 [Workers Standard of Living Indicators 1986], Jakarta, January.
—— (1990), Survei Biaya Hidup 1989, Buku 2: Ibukota Propinsi di Jawa [Cost of Living Survey 1989, Book 2: Provincial Capitals in Java], Jakarta.
—— (1992), Kemiskinan dan Pemerataan Pendapatan di Indonesia 1976–1990 [Poverty and Income Equality in Indonesia 1976–1990], Jakarta.
—— (1994), Penduduk Miskin dan Desa Tertinggal 1993: Metodologi dan Analisis [Poor People and Backward Villages 1993: Methodology and Analysis], Jakarta. —— (1995a), Sensus Pertanian 1993, Seri B1: Sensus Sampel Rumahtangga Pertanian
Pengguna Lahan [Land Holding Farmers Sample Census],Jakarta.
—— (1995b), Sensus Pertanian 1993, Seri D1: Pendapatan Rumahtangga Pertanian dan Indikator Sosial Ekonomi [Agricultural Household Income and Socio-Economic Indicators], Jakarta.
—— (1996), Sistem Neraca Sosial Ekonomi Indonesia 1993 [Socio-Economic Balance Sheet System, Indonesia 1993], Jakarta.
—— (1997b), Gross Regional Domestic Product of Provinces in Indonesia by Industrial Origin, 1993–96,Jakarta.
—— (1997c), Indikator Tingkat Hidup Pekerja 1994–6 [Workers Standard of Living Indicators 1994–6], Jakarta.
BPS (Central Statistics Agency) (1999), Sistem Neraca Sosial Ekonomi Indonesia 1998
[Socio-Economic Balance Sheet System, Indonesia 1998], Jakarta.
Cameron, Lisa A. (1999), Poverty and Inequality in Java: Examining the Impact of the Changing Age, Educational and Industrial Structure, Department of Economics, University of Melbourne (mimeo).
Colclough, Christopher (1996), ‘Education and the Market: Which Parts of the Neoliberal Solution are Correct?’, World Development 24 (4): 589–610. Cole, David C., and Betty Slade (1996), Building a Modern Financial System: The
Indonesian Experience, Cambridge University Press, Cambridge.
Department of Information (1998), Lampiran Pidato Kenegaraan, 15 Agustus 1998, Department of Information, Jakarta.
Devas, Nick (1989), Financing Local Government in Indonesia, Ohio University Monograph in International Studies Number 84, Ohio University, Athens. Eng, Pierre van der (1992), ‘The Real Domestic Product of Indonesia, 1880–1989’,
Explorations in Economic History 29: 343–73.
Esmara, Hendra (1986), Perencanaan dan Pembangunan di Indonesia [Planning and Development in Indonesia], Gramedia, Jakarta.
Gertler, Paul J., and Omar Rahman (1994), ‘Social Infrastructure and Urban Poverty’, in E. Pernia (ed.), Urban Poverty in Asia: A Survey of Critical Issues, Oxford Universty Press, Hong Kong.
Hoeven, Rolph van der (1999), Poverty and Structural Adjustment: Some Remarks on Tradeoffs between Equity and Growth, Paper presented at the Inaugural Development Studies Association Workshop on ‘The New Poverty Strategies’, University of Reading, April.
Huppi, Monika, and Martin Ravallion (1991), ‘The Sectoral Structure of Poverty during an Adjustment Period: Evidence for Indonesia in the Mid 1980s’, World Development 19 (12): 1,653–78.
Intal, Ponciano S. (1992), ‘Real Exchange Rates, Price Competitiveness and Structural Adjustment in Asian and Pacific Economies’, Asian Development Review 10 (2): 86–123.
King, Elizabeth M. (1997), ‘Who Really Pays for Education? The Roles of Government and Families in Indonesia’, in C. Colclough (ed.), Marketizing Education and Health in Developing Countries, Clarendon Press, Oxford. King, Dwight Y., and Peter D. Weldon (1977), ‘Income Distribution and Levels of
Living in Java, 1963–1970’, Economic Development and Cultural Change 25 (4): 699–711.
Kuo, Wan-yong (1975), ‘Income Distribution by Size in Taiwan Area: Changes and Causes’, in Income Distribution, Employment and Economic Development in Southeast and East Asia, Japan Economic Research Center, Tokyo, and Council for Asian Manpower Studies, Manila.
Manning, Chris (1998), Indonesian Labour in Transition: An East Asian Success Story?, Cambridge University Press, Cambridge.
Mizoguchi, Toshiyuki, and Tateo Yoshida (1998), ‘Evaluation of Asian Income Distribution and Poverty Ratios Using Worldwide Income Distribution’, Asian Economic Journal 12 (2): 183–93.
Nasution, Anwar (1993), ‘Reforms of the Financial Sector in Indonesia, 1983–1991’,
Indonesian Quarterly 21 (3): 284–310.
Oey-Gardiner, Mayling (1997), ‘Educational Developments, Achievements and Challenges’, in Gavin Jones and Terence Hull (eds), Indonesia Assessment: Population and Human Resources, Institute of Southeast Asian Studies, Singapore.
Paauw, Douglas (1978), ‘Exchange Rate Policy and Non-extractive Exports’,
Ekonomi dan Keuangan Indonesia 26 (2): 205–20.
Pangestu, Mari (1991), ‘Managing Economic Policy Reforms in Indonesia’, in S. Ostry (ed.), Authority and Academic Scribblers: The Role of Research in East Asian Policy Reform, International Center for Economic Growth, San Francisco: 93– 120.
Patten, Richard, Belinda Dapice and Walter Falcon (1980), ‘An Experiment in Rural Employment Creation: The Early History of Indonesia’s Kabupaten
Development Program’, in G.F. Papanek (ed.), The Indonesian Economy, Praeger, New York.
Rao, V.V.B. (1984), ‘Philippines’, in Wouter van Ginneken and Jong-Joo Park,
Generating Internationally Comparable Income Distribution Estimates, ILO, Geneva.
Ravallion, Martin (1988), ‘Inpres and Inequality: A Distributional Perspective on the Centre’s Regional Disbursements’, Bulletin of Indonesian Economic Studies
24 (3): 53–71.
—— (1992), ‘Poverty Comparisons: A Guide to Concepts and Methods’, Living Standards Measurement Study Working Paper No. 88, World Bank, Washington DC.
Ravallion, Martin, and Benu Bidani (1994), ‘How Robust is a Poverty Profile?’,
World Bank Economic Review 8 (1): 75–102.
Ravallion, Martin, and Gaurav Datt (1996a), ‘India’s Checkered History in Fight Against Poverty’, Economic and Political Weekly, Special Number September: 2,479–85.
—— (1996b), ‘How Important to India’s Poor is the Sectoral Composition of Economic Growth?’, World Bank Economic Review 10 (1): 1–25.
Ravallion, Martin, and Monika Huppi (1991), ‘Measuring Change in Poverty: A Methodological Case Study of Indonesia during an Adjustment Period’, World Bank Economic Review 5 (1): 57–82.
Sigit, Hananto (1985), ‘Income Distribution and Household Characteristics’, Bulletin of Indonesian Economic Studies 21 (3): 51–68.
Stewart, Frances (1995), Adjustment and Poverty: Options and Choices, Routledge, London.
—— (1974), ‘Household Income Patterns’, Bulletin of Indonesian Economic Studies
10 (1): 82–105.
Sundrum, R.M., and Anne Booth (1980), ‘Income Distribution in Indonesia: Trends and Determinants’, in R.G. Garnaut and Peter McCawley (eds),Indonesia: Dualism, Growth and Poverty, Research School of Pacific Studies, Australian National University, Canberra.
Tan Jee-Peng and Alain Mingat (1992), Education in Asia: A Comparative Study of Cost and Financing, The World Bank, Washington DC.
Thorbecke, Erik, et al. (1992), Adjustment and Equity in Indonesia, OECD, Paris. Walle, Dominique van de (1998), ‘Targeting Revisited’, World Bank Research Observer