Summary Rooted cuttings from three aspen (Populus tremu-loides Michx.) clones (216, 271 and 259, classified as high, intermediate and low in O3 tolerance, respectively) were ex-posed to either diurnal O3 profiles simulating those of Michi-gan’s Lower Peninsula (episodic treatments), or diurnal square-wave O3 treatments in open-top chambers in northern Michigan, USA. Ozone was dispensed in chambers ventilated with charcoal-filtered (CF) air. In addition, seedlings were compared to rooted cuttings in their response to episodic O3 treatments. Early in the season, O3 caused decreased photosyn-thetic rates in mature leaves of all clones, whereas only the photosynthetic rates of recently mature leaves of the O3 -sensi-tive Clone 259 decreased in response to O3 exposure. During midseason, O3 caused decreased photosynthetic rates of both recently mature and mature leaves of the O3-sensitive Clone 259, but it had no effect on the photosynthetic rate of recently mature leaves of the O3-tolerant Clone 216. Late in the season, however, photosynthetic rates of both recently mature and mature leaves of Clone 216 were lower than those of the control plants maintained in CF air. Ozone decreased the photosyn-thetic rate of mature leaves of Clone 271, but it increased or had no effect on the photosynthetic rate of recently mature leaves. Photosynthetic response patterns of seedlings to O3 treatment were similar to those of the clones, but total magni-tude of the response was less, perhaps reflecting the diverse genotypes of the seedling population. Early leaf abscission was observed in all clones exposed to O3; however, Clones 216 and 259 lost more leaf area than Clone 271. By late August, leaf area in the highest O3 treatment had decreased relative to the controls by 26, 24 and 9% for Clones 216, 259 and 271, respectively. Ozone decreased whole-tree photosynthesis in all clones, and the decrease was consistently less in Clone 271 (23%) than in Clones 216 (56%) and 259 (56%), and was accompanied by declines in total biomass of 19, 28 and 47%, respectively. The relationship between biomass and whole-tree photosynthesis indicates that the negative impact of O3 on biomass in the clones was determined largely by lower photo-synthetic productivity of the foliage, rather than by potential changes in the carbon relations of other plant organs.
Keywords: biomass production, leaf abscission, leaf age classes, photosynthesis, photosynthetic light-response curves, Populus tremuloides, whole-tree photosynthesis.
Introduction
Tropospheric ozone is a potent, widespread phytotoxin that causes significant damage to plants (Adams et al. 1989). But relatively little is known about O3-stress tolerance in forest trees (Sasek and Richardson 1989). Previous studies have shown that the negative effects of O3 on productivity are correlated with decreasing stomatal conductance and photo-synthesis, premature leaf abscission, and decreases in leaf size, all of which decrease total carbon accumulation (Reich 1987, Pye 1988, Matyssek et al. 1993). The decrease in photosynthe-sis in response to O3 may result from oxidative damage to cell membranes, light harvesting processes or carbon fixation (Pell 1987, Landry and Pell 1993).
Genetic differences in the growth response of tree species to O3 have been found (Wang et al. 1986), but little is known about the mechanisms underlying these differences. To inves-tigate the physiological basis for genetic differences in O3 sensitivity, we examined photosynthesis and biomass alloca-tion responses to O3 exposure in aspen (Populus tremuloides Michx.) clones and seedlings that differ in O3 sensitivity.
Methods
Plant material
Aspen clones from the Great Lakes region ranging in sensitiv-ity to O3 (216, high O3 tolerance; 271, intermediate O3 toler-ance; and 259, low O3 tolerance) were selected based on susceptibility to foliar injury and decreases in biomass after O3 exposure (Karnosky et al. 1992). Experimental plants were vegetatively propagated as softwood cuttings from vigorously growing shoots from potted stock material. Rooted cuttings were transplanted to 6-l pots containing perlite/peat moss/or-ganic top soil (1/1/1 v/v) and 8 g of slow release (3- to 4-month release) fertilizer (17/6/12 N,P,K plus minor nutrients, Sierra
Photosynthetic productivity of aspen clones varying in sensitivity to
tropospheric ozone
M. D. COLEMAN,
1J. G. ISEBRANDS,
1,3R. E. DICKSON
1and D. F. KARNOSKY
21 USDA Forest Service, North Central Forest Experiment Station, Forestry Sciences Laboratory, P.O. Box 898, Rhinelander, WI 54501, USA 2 School of Forestry and Wood Products, Michigan Technological University, Houghton, MI 49931, USA
3 Author to whom correspondence should be addressed
Received August 16, 1993
Chemical Corp., Milpitas, CA). Transplants were grown in a greenhouse (21 °C, 17-h photoperiod) until transferred to shaded field conditions on June 6, 1990. Plants were placed in open-top chambers located in northern Michigan on June 18, and ozone treatments were started June 20. In 1991, plants were transferred to shaded field conditions on June 4 and placed in open-top chambers on June 8; exposures started on June 9. In 1990, each plant had about 25 leaves before treat-ment, and in 1991, each plant had about 14 leaves.
In 1991, aspen seedlings, reared from seed collected from native northern Michigan populations, were also transplanted to the same potting mix described for the clonal plantlets. Seedlings were grown in a greenhouse for 4 weeks, transferred to shaded field conditions on June 4 and placed in open-top chambers on June 8. Seedlings (six leaves) were smaller than the clonal plants when placed in the open-top chambers. Plants subjected to episodic O3 treatments in both 1990 and 1991 and plants subjected to square-wave treatments in 1991 were har-vested in mid-September.
Ozone exposures
The episodic O3 exposures of clones and seedlings designed to mimic natural O3 exposures were based on diurnal ambient O3 profiles constructed from O3 data collected in Michigan’s Lower Peninsula in cooperation with the US Environmental Agency (Karnosky, unpublished data). The simulated ambient profiles were, therefore, not related to or based on current ambient O3 concentrations at the northern Michigan site. The simulated ambient profile (1×) provided hourly target concen-trations achieved by means of automatic O3 dispensing equip-ment. Target values were doubled for the twice ambient (2×) O3 treatment. The O3 treatments were compared to a charcoal-filtered (CF) air treatment (control). Ozone for the 1× and 2× treatments was generated from pure oxygen with an OREC Model V10-0 O3 generator and dispensed into open-top cham-bers ventilated with CF air. There were three chamcham-bers (i.e., replications) per treatment. Square-wave O3 exposures of clones, a procedure designed to deliver a constant amount of O3, were also applied in 1991. Two open-top chambers were ventilated with CF air (control) and two chambers were treated with 100 ppb O3 for 6 h per day for four consecutive days per week. Target concentrations were maintained by manually adjusting the ozone generator output. Ozone concentrations were monitored in all chambers on a time-shared basis with a Scanivalve System and TECO model 49 O3 analyzers and a Monitor Labs model 8500 O3 calibrator. Mean hourly O3 concentrations for each chamber were recorded and summed over the growing season. Values thus obtained were reflective of O3 doses observed in the northeastern USA (Table 1) (cf. Lefohn and Pinkerton 1988).
Gas exchange measurement
Photosynthetic carbon exchange rate (CER) was measured under controlled environmental conditions and under ambient conditions in the open-top chambers with an LI-6200 portable photosynthesis system (Li-Cor Inc., Lincoln, NE).
Environ-mental conditions were controlled by placing the LI-6200 1-liter cuvette in a small room cooled with a thermostatically controlled air conditioner. Air containing ambient CO2 con-centrations was pumped from outside at a height of 4 m into a precision temperature-controlled bubbler, to control vapor pressure, and then to the cuvette. During photosynthetic meas-urements, air flow was switched from the open-flow condi-tioned air source to the transient Li-Cor system for data collection. Photosynthetic light-response curves were devel-oped for plants in each treatment. The CER of individual recently mature leaves was measured at different irradiances. Variable irradiances (0 to 1600 µmol m−2 s−1) were produced by shading a high intensity OSRAM lamp (HQI-TS-250W/NOL, Berlin, Germany). Irradiances inside the cuvette were checked with a quantum sensor (LI-190S, Li-Cor Inc.).
To determine leaf positional and seasonal effects on gas exchange, plants were measured in the open-top chambers under ambient CO2 concentrations and saturating light (> 600 µmol m−2 s−1 photosynthetically active radiation, PAR). Pho-tosynthesis and stomatal conductance were measured on a single, recently mature leaf and a single mature leaf, or on a series of leaves down the plant (Figure 1). Cloudy conditions often forced us to take measurements on several consecutive days. Respiration of plants in the episodic and square-wave O3 exposure treatments was measured at least 1 h after dark.
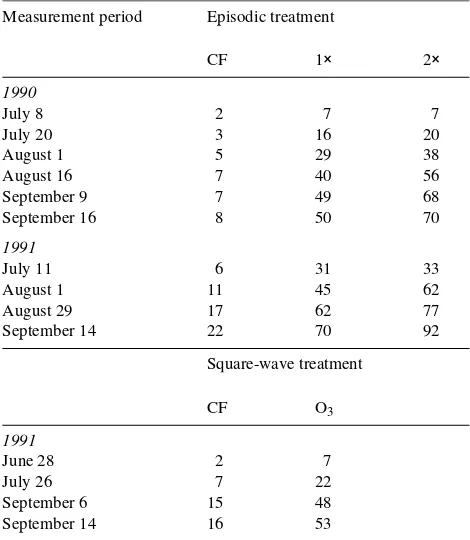
Table 1. Cumulative O3 doses for episodic treatments in 1990 and 1991
and the square-wave treatment in 1991. Dose values (ppm-h) are presented as cumulative hourly means of O3 for three open-top
cham-bers. Cumulative doses for the date given can be related to photosyn-thetic measurements (Figures 3--6). The last date represents the total seasonal exposure (charcoal-filtered air = CF, ambient O3 = 1×, twice
ambient O3 = 2×).
September 14 22 70 92
Leaf area
Leaf area was estimated from leaf length by leaf area regres-sion equations developed for a set of companion plants. Leaf area was measured on detached leaves with an LI-3000A portable leaf area meter (Li-Cor Inc.). Data were collected and linear equations were developed for each clone × treatment combination at each measurement period. Nondestructive leaf length measurements were then used to predict individual and whole-plant leaf areas.
Whole-tree photosynthesis
Whole-tree photosynthesis (WTP) was calculated as the prod-uct of leaf area and photosynthetic carbon exchange rate (CER) for each tree measured. In 1990, CER for the recently mature and mature leaf age classes was averaged and multi-plied by whole-tree leaf area to calculate WTP. In 1991, two to five leaf age classes were defined by position on the stem. Photosynthesis for each leaf age class was estimated from the photosynthetic rate of one representative leaf and the age class leaf area. Photosynthetic values for each age class were summed to obtain WTP. Wolf et al. (1995) showed that meas-urement of any leaf in each of two stratified mature-leaf age classes is sufficient to define WTP of early season first-year trees. As plants grew larger, however, it was necessary to add additional leaf age classes in the mature leaf zone (i.e., one photosynthetic measurement leaf for an age class of 10 leaves). The area of leaves in the expanding leaf zone was included with the recently mature leaf age class because only the largest expanding leaves had enough area or CER to be of conse-quence.
Statistical analysis
Photosynthetic light-response curves were fitted to the model of Hanson et al. (1987) by means of quasi-Newton nonlinear iterative minimization methods (SYSTAT Inc., Evanston, IL)
(Wilkinson 1990). The hypothesis that ozone treatment re-sulted in different photosynthesis versus irradiance relations was tested by comparing nonlinear regressions according to the f-test method of Ratkowsky (1983). Analysis of variance was used to test differences among model parameters. Photo-synthetic measurements in the leaf position series and the relationship between WTP and biomass were analyzed by least squares linear regression analysis and 95% confidence inter-vals were calculated by means of a graphics and statistical analysis program (SigmaPlot, Jandel Scientific, San Rafael, CA). Mean and standard error for in-chamber measurements of photosynthesis, dark respiration, stomatal conductance and leaf area were calculated from two seedlings or two trees per clone in each episodic or square-wave exposure treatment chamber.
Results
Photosynthetic light-response curves
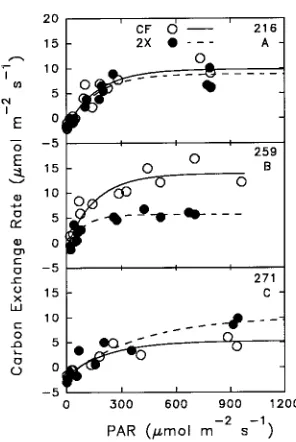
The 2× O3 treatment decreased the light-saturated photosyn-thetic rate of recently mature leaves of the O3-sensitive Clone 259, had little or no effect on Clone 216, and increased the photosynthetic rate of Clone 271 (Figure 2). A family of light-response curves developed from photosynthetic data col-lected under controlled environment conditions throughout the growing season showed more variability in response to the 2× O3 treatment than to the CF treatment (Table 2).
Figure 1. The relationship between leaf age class and leaf plastochron index (LPI, Larson and Isebrands 1971). The shading indicates the position of leaves in which photosynthesis was measured.
Figure 2. Photosynthetic light-response curves of aspen clones. Three aspen clones (216, 259, 271) were exposed to two episodic O3
Model parameters calculated from the photosynthetic light-response curves followed the same pattern (Table 2). However, there was no effect of the 2× O3 exposure on photosynthetic rate averaged across all clones because of the contrasting responses of Clones 259 and 271. Ozone increased the dark respiration rates of Clones 259 and 271. In all clones, compen-sation points increased in response to O3, but the values did not differ significantly among clones. Quantum efficiency of all clones was similar in both the CF and 2× O3 treatments.
Photosynthetic carbon exchange
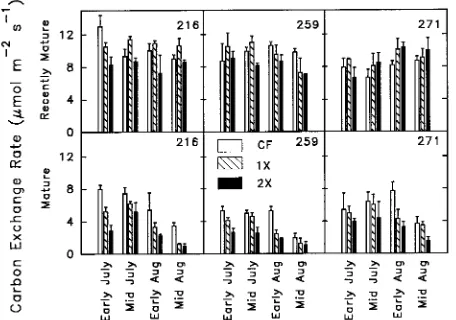
In all clones, photosynthetic rates of recently mature leaves
were greater than those of mature leaves (Figure 3). There was little seasonal effect on CER of recently mature leaves, but CER of mature leaves declined during the growing season. In recently mature leaves, the 1× O3 exposure often increased CER compared to the CF treatment. The 2× O3 exposure decreased CER in recently mature leaves of Clones 216 and 259, but increased the rate in recently mature leaves of Clone 271, particularly late in the growing season. Both ozone treat-ments decreased CER of mature leaves (Figure 3).
Carbon exchange rates decreased with leaf plastochron in-dex (LPI, Larson and Isebrands 1971) in all clones when measured late in the season in both years of study under episodic and square-wave treatments (Figures 4 and 5). The relationship between CER and leaf position was linear; no significant improvement in prediction was found by adding a quadratic term to the regression model (Kilenbaum and Kup-per 1978). Ozone exposure increased the decline in CER as leaves aged (Figures 4 and 5). Leaf aging patterns were similar for both the episodic and square-wave O3-treated plants, but O3 effects were greater in plants in the square-wave treatment. Early in the growing season (June 28), CER of plants did not decline much with leaf position in the CF treatment, but the effect of O3 was severe (Figure 5). Photosynthetic rates de-clined rapidly in older leaves. As the season progressed, CER curves of plants in the CF and 2× O3 treatments tended to converge. However, CER was always lower in O3-treated plants, particularly in Clone 259, than in plants in the CF treatment.
Stomatal conductance decreased during the growing season in both recently mature and mature leaves (Figure 6), and was generally greater in recently mature leaves than in mature leaves. In recently mature leaves, ozone effects on stomatal conductance varied among the clones and over the season. In mature leaves, O3 decreased stomatal conductance, particu-larly early in the growing season.
Respiration rates were greater in recently mature than in
Table 2. Mean ( ± standard errors) model parameters for light-response curves constructed for three aspen clones (216, 259, 271) exposed to two episodic O3 treatments (charcoal-filtered air = CF, twice ambient O3 = 2×, n = number of leaves measured and number of response curves).
Probability values less than 0.05 are considered significant.
Clone Treatment Maximum CER Dark respiration Compensation irradiance Quantum efficiency
µmol m−2 s−1 µmol m−2 s−1 µmol m−2 s−1 µmol µmol−1
216 CF, n = 6 9.2 ± 0.9 2.1 ± 0.3 48.9 ± 11.4 0.056 ± 0.009 2×, n = 6 9.2 ± 1.7 2.2 ± 0.2 88.3 ± 48.7 0.055 ± 0.013 259 CF, n = 8 9.3 ± 0.8 1.7 ± 0.2 40.5 ± 8.0 0.055 ± 0.009 2×, n = 9 5.8 ± 1.4 3.3 ± 0.6 49.6 ± 8.0 0.101 ± 0.037 271 CF, n = 4 5.8 ± 0.6 1.7 ± 0.1 60.1 ± 8.9 0.035 ± 0.005 2×, n = 3 9.8 ± 0.3 2.6 ± 0.3 75.7 ± 28.8 0.046 ± 0.011 Mean CF, n = 18 8.5 ± 0.6 1.8 ± 0.1 47.7 ± 5.6 0.051 ± 0.005 2×, n = 18 7.6 ± 1.0 2.8 ± 0.3 67.8 ± 17.7 0.077 ± 0.020
Source Analysis of variance probabilities
Ozone 0.876 0.037* 0.292 0.392
Clone 0.371 0.638 0.470 0.355
O × C 0.041* 0.165 0.767 0.579
Figure 3. Photosynthetic carbon exchange rates (CER) for recently mature and mature leaves determined during the 1990 growing season. Three aspen clones (216, 259, 271) were exposed to three episodic O3
older leaves and greater early in the season than later in the season. Ozone increased respiration rates in both leaf age-classes early in the growing season, but had little effect on mature leaves late in the season (Figure 7). In recently mature leaves, respiration rates also differed among the clones late in the growing season.
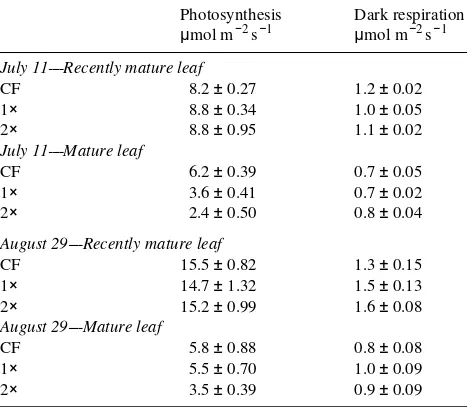
Seedling photosynthetic and respiration responses to epi-sodic O3 exposures were less than in the clones, although the patterns were similar (Table 3). Ozone had little effect on CER of recently mature leaves throughout the growing season, but decreased CER of mature leaves. Respiration rates were greater in recently mature leaves than in mature leaves, but were not affected by the episodic O3 exposures.
Figure 4. Changes in photosynthetic carbon exchange rates (CER) with leaf position in 1990. Three aspen clones (216, 259, 271) exposed to two episodic O3 treatments (CF and 2×) were measured on August
22 (A, B and C, two trees per treatment) and September 9, 1990 (D, E and F, one tree per treatment). Leaf position as determined by leaf plastochron index (LPI) increased from the top to the base of the plant (see Figure 1). Only fully expanded leaves were measured. Lines are plotted from linear regressions. Dotted lines represent the 95% confi-dence interval.
Figure 5. Changes in photosynthetic carbon exchange rates (CER) with leaf position in 1991. Three aspen clones (216, 259, 271) were exposed to two square-wave O3 treatments (CF and 100 ppb O3 for 6 h per day for 4 consecutive days per week). Leaf position was deter-mined by leaf plastochron index (LPI). The CER was deterdeter-mined on June 28 (A, B, C), July 26 (D, E, F) and September 6, 1991 (G, H, I) on individual leaves from four trees per treatment. Only fully ex-panded leaves were measured. Lines are plotted from linear regres-sions. Dotted lines represent the 95% confidence interval.
Figure 6. Stomatal conductance rates for recently mature (A, C, E) and mature (B, D, F) leaves determined in 1991. Three aspen clones (216, 259, 271) were exposed to two square-wave O3 treatments (CF and 100 ppb O3 for 6 h per day for 4 consecutive days per week). Stomatal
conductance was determined during CER measurements on June 28 (A, B), July 26 (C, D) and September 6 (E, F). Each bar shows the mean ± standard error derived from measuring one leaf on each of four trees per treatment.
Figure 7. Respiration rates for recently mature (A, C) and mature (B, D) leaves determined in 1991. Three aspen clones (216, 259, 271) were exposed to two square-wave O3 treatments (CF and 100 ppb O3
Whole-tree photosynthesis
Total leaf area increased during the growing season in all three clones in both the CF and 1× O3 treatments (Figure 8). Total leaf area in the 2× O3 treatment, however, remained constant during the season for Clones 216 and 259, but increased for Clone 271. Clone 271 retained more lower leaves in the 2× O3 treatment than the other clones. Whole-tree photosynthesis generally increased, then decreased during the growing season
for all three clones (Figure 8). Both the 1× and 2× O3 treat-ments significantly inhibited whole-tree photosynthesis, par-ticularly late in the growing season, as a result of decreased leaf area and CER. Whole-tree photosynthesis of Clone 259 was sensitive to the 1× O3 treatment, WTP of Clone 216 was sensitive to the 2× O3 treatment, and WTP of Clone 271 was not severely inhibited by either of the O3 treatments. Similar results were obtained in 1991 in both the episodic and square-wave O3 treatments.
Discussion
Photosynthetic light-response curves
The analysis of photosynthetic response curves to increasing irradiance provides information about physical and biochemi-cal factors that control photosynthetic rates such as quantum yield and other light energy reactions, and the regeneration of ribulose-1,5-bisphosphate (Stitt 1991). Our light-response curves, averaged over the growing season, suggest O3 exposure had little effect on quantum efficiency (Table 2). The upper asymptote or light-saturated CER was influenced by O3 and the effect differed among clones (Figure 2). Clone 259, the most productive clone when grown with high fertility (Cole-man et al. 1993), was the most sensitive to O3 exposure. In general, the 2× O3 treatment caused a 50% reduction in maxi-mum CER of recently mature leaves of Clone 259, had no effect on maximum CER of recently mature leaves of Clone 216, and increased CER of Clone 271. This pattern was con-sistent among clones, although the actual response differed with leaf age and season, indicating that O3 modified either the amount or activity of Rubisco, and this modification differed among the three clones.
Photosynthetic carbon exchange
Photosynthetic CER varied with leaf age, among clones and in response to O3, and these patterns changed during the growing season (cf. Isebrands et al. 1988). In all clones in the CF treatment, photosynthetic rates increased as leaves expanded, reached a plateau with full expansion in recently mature leaves, and then decreased as leaves aged (cf. Dickmann et al. 1975, Mebrahtu and Hanover 1991, Horsley and Gottschalk 1993). Photosynthetic rates of older leaves declined more in response to O3 exposure than those of recently mature leaves as the growing season progressed (Figures 3 and 5), confirm-ing that the O3 response is greater in old leaves than in young leaves (Reich 1983, Ballach et al. 1992, Matyssek et al. 1993). The June measurements were made on leaves that were fully expanded before the plants were placed in the chambers. Measurements later in the season were made on leaves that had been exposed to O3 for some time or since their initiation. Thus, the finding that the photosynthetic response to O3 was greater early in the growing season than late in the season (Figure 5) suggests that the leaves became physiologically acclimated to O3 exposure. However, the capacity to acclimate differed among clones.
Photosynthesis in Clone 259 (an O3-sensitive clone) de-creased in response to 1× O3 exposure in both recently mature
Table 3. Photosynthesis and dark respiration of aspen seedlings. Data given are the means ± standard error of one recently mature and one mature leaf on each of six plants grown under episodic O3 exposures
in 1991 (see Table 1) (charcoal-filtered air = CF, ambient O3 = 1×,
twice ambient O3 = 2×).
Photosynthesis Dark respiration
µmol m−2 s−1 µmol m−2 s−1
July 11----Recently mature leaf
CF 8.2 ± 0.27 1.2 ± 0.02 1× 8.8 ± 0.34 1.0 ± 0.05 2× 8.8 ± 0.95 1.1 ± 0.02
July 11----Mature leaf
CF 6.2 ± 0.39 0.7 ± 0.05 1× 3.6 ± 0.41 0.7 ± 0.02 2× 2.4 ± 0.50 0.8 ± 0.04
August 29----Recently mature leaf
CF 15.5 ± 0.82 1.3 ± 0.15 1× 14.7 ± 1.32 1.5 ± 0.13 2× 15.2 ± 0.99 1.6 ± 0.08
August 29----Mature leaf
CF 5.8 ± 0.88 0.8 ± 0.08 1× 5.5 ± 0.70 1.0 ± 0.09 2× 3.5 ± 0.39 0.9 ± 0.09
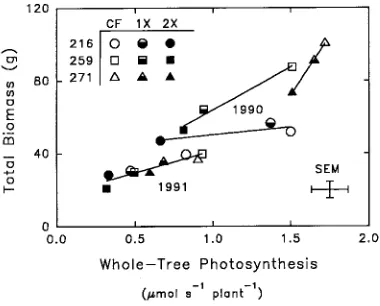
Figure 8. Total leaf area per plant and whole-tree photosynthesis (WTP) determined during the 1990 growing season. Three aspen clones (216, 259, 271) were exposed to three episodic O3 treatments
and matures leaves throughout the season. Photosynthesis in recently mature leaves of Clone 216 (an O3-tolerant clone) increased in response to 1× O3 exposure, but decreased in response to 2× O3 exposure, whereas photosynthesis in re-cently mature leaves of Clone 271 (also O3 tolerant) increased in response to both O3 treatments (Figures 3--5). Photosyn-thetic rates declined with O3 exposure in older leaves of all clones. Both the light-response curves and within chamber photosynthetic measurements for Clone 271 indicated in-creased photosynthetic activity in response to O3 exposure (Figure 2, Table 2). This increase in the amount or activity of Rubisco compared with that in plants in the CF treatment indicates a compensatory response. Early senescence and loss of lower leaves in response to O3 stress may initiate compen-satory responses similar to those caused by defoliation (cf. Bassman and Dickmann 1982, Heichel and Turner 1983, Tschaplinski and Blake 1989). An increase in leaf production rate in response to O3 was found in radish (Raphanus sativus L.) (Held et al. 1991), but we found no such response in these Populus clones. Compensatory responses are probably limited in these aspen clones because chronic O3 exposure continu-ously damages leaves as they are produced and age. Loss of photosynthetic capacity, early senescence, and early leaf ab-scission severely limited carbon assimilation in these aspen clones, particularly in the O3-sensitive Clone 259.
Stomatal conductance decreased with O3 exposure and with leaf age, but we found no consistently large clonal differences (Figure 6). Decreased stomatal conductance is a common response to O3 exposure (Olszyk and Tingey 1986, Matyssek et al. 1991, 1993). Respiration rates increased in response to O3 exposure, and this increase was greater early in the growing season (Figure 7). The seasonal shift in respiration response to O3 may also indicate acclimation. The increase in respiration in response to O3 was greater in the O3-sensitive Clone 259 than in the other clones. The gas exchange patterns were consistent for both treatment years (1990 and 1991), for both the episodic and square-wave O3 treatments, and for both clonal plants and seedlings. However, seedling photosynthetic and respiration responses to O3 were less than the clonal responses.
Whole-tree photosynthesis and biomass production
Plants exposed to O3 initially showed decreases in photosyn-thetic rates. They also showed premature leaf senescence and abscission, particularly in older leaves (Reich and Lassoie 1985, Sasek and Richardson 1989, Matyssek et al. 1993). Decreases in leaf and whole-tree photosynthesis also lead to decreased leaf, stem and root biomass (McLaughlin 1985, Reich and Lassoie 1985). Studies on our aspen clones showed that stem and root biomass production was sensitive to O3 exposure (Karnosky et al. 1992). Decreases in lower stem and root biomass were expected because the lower leaves on the stem are major contributors of fixed carbon downward to the root system (Dickson 1986).
In both years, total biomass production was linearly related to whole-tree photosynthesis (Figure 9) (cf. Isebrands et al. 1988). The decrease in biomass production in response to O3
exposure was greater for the O3-sensitive Clone 259 than for the O3-tolerant Clones 216 and 271. Whole-tree photosynthe-sis of Clone 271 was least sensitive to O3 because it was able to retain lower leaves (Figure 8) and increase photosynthetic rate of recently mature leaves (Figure 3). In all clones, O3 decreased whole-tree photosynthesis as a result of decreasing individual leaf photosynthetic rates, particularly in older leaves, and increasing leaf senescence and abscission.
We conclude that chronic exposure to low concentrations of tropospheric O3 commonly found within the natural range of trembling aspen can severely depress photosynthesis and de-crease productivity (about 35--40% in the O3-sensitive Clone 259) during the first year of growth in both O3-sensitive and O3-tolerant genotypes of aspen. Differences in O3 sensitivity among genotypes indicate that aspen may be undergoing natu-ral selection for O3 tolerance in many locations across the USA leading to decreases in productivity and losses in biodiversity (Berrang et al. 1989, 1991).
Acknowledgments
We gratefully acknowledge the technical assistance given by Zophie Gagnon and Fei Li for the plant culture, ozone treatments, and leaf and photosynthetic measurements. Funding was provided by the USDA Forest Service, Northern Global Change Program, USDA-CSRS Grant No. 89-34171-4384 and by US EPA Grant No. DW12934109-0. This paper was presented at the international workshop entitled ‘‘Eco-physiology and Genetics of Trees and Forests in a Changing Environ-ment’’ in Viterbo, Italy, in May 1993.
References
Adams, R.M., J.D. Glyer, S.L. Johnson and B.A. McCarl. 1989. A reassessment of the economic effects of ozone on U.S. agriculture. J. Air Pollut. Control Assoc. 39:960--968.
Ballach, H-J., J. Mooi and R. Wittig. 1992. Premature aging in Populus nigra L. after exposure to air pollutants. Angew Bot. 66:14--20. Figure 9. Total biomass and whole-tree photosynthesis (WTP) deter-mined at the end of the growing seasons in 1990 and 1991. Three aspen clones (216, 259, 271) were exposed to three episodic O3 treatments
Bassman, J.H. and D.I. Dickmann. 1982. Effects of defoliation in the developing leaf zone on young Populus×euramericana plants. I. Photosynthetic physiology, growth, and dry weight partitioning. For. Sci. 28:599--612.
Berrang, P., D.F. Karnosky and J.P. Bennett. 1989. Natural selection for ozone tolerance in Populus tremuloides: field verification. Can. J. For. Res. 19:519--522.
Berrang, P., D.F. Karnosky and J.P. Bennett. 1991. Natural selection for ozone tolerance in Populus tremuloides: an evaluation of nation-wide trends. Can. J. For. Res. 21:1091--1097.
Coleman, M.D., R.E. Dickson and J.G Isebrands. 1993. Steady-state nutrition of soil grown trembling aspen clones and the potential for gaseous pollutant experiments. Bull. Ecol. Soc. Am. 74(suppl.):197.
Dickmann, D.I., D.H. Gjerstad and J.C. Gordon. 1975. Developmental patterns of CO2 exchange, diffusion resistance and protein
synthe-sis in leaves of Populus×euramericana. In Environmental and Biological Control of Photosynthesis. Ed. R. Marcelle. Dr. W. Junk, The Hague, Netherlands, pp 171--181.
Dickson, R.E. 1986. Carbon fixation and distribution in young Popu-lus trees. In Proc. Crown and Canopy Structure in Relation to Productivity. Eds. T. Fujimori and D. Whitehead. Forestry and Forest Products Res. Inst., Ibaraki, Japan, pp 409--426.
Hanson, P.J., R.E. McRoberts, J.G. Isebrands and R.K. Dixon. 1987. An optimal sampling strategy for determining CO2 exchange rate as
a function of photosynthetic photon flux density. Photosynthetica 21:98--101.
Heichel, G.H. and N.C. Turner. 1983. CO2 Assimilation of primary
and regrowth foliage of red maple (Acer rubrum L.) and red oak (Quercus rubra L.): response to defoliation. Oecologia 57:14--19. Held, A.A., H.A. Mooney and J.N. Gorham. 1991. Acclimation to
ozone stress in radish: leaf demography and photosynthesis. New Phytol. 118:417--423.
Horsley, S.B. and K.W. Gottschalk. 1993. Leaf area and net photosyn-thesis during development of Prunus serotina seedlings. Tree Physiol. 12:55--69.
Isebrands, J.G., R. Ceulemans and B. Wiard. 1988. Genetic variation in photosynthetic traits among Populus clones in relation to yield. Plant Physiol. Biochem. 26:427--437.
Karnosky, D.F., Z.E. Gagnon, D.D. Reed and J.A. Witter. 1992. Growth and biomass allocation of symptomatic and asymptomatic
Populus tremuloides clones in response to seasonal ozone expo-sures. Can. J. For. Res. 22:1785--1788.
Kleinbaum, D.G. and L.L. Kupper. 1978. Applied regression analysis and other multi-variable methods. Duxbury Press, Boston, 556 p. Landry, L.G. and E.J. Pell. 1993. Modification of Rubisco and altered
proteolytic activity in O3-stressed hybrid poplar (Populus maxi-mowizii×trichocarpa). Plant Physiol. 101:1355--1362.
Larson, P.R. and J.G. Isebrands. 1971. The plastochron index as applied to developmental studies of cottonwood. Can. J. For. Res. 1:1--11.
Lefohn, A.S. and J.E. Pinkerton. 1988. High resolution charac-terization of ozone data for sites located in forested areas of the United States. J. Air Pollut. Control Assoc. 38:1504--1511. Matyssek, R., M.S. Gunthardt-Goerg, T. Keller and C. Scheidegger.
1991. Impairment of gas exchange and structure in birch leaves (Betula pendula) caused by low ozone concentrations. Trees 5:5--13.
Matyssek, R., T. Keller and T. Koike. 1993. Branch growth and leaf gas exchange of Populus tremula exposed to low ozone concentra-tions throughout two growing seasons. Environ. Pollut. 79:1--7. McLaughlin, S.B. 1985. Effects of air pollution on forests: a critical
review. J. Air Pollut. Control Assoc. 35:512--534.
Mebrahtu, T. and J.W. Hanover. 1991. Leaf age effects on photosyn-thesis and stomatal conductance of black locust seedlings. Photo-synthetica 25:537--544.
Olszyk, W.M. and D.T. Tingey. 1986. Joint action of O3 and SO2 in modifying plant gas exchange. Plant Physiol. 82:401--405. Pell, E.J. 1987. Ozone toxicity----is there more than one mechanism of
action? In Effects of Atmospheric Pollutants on Forests, Wetlands, and Agricultural Ecosystems. Eds. T.C. Hutchinson and K.M. Meema. NATO ASI Series, Vol. G16, Springer-Verlag, Berlin, pp 229--240.
Pye, J.M. 1988. Impact of ozone on the growth and yield of trees: a review. J. Environ. Qual. 17:347--360.
Ratkowsky, D.A. 1983. Nonlinear regression modeling. Marcell Dek-ker Inc., New York, 276 p.
Reich, P.B. 1983. Effects of low concentrations of O3 on net
photosyn-thesis, dark respiration, and chlorophyll contents in aging hybrid poplar leaves. Plant Physiol. 73:291--296.
Reich, P.B. 1987. Quantifying plant response to ozone: a unifying theory. Tree Physiol. 3:63--91.
Reich, P.B. and J.P. Lassoie. 1985. Influence of low concentrations of ozone on growth, biomass partitioning and leaf senescence in young hybrid poplar plants. Environ. Pollut. 39:39--51.
Sasek, T.W. and C.J. Richardson. 1989. Effects of chronic doses of ozone on loblolly pine: photosynthetic characteristics in the third growing season. For. Sci. 35:745--755.
Stitt, M. 1991. Rising CO2 levels and their potential significance for
carbon flow in photosynthetic cells. Plant Cell Environ. 14:741--762.
Tschaplinski, T.J. and T.J. Blake. 1989. Photosynthetic reinvigoration of leaves following shoot decapitation and accelerated growth of coppice shoots. Physiol. Plant. 75:157--165.
Wang, D., D.F. Karnosky and F.H. Bormann. 1986. Effects of ambient ozone on the productivity of Populus tremuloides Michx. grown under field conditions. Can. J. For. Res. 16:47--55.
Wilkinson, L. 1990. SYSTAT: The system for statistics. SYSTAT Inc., Evanston, Illinois, 724 p.
Wolf, A.T., T.E. Burk and J.G Isebrands. 1995. Evaluation of sampling schemes for estimating instantaneous, whole-tree photosynthesis in