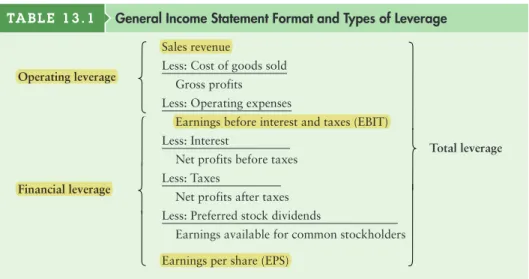
The amount of leverage in the firm's capital structure - the mix of long-term debt and equity held by the firm -. Operating leverage refers to the relationship between a firm's sales revenue and its earnings before interest and taxes (EBIT) or operating profits. Financial leverage refers to the relationship between the firm's EBIT and common stock earnings per share (EPS).
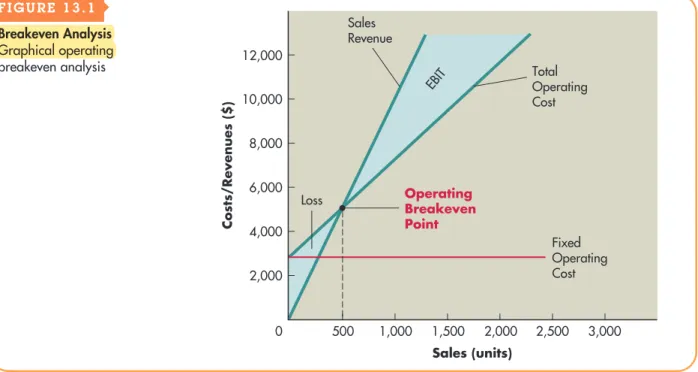
The company's operating breakeven point is the level of sales required to cover all operating costs. The company's operating breakeven point is the point at which total operating costs (the sum of fixed and variable operating costs) equal sales revenue. Operating leverage results from the existence of fixed costs that the company must pay in order to operate.
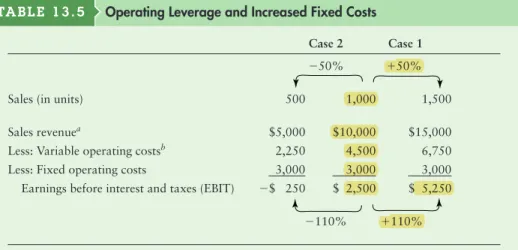
Using the structure shown in Table 13.2, we can define operating leverage as the use of fixed operating costs to magnify the effects of changes in sales on the firm's earnings before interest and taxes. Using fixed financial costs to magnify the effects of changes in earnings before interest and taxes on the firm's earnings per share. Therefore, total leverage can be seen as the total impact of fixed costs on the firm's operating and financial structure.
Using fixed costs, both operating and financial, to increase the effects of changes in sales on a company's earnings per share.
The Firm’s Capital Structure
13–5 What is the general relationship between operating leverage, financial leverage and the total leverage of the firm. In general, the more debt a firm uses, the greater will be the firm's financial leverage. The amount of leverage in the firm's capital structure can affect its value by affecting return and risk.
Those outside the firm can make a rough estimate of the capital structure using measures found in the firm's financial statements. The higher this ratio, the greater the relative amount of debt (or leverage) in the firm's capital structure. Measures of the firm's ability to meet contractual debt-related payments include the multiple of interest earned (interest EBIT) ratio and the fixed payment coverage ratio (see page 78).
Nevertheless, financial theory offers help in understanding how a firm's capital structure affects firm value. Deductibility of interest means that the cost of debt, ri, is subsidized by the state for the company. The level of business risk should be taken for granted. The greater the company's business risk, the more careful the company must be in establishing its capital structure.
When a lender provides money to a company, the interest rate is based on the lender's assessment of the company's risk. The relationship between lender and borrower therefore depends on the lender's expectations of the firm's subsequent behavior. In the context of capital structure decisions, asymmetric information simply means that firm managers have more information about the firm's operations and future prospects than do investors.
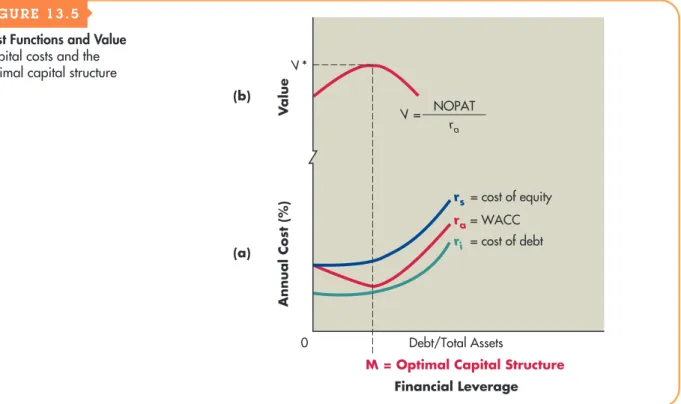
Suppose, for example, that management has information that the future prospects of the firm are very good. The weighted average cost of capital, ra, results from a weighted average of the firm's debt and equity costs. In Figure 13.5(a), point M represents the minimum weighted average cost of capital—the point of optimal financial leverage and hence the optimal capital structure for the firm.
As shown in Figure 13.5(b), at the optimal capital structure, point M, the value of the firm is maximized at V*. 13-12 How do the cost of debt, the cost of equity, and the weighted average cost of capital (WACC) behave as the firm's financial leverage increases from zero.

EBIT–EPS Approach to Capital Structure
We can plot coordinates on the EBIT-EPS graph by assuming specific EBIT values and calculating the EPS associated with them.17 Such calculations for three capital structures—debt ratios of 0%, 30%, and 60%—for the Cooke Company were presented in table 13.12. The Cooke Company data can be plotted on a set of EBIT-EPS axes, as shown in Figure 13.6. A convenient method of finding an EBIT-EPS coordinate is to calculate the financial breakeven point, the level of EBIT for which the company's EPS is only equal to $0.
This figure shows that each capital structure is superior to the others in terms of maximizing earnings per share within certain EBIT ranges. $50,000 and $95,500 EBIT, the capital structure associated with a 30% debt ratio generates higher earnings per share than either of the other two capital structures. And when EBIT exceeds $95,500, a 60% debt capital structure provides the highest earnings per share.18 Again, the intuition behind this result is fairly straightforward.
When interpreting EBIT-EPS analysis, it is important to consider the risk of each capital structure alternative. Graphically, the risk of each capital structure can be viewed in light of two criteria: (1) the break-even point (segment of the EBIT axis) and (2) the level of financial leverage, which is reflected in the slope of the capital structure line. : The higher the financial break-even point and the steeper the slope of the capital structure line, the greater the financial risk. 19. An algebraic technique can be used to find indifference points between capital structure alternatives.
This technique involves expressing each capital structure as an equation in terms of earnings per share, setting the equations for two capital structures equal and solving for the EBIT level that makes the equations equal. The degree of financial leverage (DFL) is reflected in the slope of the EBIT-EPS function. Both the financial breakeven point and the slope of the capital structure lines increase as debt ratios increase.
The capital structure for a debt ratio of 60% is riskier than for a debt ratio of 30%, which in turn is riskier than the capital structure for a debt ratio of 0%. The most important point to recognize when using EBIT-EPS analysis is that this technique tends to concentrate on maximizing earnings rather than maximizing shareholders' equity as reflected in the company's share price. To choose the best capital structure, companies must integrate both return (EPS) and risk (via the required rate of return, rs) into a valuation framework consistent with the capital structure theory presented earlier.
Choosing the Optimal Capital Structure
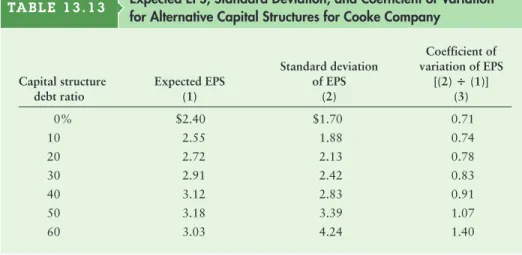
EPS coefficient of variation. from column 3 Estimated required capital structure Table 13.13) return, din. 13–14 Why EPS maximization and value maximization do not necessarily lead to the same conclusion about the optimal capital structure. A company must consider the impact of capital structure decisions on the stock's value and on the published financial statements that lenders and appraisers use to assess the company's risk.
The value of the firm is clearly affected by the degree of its operating leverage and the composition of its capital structure. Therefore, key decisions regarding operating cost structure and capital structure should focus on their impact on firm value. The firm should implement only those leverage and capital structure decisions that are consistent with its goal of maximizing stock price.
Describe types of capital, external evaluation of capital structure, capital structure of non-U.S. Research suggests that there is an optimal capital structure that balances the firm's benefits and the costs of debt financing. Graphically, the firm's WACC exhibits a U-shape, the minimum value of which determines the optimal capital structure that maximizes owner wealth.
Discuss the EBIT–EPS approach to capital structure. The VVRB–EPP approach evaluates capital structures in light of the returns they provide to the firm's owners and their degree of financial risk. Under the EBIT-EPS approach, the preferred capital structure is the one expected to provide maximum EPS over the firm's expected range of EBITDA. Calculate the firm's earnings per share (EPS) in tabular form at (1) the current level of sales and (2) a 120,000-unit sales level.
Using the current sales level of $750,000 as a baseline, calculate the company's degree of operating leverage (DOL). Determine the optimal capital structure based on (1) maximizing expected earnings per share and (2) maximization of share value. P13–12 Degree of Financial Leverage Northwestern Savings and Loan has a current capital structure consisting of $250,000 of 16% (annual interest) debt and 2,000 shares of common stock.
The existing capital structure consists of 25,000 shares of common stock having a book value of $10 per share. The company is considering changing its capital structure by replacing debt in the capital structure with common stock.