EFFECTS OF MUTATING CTRA-BINDING SITES WITHIN THE PILA PROMOTER OF CAULOBACTER CRESCENTUS
by Sarah Chong
A thesis submitted to the faculty of The University of Mississippi in partial fulfillment of the requirements of the Sally McDonnell Barksdale Honors College.
Oxford May 2017
Approved by
___________________________________
Advisor: Professor Patrick Curtis
___________________________________
Reader: Professor Wayne Gray
___________________________________
Reader: Professor Colin Jackson
ii
© 2017 Sarah Chong
ALL RIGHTS RESERVED
iii ABSTRACT
This project investigated the regulation of pilA by the global transcriptional regulator CtrA in the dimorphic bacterium Caulobacter crescentus. The pilA gene encodes the pilin subunits which are polymerized into helical filaments to produce pili, and the gene is directly activated by CtrA such that filaments are produced after cell separation. The pilA promoter harbors three regions that have been shown to bind CtrA (Binding Regions 1, 2, and 3), and multiple CtrA recognition sites are found in these regions, which is unusual for CtrA-dependent promoters. However, none of the binding sites match the CtrA consensus binding sequence. The canonical CtrA recognition sequence most closely matches the DNA sequence of Binding Region 1, and it is at relative variance with the sequences of Binding Regions 2 and 3. To examine the role of different binding sites in pilA activation, different pilA-lacZ constructs bearing isolated or combined binding region sites within the pilA promoter were introduced to C. crescentus.
Ligation reactions were implemented to join novel pilA promoter constructs with cleaved reporter vectors (plac290). Heat shock methods were used to transform Escherichia coli with putative pilA-lacZ constructs, and electroporation was used to clone pilA-lacZ vectors into C. crescentus cultures. Beta-galactosidase assays were implemented to measure the strength of the novel pilA promoters in transgenic C. crescentus cells. My results demonstrate that the CtrA binding region bearing the binding site that is closest to the consensus sequence (Binding Region 1) barely induces pilA expression, and the pairing of this region with Binding Region 2 (whose binding sites are far from consensus)
iv
augments pilA expression - by more than twenty-fold - to levels which are characteristic of wild type. In addition, my results reveal that (1) the absence of Binding Region 3 enacts no effect on the intensity of pilA expression and (2) Binding Region 2 alone is not sufficient to induce significant pilA expression. In conclusion, my research indicates that the orchestration of multiple binding regions is necessary for effective transcription of pilA.
v
TABLE OF CONTENTS
LIST OF TABLES/FIGURES...vi
LIST OF ABBREVIATIONS………..………...…..viii
INTRODUCTION ...1
METHODS ...6
RESULTS...13
DISCUSSION...23
CONCLUSION………...26
REFERENCES...27
vi
LIST OF TABLES/FIGURES
Figure 1: Life cycle of Caulobacter crescentus (Curtis, 2010)…………..……….2 Figure 2: Architecture of the pilA promoter………..…………..4 Figure 3: Architecture of initial promoter constructs (BR1, BR1&2, and BR1&2&3)………...7 Figure 4: Architecture of promoters constructed to investigate the roles of Binding Region 2 and
Binding Region 1………8 Figure 5a: PCR confirmation of a ligation reaction between plac290 and BR1 (Lane 9), as well as between plac290 and BR1&2 (Lane 5)………..14 Figure 5b: PCR confirmation of a ligation reaction between plac290 and BR1&2::1 (Lane 5) and
a ligation reaction between plac290 and BR2 (Lane 9)...……….15 Figure 6: Mean beta-galactosidase activity by pilA-lacZ constructs in Caulobacter
crescentus...21 Figure 7: Mean enzymatic activity by the promoter construct BR1&2::1 and by the construct
BR1&2……….22 Table 1: Measurement of beta-galactosidase activity in pilA-lacZ constructs harboring all three
CtrA-binding regions………16 Table 2: Measurement of beta-galactosidase activity in pilA-lacZ constructs bearing Binding
Regions 1 and 2………17 Table 3: Measurement of beta-galactosidase activity in pilA-lacZ constructs bearing only
Binding Region 1………..18 Table 4: Control measurement of beta-galactosidase activity in plac290 vectors……….18 Table 5: Measurement of beta-galactosidase activity in pilA-lacZ constructs bearing Binding
Regions 1 and 2, with a knockout of the first CtrA-binding half-site within Binding Region 2………19 Table 6: Measurement of beta-galactosidase activity in pilA-lacZ constructs bearing only
vii
Binding Region 2………..20
viii
LIST OF ABBREVIATIONS
BR1 pilA-lacZ construct bearing Binding Region 1
BR1* pilA-lacZ construct bearing the canonical Binding Region 1 sequence
BR1&2 pilA-lacZ construct bearing Binding Regions 1 and 2 BR1&2&3 pilA-lacZ construct bearing Binding Regions 1, 2, and 3 BR1&2::1 pilA-lacZ construct bearing Binding Regions 1 and 2, with a
mutation in the first CtrA-binding site within Binding Region 2 BR1&2::2 pilA-lacZ construct bearing Binding Regions 1 and 2, with a
mutation in the second CtrA-binding site within Binding Region 2 BR1&2::1,2 pilA-lacZ construct bearing Binding Regions 1 and 2, with
mutations in both CtrA-binding sites within Binding Region 2
1 Introduction:
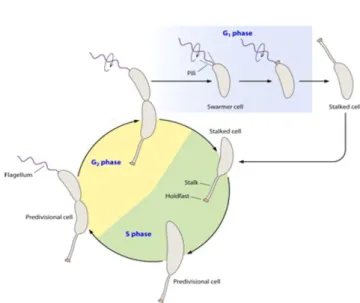
Caulobacter crescentus is an asymmetrically dividing Gram-negative
alphaproteobacterium, whose genetic programs for the regulation of asymmetric division and cell differentiation render the organism an important model developmental organism (Curtis, 2010). C. crescentus cells are crescent-shaped cells with morphologically
distinctive polar appendages (Figure 1). The progenitor cell is characterized by a stalk, an elongated membranous appendage whose tip contains an adhesive organelle that allows the cell to attach to surfaces (Cutis, 2010). The asymmetric localization of proteins imparts asymmetric morphologies to the two compartments of the prospective daughter cells. As the cell grows, it produces a flagellum on the pole opposite the stalk, and after dividing yields two morphologically dissimilar daughter cells: (1) a stalked cell, and (2) a piliated/flagellated “swarmer” cell. Later in the swarmer cell’s lifetime, the motile
swarmer cell differentiates into a stalked cell by retracting its pili, ejecting its flagellum to the surrounding environment, and producing a stalk at the previously piliated pole.
In C. crescentus, pilA encodes the major pilin subunit of pili, which are helical filaments that are specific to swarmer cells. The pili of C. crescentus are Flp-type pili (which are structurally similar to Type IV pili), and they promote surface adhesion properties of swarmer cells (Bodenmiller et. al, 2004). Whereas genes for the basal bodies of pili are expressed in the late predivisional stage, genes encoding encoding pilin subunits are expressed after cell separation (Skerker, 2000). As a result, predivisional cells are primed to produce pili, but the pilus filament is extruded only after cell
2 separation has occurred.
Figure 1:Life cycle of Caulobacter crescentus (Curtis, 2010)
Concerning pilA regulation by the global response regulator CtrA, previous experiments demonstrated that CtrA plays a crucial role in the regulation of pilA
transcription. Decreases in intracellular CtrA levels greatly reduce the transcription level of pilA (Curtis et. al, 2013). What is unusual is that the pilA gene is expressed later in the cell cycle than other CtrA-dependent genes. The results of previous experiments indicate that the cell uses pilA expression as a timing mechanism to delay pilin polymerization until the finalization of a developmental event (i.e., cell separation). Additionally, evidence reveals that a constitutive expression of pilin subunits can induce pilin subunits to polymerize earlier than at the normal stage which follows cell separation (Skerker, 2000).
In C. crescentus, pilus synthesis involves two regulatory processes. The genetic program of C. crescentus may be unique in its role of expressing pili and basal bodies at different stages of the cell cycle. For example, pilus expression is constitutive in
3
Myxococcus xanthus (Wu et al, 1997; Jakobsen et al, 2004). Accordingly, it is important to investigate the purposeful timing mechanisms of pilA expression.
Clearly the timing of pilA expression is deliberate, but how is it achieved? While pilA gene expression is severely impacted by experimental reduction in CtrA levels, the same reduction has little to no effect on several CtrA-dependent promoters of essential - cell-cycle genes. However, the promoters of those genes typically have a single CtrA binding site that closely matches the consensus sequence. One could presume that a gene under control of a transcriptional activator should be close to consensus, as it is widely regarded that a consensus sequence confers the strongest binding affinity between DNA and a binding protein. However, the CtrA binding sites of pilA deviate from consensus, yet these deviations are clearly serviceable in that pili are produced. Is it possible that these deviated binding sequences play a role in the timing of expression?
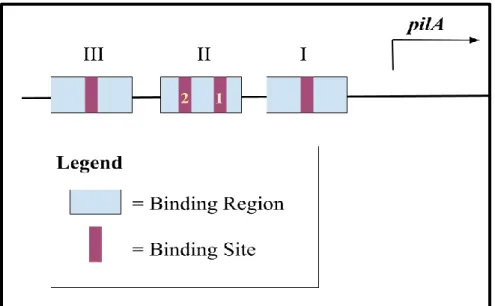
Previous DNA footprinting experiments by Skerker et al. (2000) showed that CtrA binds to three binding regions within the pilA promoter. A binding region has been shown to contain binding sites whose DNA sequences match the binding sequence of CtrA. Four putative CtrA binding sites can be found in these three regions. Binding Region 1 contains one binding site, Binding Region 2 contains two binding sites, and Binding Region 3 contains one binding site (Figure 2a). The consensus CtrA recognition sequence (TTAA-N7-TTAA) most closely matches that of the Region 1 binding site (TTTA-N7-TTAA), and it exists at further variance with those of the binding sites within Region 2 (TTAA-N6-ATAA, TAAA-N6-TAAA) and Region 3 (TCAA-N8-TAAA).
Skerker et al. (2000) and Curtis et al. (2013) propose that the orchestration of multiple weak binding regions is necessary for the transcription of pilA. What’s more, such an
4
intricate regulation of pilA activation provides an explanation for the pilA promoter’s sensitivity to intracellular CtrA levels (Curtis et al., 2013).
Figure 2: Architecture of the pilA promoter. Three CtrA binding regions harbor four binding sites within the promoter. Binding Region I contains one binding site, Binding Region II contains two binding sites, and Binding Region III contains one binding site.
To examine whether the presence of multiple potentially-weak binding regions indeed facilitates pilA activation, different pilA-lacZ constructs were introduced to C.
crescentus cells to measure pilA gene expression (Figure 3). As is widely regarded, a deviance from the consensus sequence leads to weaker binding between the
transcriptional regulator and DNA. Therefore, we can predict that sequences that are deviant from consensus are weak binding sequences.
My initial transcriptional assays revealed that the absence of Binding Region 3 enacts no substantial effect on the intensity of pilA expression in C. crescentus. Even more, my assays demonstrate that the CtrA binding region bearing the binding site that is closest to the consensus sequence barely induces pilA activation, and the pairing of this
5
region with Binding Region 2 (whose binding sites are far from consensus) augments pilA expression - by more than twenty-fold - to levels which are characteristic of wild type C. crescentus. As these results indicate that the CtrA-binding Region 2 plays a significant role in inducing near wild type transcription levels of pilA, the role of Binding Region 2 and its architecture in regulating pilA expression required further investigation.
All in all, my results support the hypothesis that the orchestration of weak binding regions enhances the transcription of pilA such that pilus production occurs after the predivisional cell has separated. In this study, I tested the effects of mutating deviant CtrA-binding sites in the pilA promoter to investigate the roles of the deviant binding sites in pilA expression.
6 Methods
Primer Synthesis
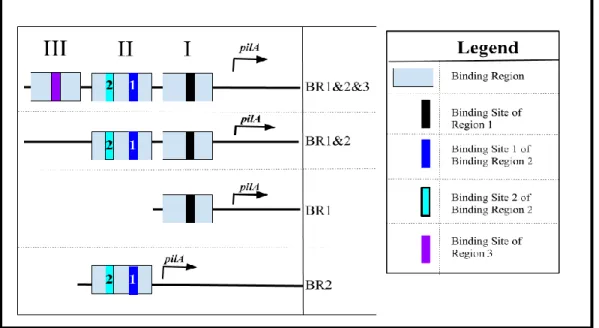
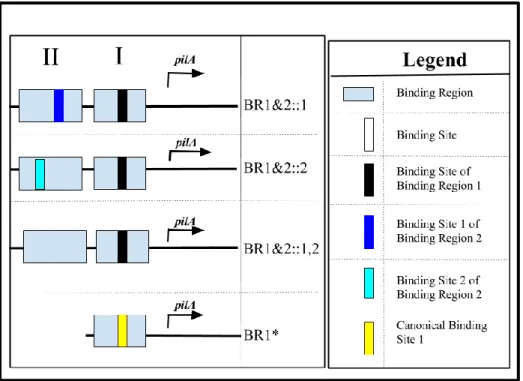
Forward and reverse primers were designed for the synthesis of pilA promoters bearing differential binding region half-sites. The following pilA constructs are listed as sequences harboring solitary or combined binding region half-sites: BR1 (Binding Region 1), BR1* (Canonical Binding Region 1), BR1&2 (Binding Regions 1 and 2), BR1&2::1,2 (Binding Regions 1 and 2, without either Region 2 sites), BR1&2::1
(Binding Regions 1 and 2, without the first Region 2 site), BR1&2::2 (Binding Regions 1 and 2, without the second Region 2 site), BR2 (Binding Region 2), and BR1&2&3.
Figures 3 and 4 portray the architecture of these different constructs.
In the constructs where binding sites were removed from binding regions, both TTAA half-sites were mutated by the substitution of the sequence “GGCC.” In the BR1*
promoter sequence, the half-site sequence “TTTA” was substituted by the canonical sequence “TTAA.” Oligonucleotides were synthesized by Eurofins Genomics. To clone these constructs, two complementary single-stranded sequences encoding the desired promoter sequences were designed. Oligonucleotides (single-stranded sequences) encoding complementary sequences of each pilA promoter were annealed to one another to form a double-stranded promoter construct and were designed such that after annealing overhangs matching the sticky end sequences of desired restriction endonucleases were formed. Following the dilution of each forward and reverse primer set with double-
7
distilled water to concentrations of 10-2 and 10-3 mM, the forward and reverse primers for each promoter construct were annealed to each other inside PCR tubes at five consecutive 30-second intervals of different temperatures (at 98oC, 80o C, 60o C, 40o C, and 20o C) via heating applications inside Thermocyclers.
Figure 3: Architecture of initial promoter constructs (BR1, BR1&2, and BR1&2&3).
The promoter construct BR1&2&3 bears Binding Regions 1 through 3, the construct BR1&2 bears Binding Regions 1 and 2, and the construct BR1 contains Binding Region 1. Binding Region contains one binding site, Binding Region 2 contains two binding sites (Binding Sites 1 and 2), and Binding Region 3 contains one binding site.
8
Figure 4: Architecture of promoters constructed to investigate the roles of Binding Region 2 and Binding Region 1. Each horizontal rectangle represents a binding region, and each blank vertical rectangle represents a binding site. Binding Region 1 bears one binding site, and Binding Region 2 contains two binding sites. The promoter construct BR1&2::1 bears only the second binding site of Binding Region 2, the construct BR1&2::2 bears only the first binding site of Region 2, and BR1&2::1,2 lacks both binding sites of Region 2. The construct BR2 contains Binding Region 2 and both binding sites of the Region. BR1* contains one binding region whose binding site sequence has been replaced by the canonical CtrA binding sequence.
Creation of pilA-lacZ constructs
Restriction endonucleases EcoRI and HindIII were used to cut the reporter plasmid plac290. In addition to bearing a gene that confers resistance to tetracycline, plac290 harbors endonuclease restriction sites, an origin of replication, and the reporter gene lacZ. The lacZ gene has no promoter but does have a ribosome binding site. A plasmid purification kit was used to isolate plac290 from E. coli cells. Gel
electrophoresis was used to confirm the sizes of putative plac290 samples. To cleave plac290 at specific EcoRI and HindIII sites, plac290 (300 ng) was treated with CutSmart
9
Buffer, EcoRI, and HindIII. The reaction occurred at 37oC for three hours, and alternatively, at room-temperature for 12 to 18 hours. To inactivate the restriction
enzymes, the cleaved plasmid vector mixtures were incubated for 25 minutes at 80oC in a thermocycler.
To covalently join each pilA promoter construct (e.g. BR1, or BR1&2) with cleaved plasmid vectors, each promoter construct was mixed with cleaved plac290, T4 DNA ligase and ligation buffer These mixtures were incubated for 24 hours.
Transformation of E. coli cells
Heat shock was used to introduce the recombinant plasmids which were constructed as described in the “Primer Synthesis” section, as well as the pilA-lacZ construct bearing all three regions, which was published previously, to E. coli cells (Skerker, 2000). A pipette was used to transfer calcium-competent E. coli cells to each ligation mixture (pilA-lacZ) in separate round bottom tubes. The tubes were incubated on ice for 30 minutes and immediately submerged in a warm water bath (42oC) for 45 seconds. After these tubes were incubated on ice for an additional 2 minutes, 1 mL of Luria-Bertani medium (LB) was added to each tube prior to 1 hour of incubation at 37oC.
Transformed E. coli cells were grown on a selective medium (LB with tetracycline) to select for cells that harbor the desired plasmid vectors. Plates were incubated at 37oC for 24 hours.
To confirm that the cells of visible E. coli colonies harbor the desired plasmid vectors, polymerase chain reaction was used to amplify the unique insertion regions of these plasmid vectors. Visible colonies were cultured in glass tubes containing liquid LB and tetracycline. A plasmid purification kit was used to isolate plasmids from liquid
10
cultures of transformed E. coli cells. Isolated plasmids were each used in PCR reactions with a construct specific primer and/or plac290 specific primers. Gel electrophoresis was used to separate the PCR products (i.e. amplified DNA regions of isolated plasmids) by size. To determine the sizes of these amplified DNA fragments, the band separations of a molecular ladder were used as a reference for measurement. For PCR confirmations which use promoter-specific forward primers, a successful insertion is indicated by a single band that is smaller than 250 bp. Unsuccessful insertions are indicated by an absence of bands, as this indicates that the forward primer did not anneal to a promoter sequence (as representative of empty vectors). In PCR confirmations which use plasmid- specific forward and reverse primers, successful insertions are indicated by bands which are larger than the control (plac290) band of 250 bp.
To confirm that C. crescentus cells had undergone successful transformations, the transformed cells were cultured on LB plates with tetracycline, and viable colonies were grown in liquid cultures of LB and tetracycline. This method selects for cells which have incorporated the tetracycline-resistance gene of the plac290 plasmid.
Electroporation
Aliquots (1 ml) of the liquid culture of C. crescentus NA1000 were transferred to Eppendorf tubes. Following centrifugation and discarding of the supernatant, a pipette was used to mix the cells with 1 ml sterile water, followed by centrifugation and
supernatant removal. This washing procedure was repeated twice, and washed cells were resuspended in 50 μl sterile water. Plasmid constructs were then added to prepared cells.
A pipette was used to transfer each cell sample to the crevices of electroporation cuvettes. Transformations were performed by a GenePulser X-cell machine.
11
Electroporation conditions include a voltage of 1500 V, a capacitance of 25 μF, and a resistance of 400 Ω.
PYE broth was added to the cuvettes containing transformed C. crescentus cells.
A pipette was used to transfer cells from each cuvette to a new round bottom tube. Round bottom tubes were incubated for 3 hours at 30oC, and a pipette was used to transfer 100 µl of the samples to a plate containing LB and tetracycline. The cells were grown on PYE agar plates containing tetracycline to select for cells that harbor the desired vectors.
To further confirm that the C. crescentus cells harbor desired vectors, PCR was performed to amplify regions of the cells’ plasmids. Gel electrophoresis was performed to separate the PCR products of PCR by size. DNA sequencing results confirm that the pilA-lacZ vectors for the DNA constructs contain the desired binding regions.
Culturing triplicates of triplicates
In preparation for beta-galactosidase assays, triplicate cultures were made for each of the following samples of transformed Caulobacter cells: plac290-lacZ, wildtype pilA-lacZ, BR1-lacZ, BR1&2-lacZ, BR2-lacZ, and BR1&2::1-lacZ. Following incubation, triplicate cultures were made from each initial triplicate. To achieve optimal optical density (.05-.08 Abs), 100 µl aliquots were transferred from each initial triplicate culture and diluted with 9 milliliters of PYE broth. A subset of triplicates were made each diluted sample of initial triplicates. 5 µl of each diluted initial triplicate culture was transferred to three new tubes containing PYE (3 mL) and tetracycline (.75 µl). In total, nine tubes were made from each sample of transformed C. crescentus cells.
12 Beta-galactosidase assay
50 µl of chloroform and 750 µl of Z-buffer were transferred to every 50-µl aliquot of all triplicates of triplicate cultures. Following vigorous shaking (vortexing for 5
seconds), each tube was incubated for 5 minutes at 30oC. Ortho-Nitrophenyl-β-
galactoside (4 mg/mL) was added to each tube. Following vigorous shaking (vortexing for 1 second), each tube was set on a tube rack. To end the activity of Beta-galactosidase, a stop solution (400 µl) was added at the time of such colorization or by the end of fifteen minutes.
A Nanodrop spectrophotometer was used to measure the absorbance (A420) of yellow o-nitrophenol for each sample. Following the addition of the stop solution, each sample was centrifuged for 5 minutes at 15.00 min/g. 2 µl of the supernatant was transferred onto the Nanodrop spectrophotometer.
13 Results:
Presumptive insertions of the following pilA promoter constructs within plac290 are indicated by band sizes of DNA extracted from viable E. coli colonies, following transformations with ligation mixtures containing digested vectors (plac290) and diluted pilA promoter constructs: BR1&2 (Figure 5a, lane 5), BR1 (Figure 5a; lane 9), BR2 (Figure 5b, lane 4), and BR1&2::1 (Figure 5b, lane 9).
PCR confirmations utilized the reverse primer plac290R and a promoter-specific forward primer to amplify BR1&2 and BR1 (Figure 5a). A successful insertion is indicated by a single band that is smaller than 250 bp. Unsuccessful insertions are
indicated by an absence of bands (as representative of empty vectors). In Lanes 5 and 9, a single band appears beneath the 250 bp marker, indicating that the promoter-specific primer annealed to the promoter (Figure 5a). These two bands are not present in lanes containing putative BR1&2 and BR1 vector samples, whose multiple heavier bands may have been the result of genomic DNA contamination during plasmid extraction from E.
coli (Figure 5a).
14
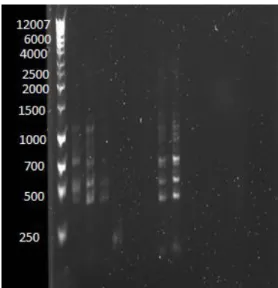
Figure 5a: PCR confirmation of a ligation reaction between plac290 and BR1 (Lane 9), as well as between plac290 and BR1&2 (Lane 5). PCR confirmations utilizing the reverse primer plac290R and a promoter-specific forward primer, were loaded in the following lanes: Lane 1 (ladder), Lane 2 (BR1&2 colony 1), Lane 3 (BR1&2 colony 2), Lane 4 (BR1&2 colony 3), Lane 5 (BR1&2 colony 4), Lane 6 (control: plac290 + BR1&2F primer), Lane 7(control: plac290 + BR1F primer), Lane 8 (BR1 colony 1), Lane 9 (BR1 colony 2). Bands containing control plac290 samples (Lanes 6 and 7) that received treatments with the promoter-specific constructs for BR1 and BR1&2 are not visible.
In PCR confirmations that show the successful insertion of BR2 and BR1&2::1 (Figure 5b), DNA samples were treated with plasmid-specific primers (plac290R and plac290conf). Whereas bands that are bigger than 250 bp (the size of the plac2900 band) indicate unsuccessful insertions, a band shows a successful insertion if it is larger than the control vector band, which appears at 250 bp in Lane 10. In Lanes 5 and 9, the bands for samples of BR2 and BR2::1,2 are larger than the control band.
15
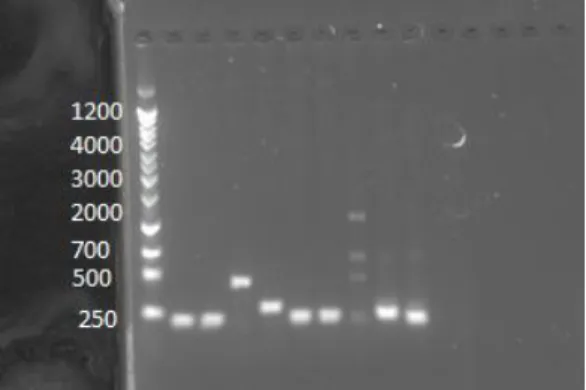
Figure 5b: PCR confirmation of a ligation reaction between plac290 and BR1&2::1 (Lane 5) and a ligation reaction between plac290 and BR2 (Lane 9). PCR confirmations utilizing the reverse primer plac290R and forward primers that are also plasmid-specific, were loaded in the following lanes: Lane 1 (ladder), Lane 2 (BR1&2::1,2), Lane
3(BR1&2::1,2), Lane 4 (BR1&2::1), Lane 5 (BR1&2::1), Lane 6 (BR1&2::2), Lane 7 (BR1&2::2), Lane 8 (BR2), Lane 9 (BR2), and Lane 10 (plac290).
The beta-galactosidase activities in triplicates of triplicates of cultures bearing all six pilA-lacZ constructs, which are summarized in Figures 5a and 5b, were measured (Tables 1-6).
16
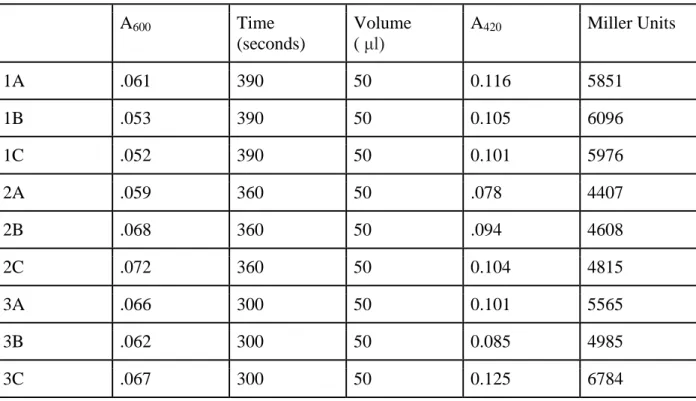
Table 1: Measurement of beta-galactosidase activity in pilA-lacZ constructs harboring all three CtrA-binding regions. A600 indicates the optical density prior to the enzymatic assay, A420 indicates absorbance of O-nitrophenol. The time at which O-nitrophenol hydrolyzation occurs after ONPG treatment is reported in seconds, and the volume of cell cultures used per trial is reported in microliters. Enzymatic activity is represented by Miller Units, which were calculated by the following formula: Miller Units =
(1000*A420)/(A600 * volume * time).
A600 Time
(seconds)
Volume ( μl)
A420 Miller Units
1A .061 390 50 0.116 5851
1B .053 390 50 0.105 6096
1C .052 390 50 0.101 5976
2A .059 360 50 .078 4407
2B .068 360 50 .094 4608
2C .072 360 50 0.104 4815
3A .066 300 50 0.101 5565
3B .062 300 50 0.085 4985
3C .067 300 50 0.125 6784
17
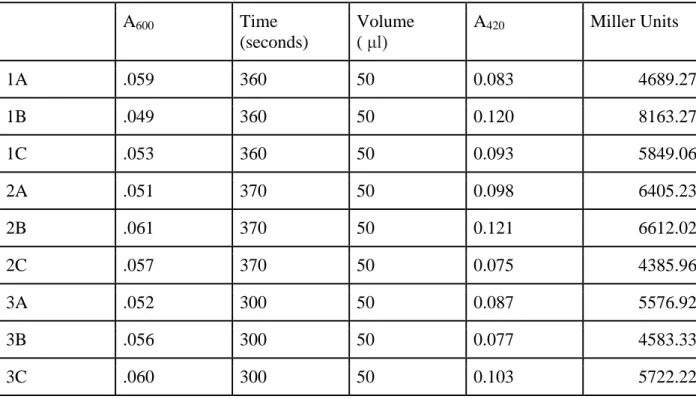
Table 2: Measurement of beta-galactosidase activity in pilA-lacZ constructs bearing Binding Regions 1 and 2. A600 indicates the optical density prior to the enzymatic assay, A420 indicates absorbance of O-nitrophenol. The time at which O-nitrophenol
hydrolyzation occurs after ONPG treatment is reported in seconds, and the volume of cell cultures used per trial is reported in microliters. Enzymatic activity is represented by Miller Units, which were calculated by the following formula: Miller Units =
(1000*A420)/(A600 * volume * time).
A600 Time
(seconds)
Volume ( μl)
A420 Miller Units
1A .059 360 50 0.083 4689.27
1B .049 360 50 0.120 8163.27
1C .053 360 50 0.093 5849.06
2A .051 370 50 0.098 6405.23
2B .061 370 50 0.121 6612.02
2C .057 370 50 0.075 4385.96
3A .052 300 50 0.087 5576.92
3B .056 300 50 0.077 4583.33
3C .060 300 50 0.103 5722.22
18
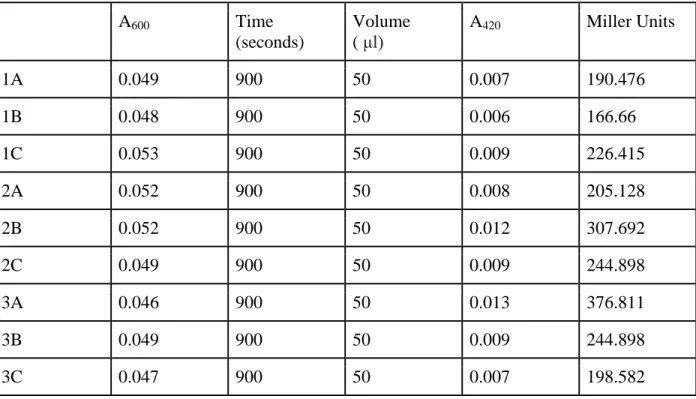
Table 3: Measurement of beta-galactosidase activity in pilA-lacZ constructs bearing only Binding Region 1.
A600 Time
(seconds)
Volume ( μl)
A420 Miller Units
1A 0.049 900 50 0.007 190.476
1B 0.048 900 50 0.006 166.66
1C 0.053 900 50 0.009 226.415
2A 0.052 900 50 0.008 205.128
2B 0.052 900 50 0.012 307.692
2C 0.049 900 50 0.009 244.898
3A 0.046 900 50 0.013 376.811
3B 0.049 900 50 0.009 244.898
3C 0.047 900 50 0.007 198.582
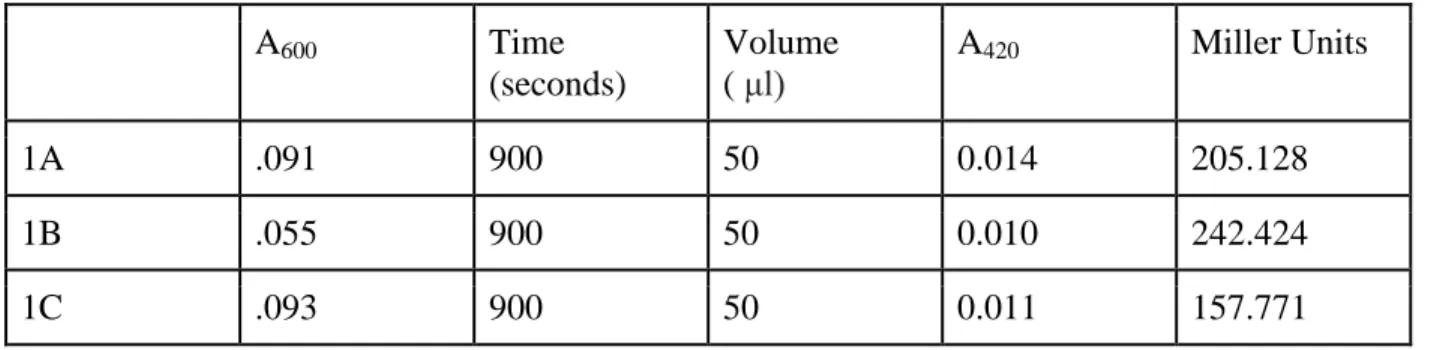
Table 4: Control measurement of beta-galactosidase activity in plac290 vectors.
A600 Time
(seconds)
Volume ( μl)
A420 Miller Units
1A .091 900 50 0.014 205.128
1B .055 900 50 0.010 242.424
1C .093 900 50 0.011 157.771
19
Table 5: Measurement of beta-galactosidase activity in pilA-lacZ constructs bearing Binding Regions 1 and 2, with a knockout of the first CtrA-binding half-site within Binding Region 2.
A600 Time
(seconds)
Volume ( μl)
A420 Miller Units
1A 0.222 420 50 0.051 12437
1B 0.214 420 50 0.051 11989
1C 0.214 420 50 0.049 12478
2A 0.216 420 50 0.052 11969
2B 0.243 420 50 0.051 13613
2C 0.239 420 50 0.058 11773
3A 0.246 420 50 0.061 11522
3B 0.229 420 50 0.058 11281
3C 0.251 420 50 0.060 11952
20
Table 6: Measurement of beta-galactosidase activity in pilA-lacZ constructs bearing only Binding Region 2.
A600 Time
(seconds)
Volume ( μl)
A420 Miller Units
1A .083 900 50 0.05 803
1B 0.036 900 50 0.03 1111
1C 0.062 900 50 0.09 1935
2A 0.087 900 50 0.04 613
2B 0.060 900 50 0.07 11556
2C 0.081 900 50 0.06 988
3A 0.072 900 50 0.09 1667
3B 0.078 900 50 0.06 1026
3C 0.075 900 50 0.04 711
Beta-galactosidase assays demonstrate that pilA promoters which bear both the binding regions 1 and 2 (as in BR1&2 and BR1&2&3) activate similar levels of gene expression. This finding implicates that Binding Region 3 confers negligible activity to pilA expression. In addition, transcriptional assays reveal that Binding Region 1 alone barely activates pilA, and the intensity of lacZ expression in BR1 cultures is similar to that of control vectors (plac290). Binding Region 2 alone, despite the fact that it is not the most proximal binding region to the transcriptional start site, activates greater pilA
expression levels than does Binding Region 1, and the paired presence of Binding Regions 1 and 2 enhances pilA expression by more than twenty-fold. Mean lacZ
expression levels for each promoter are recorded in Miller Units as follows in ascending
21
order: 201.77 (plac290), 240.17 (BR1), 2267.78 (BR2), 5776.36 (BR1&2), and 5454.11 (BR1&2&3) (Figure 6).
Figure 6: Mean beta-galactosidase activity by pilA-lacZ constructs in Caulobacter crescentus. Beta-galactosidase assays were performed to test lacZ expression levels by different pilA promoters (BR1&2&3, BR1&2, BR2, and BR1). The vector plac290 was assayed as a control.
The mean enzymatic activity of the BR1&2::1 promoter is higher than that of both the BR1&2 promoter and the control vector plac290 (Figure 7). BR1&2::1 elicits a higher level of expression among all the promoter constructs. In addition, the lacZ expression level of BR1&2::1 (12112.67 Miller Units) more than doubles that of BR1&2 (5776.36 Miller Units).
22
Figure 7: Mean enzymatic activity by the promoter construct BR1&2::1 and by the construct BR1&2. The average enzymatic activity of BR1&2::1 (11585 Miller Units) is higher than that of BR1&2 (5454.11 Miller Units). The average enzymatic activity of the control vector plac290 is 201.77 Miller Units.
23 Discussion
My hypothesis that the orchestration of weak binding regions facilitates the delayed expression of pilA is supported by the findings that (1) constructs bearing both Binding Regions 1 and 2 cause expression levels similar to those of wildtype pilA-lacZ constructs and (2) constructs bearing only Region 1 cause pilA expression levels that are comparable to pilA expression when no CtrA-binding regions are present at all.
The fact that pilA promoters bearing binding regions 1 and 2 exhibit similar lacZ expression levels as the promoter bearing binding regions 1,2 and 3 (i.e. the wild-type promoter) indicates that Binding Region 3 confers negligible activity to pilA expression even though previous work showed that CtrA binds to this region (Skerker, 2000). Moreover, the finding that the near wild-type expression of pilA is observed in the Binding Region 1 and 2 construct while Binding Region 1 alone showed negligible expression indicates that the CtrA-binding Region 2 plays a significant role in pilA transcription. Interestingly, as the values of lacZ expression levels from the BR2
construct (1,200 Miller Units) and the BR1 construct (240 Miller Units) do not add to the value of expression which is observed when Binding Regions 1 and 2 are co-present (5776 Miller Units), this finding shows that Binding Region 1 and Binding Region 2 do not have a simple additive effect on pilA expression.
The finding that Binding Region 2 is necessary for wild-type expression of pilA was surprising, given that the CtrA binding site in Region 1 is very close to the consensus CtrA binding sequence. The CtrA consensus sequence is TTAA-N7-TTAA, while the
24
binding site in Region 1 is TTTA-N7-TTAA (Skerker et al, 2000). Therefore it was possible that the other binding regions were not necessary for wild-type transcription, but this work shows that is not the case. It appears that the single base-pair deviation may strongly impact transcription. Cloning experiments are underway to test the hypothesis that an utterly canonical sequence can impart stronger pilA activation than exhibited in our initial assays by substituting the deviant half-site sequence of Binding Region 1 (TTTA) with the canonical half-site sequence (TTAA).
In addition, the finding that a mutation in Binding Site 1 causes an increase in lacZ expression conflicted with our predictions. I initially predicted that, if a mutation of Binding Site 1 should decrease the binding affinity between Binding Site 1 and CtrA, it would follow that a mutation in Binding Site 1 would either cause a decrease or no effect at all on pilA expression levels. That is to say, I hypothesized that either (1) a decrease would result if this binding site plays an important function in pilA expression, or (2) no effect would result if this binding site does not have a significant role in pilA expression.
Contrary to my predictions, however, a mutation in Binding Site 1 caused an increase in lacZ expression.
These experiments show that pilA has an expression mechanism which requires multiple binding regions, as well as a binding region that contains multiple binding sites, for maximal expression. If these multiple binding regions work together as a delaying mechanism, it is important to answer why CtrA regulates the timing of pilA expression such that cell separation occurs prior to the developmental event of pilus extrusion. A possible answer to explain this phenomenon is that the surface adhesion features of pili impair a predivisional cell’s motility (Curtis, 2010). Moreover, a premature extrusion of
25
pili in predivisional cells could increase the predivisional parent cell’s susceptibility to infections by pili-tropic bacteriophages (Curtis, 2010). To explain, phages that enter the cell will spread throughout the cell’s cytoplasm. An infection that occurs before cell separation kills both prospective cells of a predivisional cell. Delaying pilus assembly until cell compartmentalization has occurred restricts any infection by pili-using phage to the daughter swarmer cell and therefore protects the daughter stalked cell from infection, saving one of the two lineages. Thus, pilus regulation of C. crescentus serves as an example by which phages influence microbial evolution.
Concerning future research, cloning experiments are also underway to investigate the functions of binding sites within Region 2. I have already shown that mutation of the first binding site in this region strangely increases expression, suggesting an inhibitory role to this CtrA binding site in the pilA promoter. I have designed and begun cloning constructs where the second binding site and both binding sites have been mutated.
These results can offer insights to into pilA regulation by CtrA cooperation at distinct binding sites within Binding Region 2. My work has focused on levels of gene
expression, but timing of expression is also important to this system. To further examine the timing mechanism of pilA with respect to cell cycle progression, future research should implement cell synchrony assays to measure pilA expression levels at specific stages of the cell cycle.
26 Conclusion:
All in all, my results demonstrate that certain binding sites within the pilA promoter are necessary for effective pilA expression. My preliminary findings revealed that (1) the putatively strongest CtrA Binding Region barely induces pilA expression, (2) its pairing with the weaker Binding Region 2 significantly enhances pilA expression levels, and (3) Binding Region 3 enacts a marginal role in pilA expression. My
subsequent investigation into Binding Region 2 revealed that (i) Binding Region 2 alone induces slightly higher pilA expression than does Binding Region 1 alone, and (ii) the mutation of the first binding site within Binding Region 2 elicits pilA expression levels that double those exhibited in wild type cells. While the functions of the binding sites within Binding Region 2 require further investigation, my results lend support to the hypothesis that the orchestration of multiple binding regions is necessary for effective transcription of pilA.
27 List of References:
[1] Curtis, P.D., Klein, D. and Brun, Y.V. "Effect of a CtrA Promoter Mutation, Causing a Reduction in CtrA Abundance, on the Cell Cycle and Development of
Caulobacter crescentus." BMC Microbiology. 13:7-9. (2013)
[2] Skerker, J. M. and Shapiro, L. "Identification and Cell Cycle Control of a Novel Pilus System in Caulobacter crescentus." The EMBO Journal. 19:3227-3231. (2000) [3] Curtis, P.D. and Brun, Y.V. “Getting in the loop: regulation of development in
Caulobacter crescentus.” Microbiol Mol Biol Review. 74:13-27. (2010) [4] Bodenmiller, D., Toh, E., and Brun, Y.V. “Development of Surface Adhesion in
Caulobacter Crescentus.” Journal of Bacteriology. 186:1438. (2004) [5] Wu, SS., and Kaiser, D. “Regulation of expression of the pilA gene in
Myxococcusxanthus.” Journal of Bacteriology. 179:7748-7756. (1997) [6] Jakobsen, J.S., and Jelsbak, L. “σ54 Enhancer Binding Proteins and Myxococcus
xanthus Fruiting Body Development.” Journal of Bacteriology. 186:4361-4367.
(2004)