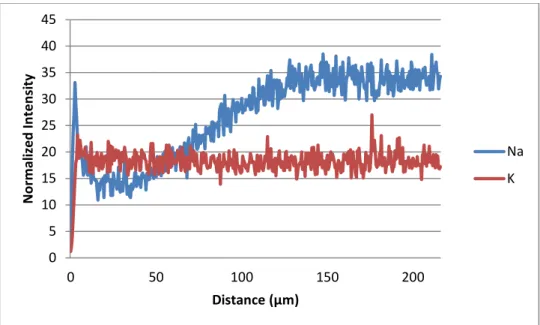
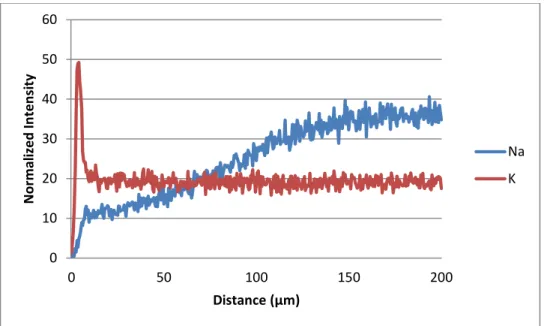
Normalized Na+ and K+ Intensity as a function of depth for Schott AR-Glas® rods exchanged with Treatment A for 30 minutes at 580 oC, followed by exchange with Treatment B for. Normalized Na+ and K+ intensity as a function of depth for Schott AR-Glas® rods exchanged with Treatment A for 30 minutes at 580 oC, followed by exchange with Treatment D.
ABSTRACT
INTRODUCTION
LITERATURE SURVEY
- Glass Strengths
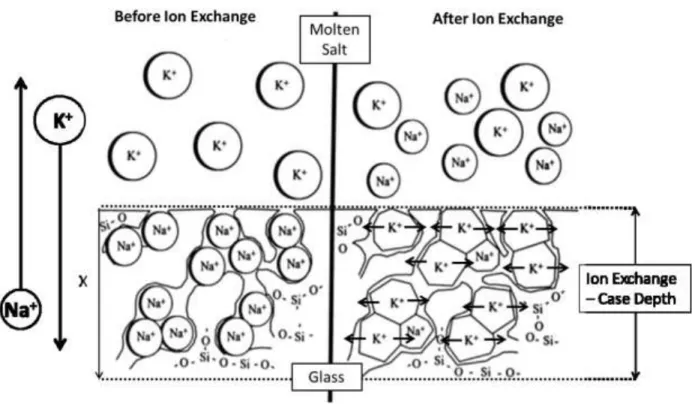
- Ion Exchange
- Diffusion
- Relaxation
- Mixed Alkali Effect
- Patent Background Information
Inducing a compressive stress on the surface of the glass helps prevent the propagation of these surface cracks. Also, during the diffusion process there would be a concentration gradient of the smaller ions exchanged in the surface layer of the glass.
Glass Rod Preparation
Exchange Mediums
After several tests, it was determined that the mixed nitrate salt bath used decomposed at the high temperatures used in these experiments. This decomposition destroyed the integrity of the bath used for this exchange, stained the glass surface, and chemically attacked the surface of the glass. Following these observations, the use of another 1-step exchange medium was necessary that would eliminate these problems.
After much consideration and testing, the exchange medium chosen for step 1 in these experiments had a composition of 80 mol% Li2SO4, 15 mol% K2SO4 and 5 mol% Na2SO4 (Treatment A). The second step was a "low" temperature exchange that allowed the larger Na + and/or K + ions to "stop" the Li + -rich surface layer. In order for "filling" of larger ions for smaller ones to occur, a temperature below the glass transition temperature must be used.
Therefore, taking into account the properties of the Schott AR-Glas®, a temperature of 450 oC was chosen for the second step.
Immersion
Determination of Exchange Depth and Diffusion Coefficients WDS WDS
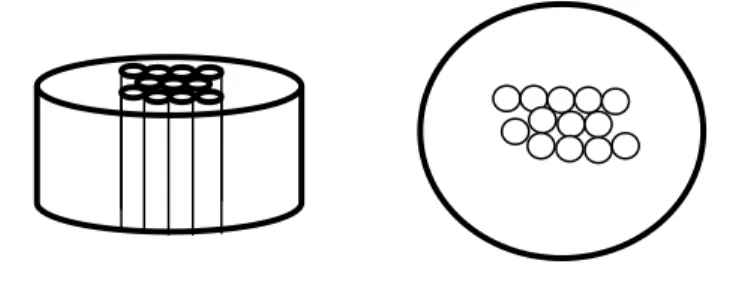
Different ion-exchanged glass rods were first ground to ensure removal of the exchanged layer at the end of the rod. The samples were then marked, glued together and placed on top of each other so that multiple samples could be tested at the same time. Cross-sections of the samples were coated with a Au/Pd conductive coating before being placed in the WDS vacuum chamber.
The vacuum chamber was then pumped down overnight before the samples were ready to be tested. The data was then entered into an Excel spreadsheet and the average of the 10 line scans was taken and graphed. Where C is the concentration of diffusing species, C1 is the initial concentration of diffusing species in the cylinder, Co is the initial concentration of the species diffusing inside the cylinder, a is the radius of the glass rod, r is the radius, D is the diffusion coefficient, t is the time of diffusion, and erfc(z) is given by eq.
Since the diffusion distance is small compared to the radius of the glass rods a/(a-x) ≈ 1.
Mass Change
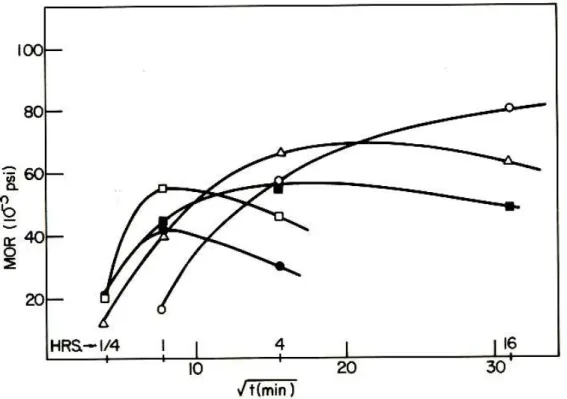
Flexural Strength
The apparatus was disassembled and cleaned before each new sample was loaded in order to avoid residual glass particles influencing the testing of the next glass sample. Where σ is the breaking strength, F is the load at the moment of breaking, Os is the spacing of the outer support rods, Is is the spacing of the inner support rods and D is the diameter of the glass rod. The diameter of the samples was measured at each end of the glass rod and averaged together to obtain the diameter of the center of the rod before each sample was fractured.
RESULTS
Depth of Exchange
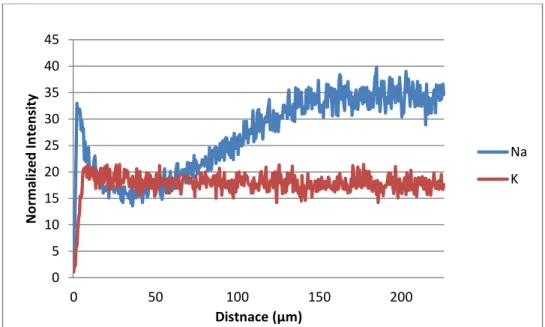
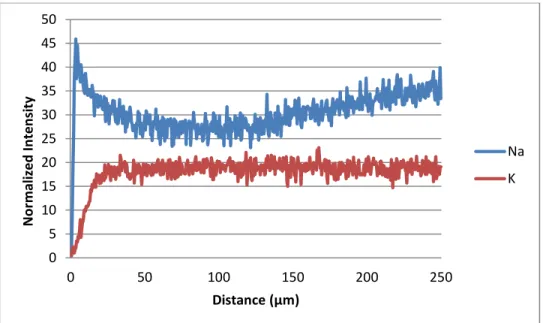
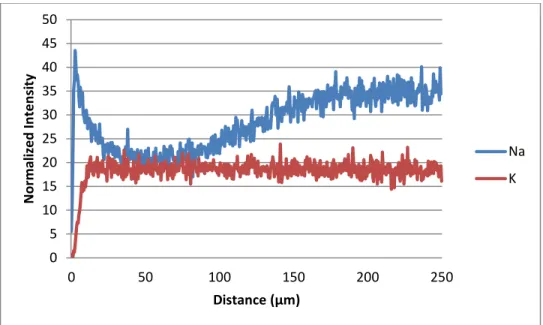
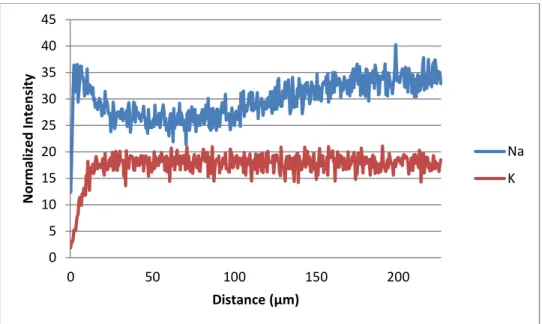
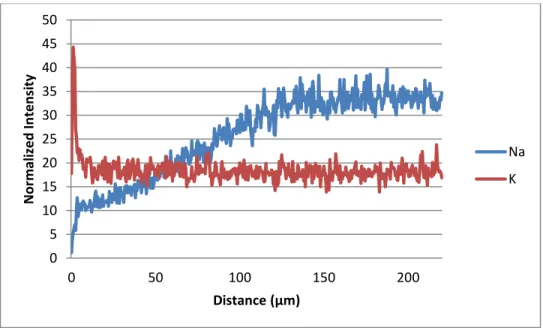
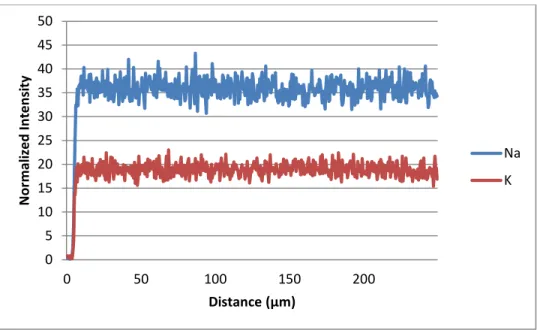
Normalized K+ intensity as a function of depth for Schott AR-Glas® rods exchanged for 10 minutes, 20 minutes and 30 minutes with treatment A at 580 oC. Normalized Na+ and K+ intensity as a function of depth for Schott AR-Glas® rods exchanged with treatment A for 30 minutes at 580 oC followed by exchange with treatment B. Normalized Na+ and K+ intensity as a function of depth for Schott AR-Glas® rods exchanged with Treatment A for 30 minutes at 580 oC, followed by exchange with Treatment C.
Normalized K+ intensity as a function of depth for Schott AR-Glas® rods exchanged with Treatment A for 30 minutes at 580 oC, followed by exchange with Treatment C for 24 hours. Calculated MSD exchange depth and diffusion coefficient for glass rods treated with treatment A for 30 min at 580 oC Followed by treatment D at 450 oC for. Calculated diffusion coefficient (DNa→Li) as a function of the square root of time for Schott AR-Glas® rods exchanged with Treatment A for 30 minutes at 580 oC followed.
Calculated diffusion coefficient (DK→Li) as a function of the square root of time for Schott AR-Glas® bars replaced by treatment A for 30 minutes at 580 oC, then.
Mass Change
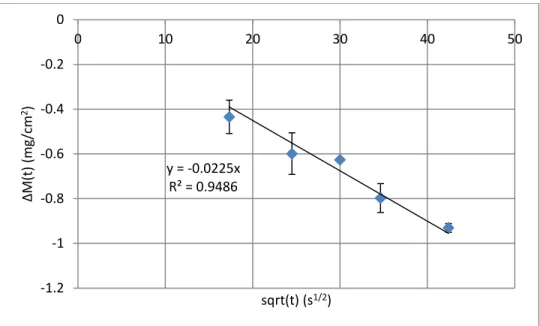
If we assume that during this exchange the lithium ions in the bath only exchange with sodium ions in the glass, we can calculate the diffusion coefficient for this exchange using Figure 28 and eq. Using these diffusion coefficients for different temperatures, we can calculate the activation energy for the lithium ions in Treatment A exchanging with the sodium ions in the Schott AR-Glas® rods with eq. Change in mass per unit area (∆M(t)) as a function of the square root of time for Treatment A for 30 minutes at 580 oC followed by Treatment B at 450 oC for times.
If we assume that the lithium ions exchanged completely with the sodium ions during the first high temperature exchange with Treatment A for 30 minutes at 580 oC, then we can. 39 is the calculated diffusion coefficient for sodium ions from the salt bath exchanging with lithium ions in the glass surface, DNa→Li cm2/s during the 100% NaNO3 exchange at 450 oC in the 2-step process. Similarly, a complete high-temperature lithium exchange is assumed in the surface of the glass rods during treatment A for 30 minutes at 580 oC as before.
We can calculate the diffusion coefficient for the exchange of potassium ions with lithium ions in the second lower temperature K+→Li+ exchange.
Glass Strengths
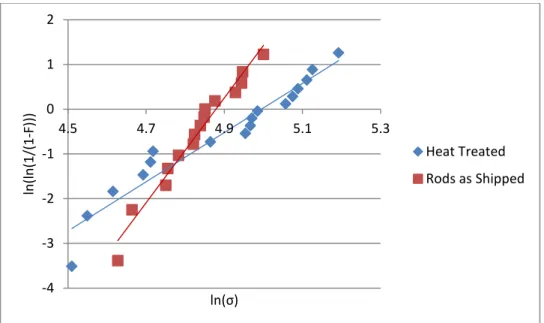
Weibull plot for 4-point bending strength of Schott AR-Glas® rod specimens ion-exchanged with Treatment A at 580 oC for times between 5 minutes and 30 minutes. Weibull plot for 4-point bending strength of Schott AR-Glas® bar specimens ion-exchanged with treatment A for 20 minutes at 580 oC followed by 100% NaNO3 at 450 oC for. Weibull plot for 4-point bending strength of Schott AR-Glas® bar specimens ion-exchanged with Treatment A for 20 minutes at 580 oC followed by 100% KNO3 at 450 oC for.
Weibull plot for 4-point flexural strength of Schott AR-Glas® rod samples exchanged with Treatment A for 30 minutes at 580 oC (preheated for 20 minutes at 580 oC). Weibull plot for the 4-point flexural strength of Schott AR-Glas® rod samples exchanged with Treatment A for 30 minutes at 580 oC followed by Treatment C at 450 oC for. Weibull plot for the 4-point flexural strength of Schott AR-Glas® rod samples exchanged with Treatment A for 30 minutes at 580 oC followed by Treatment D at 450 oC for.
Weibull modulus and characteristic strengths for treatment A for 30 minutes at 580 oC (preheated for 20 minutes at 580 oC), followed by treatment D at 450 oC.
DISCUSSION
Composition of Salt Bath and Effect on Exchange Depth
First Step Exchange
This difference can be attributed to the slight increase in the concentration of potassium ions on the surface of the glass rods. Although it can be said that the calculated diffusion coefficients are a good estimate, the errors associated with the two sets of data make it difficult to draw any conclusions about the movement of potassium ions. This figure shows that the potassium ions on the glass surface do not exchange with the lithium ions in the bath.
Because the concentration of potassium ions in the untreated glass rods is much lower than the sodium concentration, these anion scavengers allow the glass to be exchanged in the same way as a single alkali glass. These anion traps therefore ensure that the lithium ions ignore the exchange for potassium ions and only exchange with the higher concentration of sodium ions in the glass. These results also seem to indicate that there is a small increase in the concentration of potassium ions in the surface of the glass rods.
39 and Figure 28, the mass increase from the heavier potassium ions exchanging with the sodium ions at the glass surface was not taken into account.
Two step Exchanges
Temperature Effects
Studying the effects of temperature on the exchange of lithium ions exchanged for sodium ions in the first step of the exchange allows us to calculate some physical constants that help us understand the diffusion process. EaLi → Na = 137.7 kJ/mol and diffusion coefficient DoLi → Na = 4.27 cm2/s were calculated for treatment A exchange with Schott AR-Glas® rods. With this information it is possible to calculate the diffusion coefficient D(T) for different temperatures, as well as the exchange depth of this process at different temperatures and times.
The calculated diffusion depth of lithium ions in Treatment A for 30 minutes at 580 OC by eq. This compares quite well with the observed depth of 80 microns as seen in Figure 7 for the same treatment conditions. The temperature effect on the Treatment A exchange with Schott AR-Glas® rods follows the typical Arrhenius diffusion equation as expected.
Unfortunately, the temperature at which the replacement can be performed is still governed by the glass composition itself.
Effect of 1-step and 2-step ion exchange on Fracture Strength
Thus, a thicker lithium-rich layer results in more compression on the glass surface. Thus, the longer the rods were immersed in this bath, the surface of the glass rods deteriorated and became a translucent white color. Glass rods treated in the 2-step process of Treatment B did not show significant strengthening when compared to the 1-step process in Treatment A.
The greatest increase in characteristic strength is seen in glass rods treated for 1 hour in this process. Apparently, these exchanges have a greater effect on the strength of the glass rods than expected. Even with longer treatment times, the amount of sodium ions approaches a constant in the glass rods.
This effect can lower the Tg of the surface layer or layers with small distances in the glass rod.
SUMMARY AND CONCLUSIONS
At small exchange times, the compressive stress prevailed over the tensile stress and caused some strengthening of the glass rods. The high concentration of potassium on the surface causes a high compression layer on the surface, which is reflected in the strengthening of the glass rods during this exchange. This means that alkaline ions exchange with each other on the surface of the glass and that some structural defects are created.
These defects result in tensile stresses that apparently overcome the expected compressive stress at the surface. The mixed alkali effect may also have some effect on the Tg of the glass surface, which may allow some thermal relaxation to occur. Stress profiles and concentration profiles of lithium in the surface of the glass will help further understand what happens during this exchange.
Again, stress profiles and concentration profiles of lithium ions in the surface of the glass could help explain what really happens during these exchanges.