Thesis by
Matthew Gregory Newman
In Partial Fulfillment of the Requirements for the degree of
Doctor of Philosophy
CALIFORNIA INSTITUTE OF TECHNOLOGY Pasadena, California
2018
Defended August 31, 2017
© 2018
Matthew Gregory Newman ORCID: 0000-0003-2752-0121
All rights reserved
ACKNOWLEDGEMENTS
I would like to express my sincere gratitude to the army of people who made this research effort possible. I begin by thanking the members of my thesis committee:
Dan Meiron, Guruswami (Ravi) Ravichandran, Kaushik Bhattacharya, and Richard Kraus.
I owe a huge debt of gratitude to Richard Kraus for his daily advising. Rick has been a wonderful mentor and friend since I got into the dynamic compression field as an undergraduate student at Harvard. His unwaivering support throughout my Ph.D persisted on both the most mundane days of data analysis and the most intense days of experiments. Thank you for your sharing your scientific insights and expertise. I am a better scientist because of Rick’s thoughtful advising. Thank you to both Rick and Alise Kraus (and their cat, Tuna) for your hospitality in hosting me during my time in Livermore.
I need to thank my academic advisor, Ravi, for his unwaivering support over the years. He has taught me many important lessons, not the least of which being that patience is a critical attribute of a scientist (and he possesses patience in spades).
Thank you for your kindness and dedication to teaching.
Over the course of my Ph.D I was fortunate to work with many brilliant scien- tists. I would like to thank my collaborators from Caltech, Princeton, and Lawrence Livermore National Laboratory for their guidance: Paul Asimow for our rigorous discussions on thermodynamics; Zach Sternberger for his help with the radiation hydrodynamics code HYADES; Tom Duffy, June Wicks, and Sally Tracy for shar- ing their expertise in diffraction, high pressure experiments, and planetary science;
Minta Akin and Joel Bernier for their support of the plate impact experiments;
and Richard Kraus, Ray Smith, Jon Eggert, Federica Coppari, and many others in the high energy density group at LLNL for sharing their expertise in the hydrody- namic design of laser driven compression experiments, velocimetry analysis, and diffraction analysis.
The large-scale experiments I have performed would not have been possible without the help of numerous laboratory technicians at the Omega laser facility, Omega EP laser facility, and Dynamic Compression Sector. I would also like to acknowledge the hard work of the LLNL target fabrication team. In particular, I would like to thank Carol Davis, Jim Emig, and Eric Strang.
The Ravi/Kaushik group past and present has been a wonderful resource over the years. I have thoroughly enjoyed the glimpses into each of your research projects at our weekly meetings. It was a pleasure to work alongside each of you. Thank you for keeping me sane and thank you for your friendship.
Finally, I would like to acknowledge funding through the LLNL LDRD-15ERD012 and NLUF grant DE-NA0002720.
ABSTRACT
Knowledge of the equation of state and phase diagram of magnesium silicates and light iron alloys is important for understanding the thermal evolution and interior structure of terrestrial planets. Dynamic compression techniques are the primary viable methods to create the temperature and pressure conditions that are relevant to Earth and super-Earth (1-10 Earth mass) sized planets. However, due to the kinetic constraints imposed by the timescale of dynamic compression experiments, the nature of the state within the dynamically compressed sample (whether equilibrium or metastable) is uncertain. Here, we present the results of a series of dynamic compression experiments performed on both laser driven compression and plate impact facilities to study the nanosecond to microsecond response of forsterite and iron silicide. In situ x-ray diffraction measurements are used to probe the crystal structure of solid phases and test for the presence of melt, from which we investigate the decomposition of forsterite and iron silicide into compositionally distinct phases at high pressure. For forsterite, we do not observe chemical segregation in the solid phase, however the presence of melt speeds up the kinetics and allows chemical segregation to occur on nanosecond timescales. For iron silicide, our results show a textured solid phase upon shock compression to pressures ranging from 166(14) to 282(24) GPa consistent with cubic and hcp structures in coexistence. Above 313(29) GPa, the intense and textured solid diffraction peaks give way to a diffuse scattering feature and loss of texture, consistent with melting along the Hugoniot.
TABLE OF CONTENTS
Acknowledgements . . . iii
Abstract . . . v
Table of Contents . . . vi
List of Illustrations . . . vii
List of Tables . . . xix
Chapter I: Introduction . . . 1
Chapter II: In situ observation of shock induced phase transitions in forsterite 5 2.1 Introduction . . . 5
2.2 Methods . . . 7
2.3 Results . . . 10
2.4 Conclusions . . . 12
Chapter III: Decomposition of Forsterite into MgO and Silica Rich Liquid on Nanosecond Timescales . . . 28
3.1 Introduction . . . 28
3.2 Methods . . . 30
3.3 Results . . . 34
3.4 Discussion . . . 36
3.5 Conclusions . . . 37
Chapter IV: Compression of Iron Silicide at Earth Core Conditions on Nanosecond Timescales . . . 62
4.1 Introduction . . . 62
4.2 Materials and Methods . . . 64
4.3 Results . . . 67
4.4 Discussion . . . 68
4.5 Conclusions . . . 70
Chapter V: Conclusions and Future Work . . . 85
Bibliography . . . 88
LIST OF ILLUSTRATIONS
Number Page
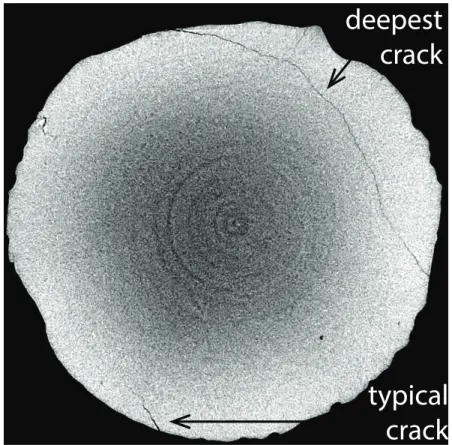
2.1 Qualitative equilibrium phase diagram for the MgSiO3-MgO system. This phase diagram shows that at all pressures above 23 GPa there are no thermodynamically stable single component crystal structures of forsterite composition. At the pressures and tempera- tures relevant to this study, forsterite will decompose to bridgmanite (Bd) and periclase (Pe) in equilibrium. . . 14 2.2 A reconstructed computed tomography slice of a forsterite sam-
ple. Computed tomographic analysis was conducted to determine the porosity of the forsterite samples and search for internal voids/cracks.
The “deepest” crack approaches closer to the sample center than any other observed CT images. Samples were oriented in the DCS target chamber so that the x-ray beam path avoids cracks where possible.
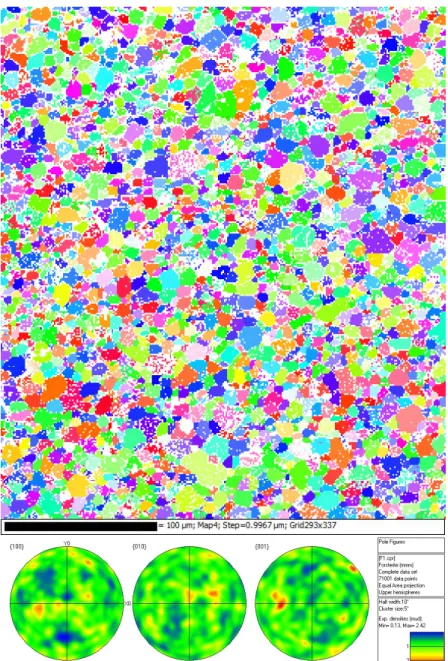
Voxel size is 6 µm. . . 15 2.3 Electron backscatter diffraction (EBSD) characterization of forsterite
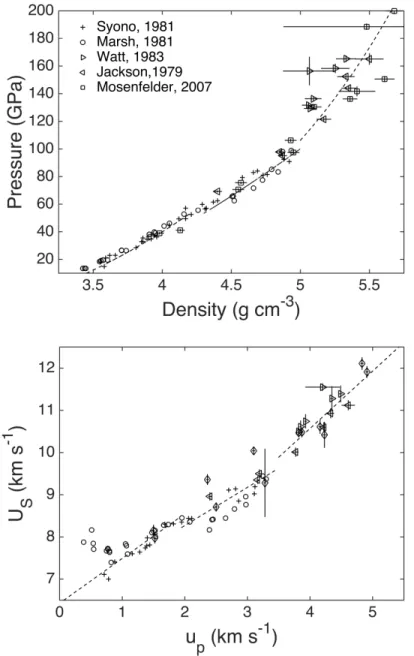
polycrystalline samples. Electron backscatter diffraction was con- ducted to determine the grain size, orientation, and composition of a characteristic forsterite sample. Top: Grain map of forsterite sam- ple indicating a characteristic grain size of∼ 10 µm. All identified grains were indexed as forsterite, with no evidence of periclase or bridgmanite by comparing the observed diffraction pattern to the the- oretical one for these structures. Bottom: Pole figure illustrating that the observed grain orientations are approximately random. . . 16 2.4 Forsterite Hugoniot data used to determine the shock pressure
and density. Plot of the available data of the forsterite Hugoniot in pressure versus density space (top) and shock velocity versus particle velocity (bottom). For shot 084 (below 50 GPa) we used the linear Us-up relationUS = 6.43+1.06upand for shot 085 (above 50 GPa) we usedUS = 6.46+0.905upto determine the shock state through impedance matching. This work attributes the change in density observed on the Hugoniot above 50 GPa to a phase transition from the forsterite structure to the metastable forsterite III structure. . . 17
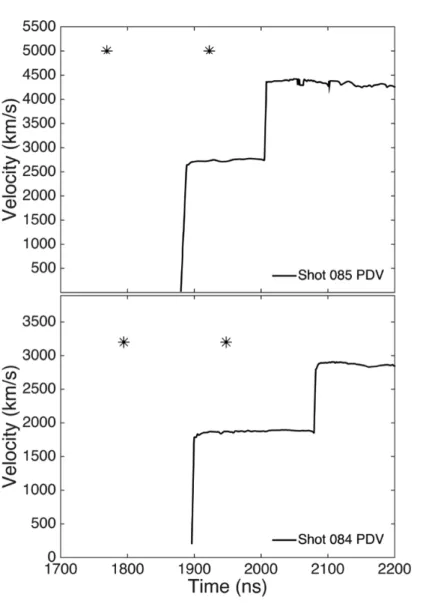
2.5 Timing of plate impact experiment. Photon doppler velocimetry (PDV) lineouts of the true interface velocity between the forsterite sample and LiF window. The initial velocity plateau corresponds to shock breakout into the LiF window, while the subsequent velocity plateau corresponds to release to 0 pressure from the LiF free surface.
The asterisks correspond to the timing of the x-ray source, indicat- ing that in each experiment we observed one frame prior to shock breakout into the LiF window and one frame prior to release to 0 pressure. . . 18 2.6 Beam configuration for in situ x-ray diffraction measurements.
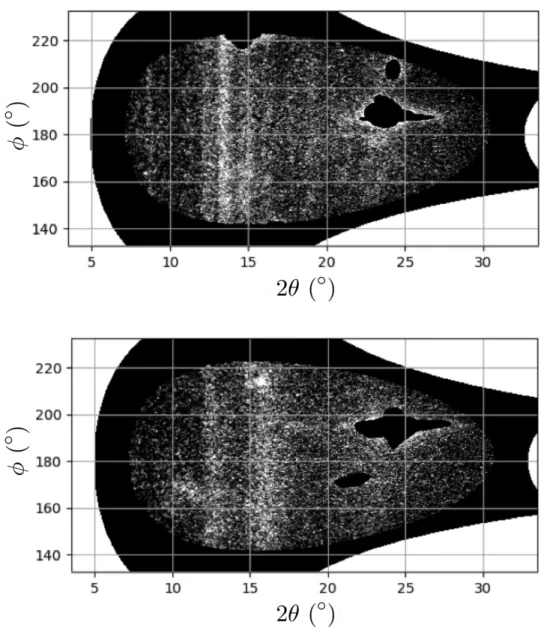
The sample is rotated by 28◦with respect to the beam normal so that the beam path does not probe laterally released states. The path of the beam penetrates the lexan sabot, LiF window, quartz driver, forsterite sample, and forsterite window. The driver and window materials are chosen to minimize x-ray attenuation. Diffracted x-rays are collected every 153.4 ns on an LSO scintillator coupled to a four frame imaging system. . . 19 2.7 Diffraction data for shocked forsterite. Diffraction data is de-
warped into the diffraction coordinates 2θ-φ. The powder peaks cor- respond to diffraction from the shocked polycrystalline forsterite. The masked out regions (black) correspond to single-crystal like diffrac- tion from the LiF window and do not represent diffraction from the forsterite sample. Top: diffraction pattern for forsterite shocked to 44.6(7.0) GPa. Bottom: diffraction pattern for forsterite shocked to 73.4(9.0) GPa. . . 20
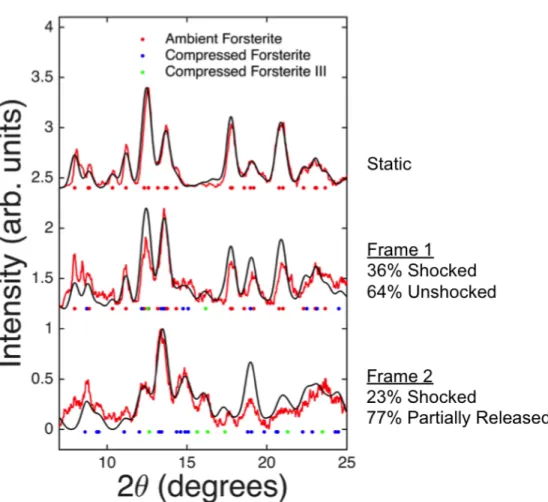
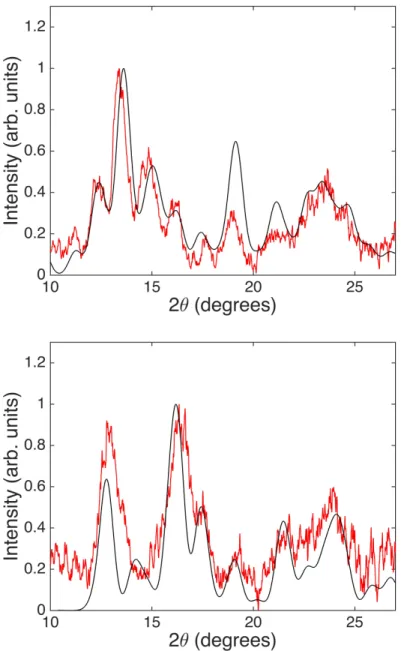
2.8 X-ray diffraction lineout for forsterite shocked to 44.6(7.0) GPa and released to 38.4(8.0) GPa. Experimental lineout (red) compared to the theoretical lineout (black) for a mixture of shocked and released forsterite and forsterite III. The red blue and green data points indicate diffraction peaks for ambient forsterite, compressed forsterite, and compressed forsterite III respectively with a threshold of 10%. The lattice parameters for forsterite and forsterite III are determined by power law fit to the isothermal diamond anvil cell data. Therefore the theoretical diffraction assumes that temperature does not distort the ratios of the lattice parameters. The ratio of forsterite to forsterite III is determined to be 3 to 1 by fitting the theoretical lineout to the data to give the correct relative intensity of the (112) forsterite peak and the (131) forsterite III peak. . . 21 2.9 X-ray diffraction lineout for forsterite shocked to 73.4(9.0) GPa
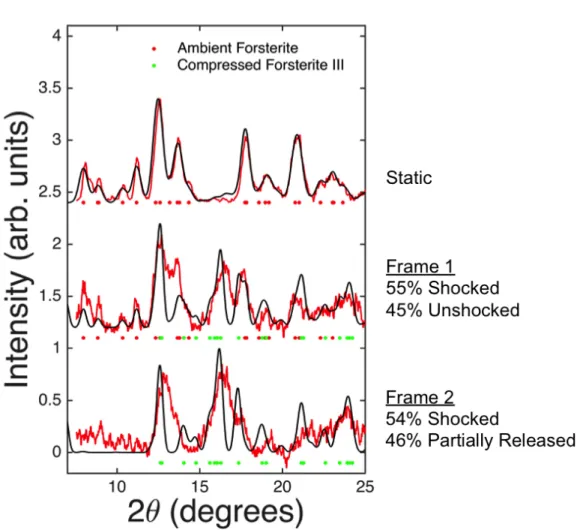
and released to 66.16(10.0) GPa. Progression of experimental line- outs (red) compared to the theoretical lineouts (black) of the forsterite III structure. The red and green data points indicate diffraction peaks for ambient forsterite and compressed forsterite III with a threshold of 10%. . . 22 2.10 Comparison of observed diffraction to expected diffraction from
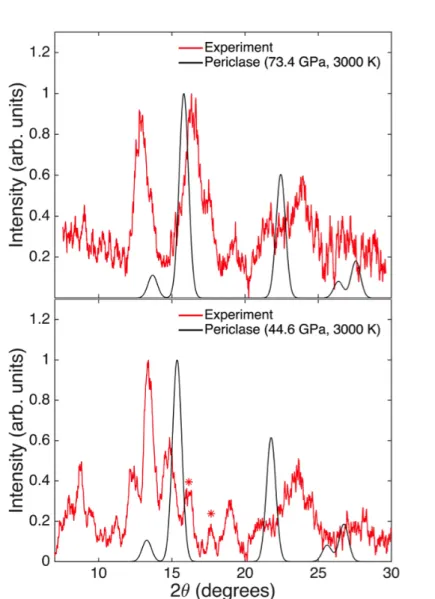
periclase. Diffraction from the periclase structure at the pressures and temperatures relevant to the forsterite Hugoniot are compared to the diffraction data observed in shot 084 frame 2 (bottom) and shot 085 frame 2 (top). The asterisks (bottom) correspond to diffrac- tion peaks not already indexed as diffraction from shock compressed forsterite. . . 23 2.11 Comparison of expected density to density inferred from the
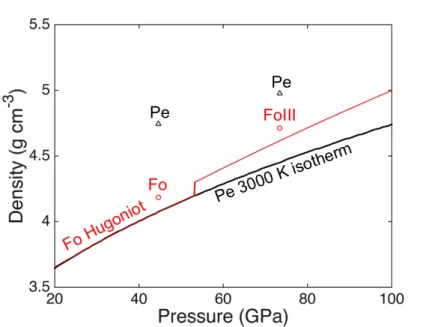
diffraction pattern. The density of periclase, forsterite, and forsterite III are compared to the expected values based upon the previously measured forsterite Hugoniot and the 3000 K periclase isotherm from equations of state (Tange, Nishihara, and Tsuchiya, 2009; Wu et al., 2008). The density required to fit the periclase structure is well outside the uncertainty in the periclase isotherm while the forsterite structures are in good agreement with the Hugoniot density. . . 24
2.12 Lineouts fit to the diffraction data for shot 084 frame 2 (top) and shot 085 frame 2 (bottom). Lattice parameters were fit to the observed diffraction data (Table 2.3) using the Hugoniot density and ambient temperature crystal structure from Finkelstein as an initial guess. The resulting fits are slightly more dense than expected from the Hugoniot bulk density, but well within uncertainties (<3%). . . . 25 3.1 Schematic illustration of the equilibrium phase boundaries in tem-
perature versus composition space for a snapshot in pressure (De Koker, Karki, and Stixrude, 2013). For a forsterite composition, the sub-solidus phase assemblage is expected to be post-perovskite (MgSiO3) plus periclase (B1 MgO). Forsterite is believed to be silica poor relative to the eutectic composition, indicating a sub-liquidus phase assemblage of periclase plus silica-rich liquid. . . 39 3.2 Experimental setup.Top: Schematic diagram of the diffraction de-
tector (PXRDIP box) where x-rays are collected on image plates which line the sides of a 5 × 5 × 7.5 cm3 box. The solid red line shows the straight through x-ray path and the dashed line shows the path of x-rays scattered by the sample. The VISAR path is down range of the sample. Bottom: Schematic diagram of the target pack- ages for shock and ramp experiments. The VISAR is incident upon the forsterite/LiF interface. A 75 or 150µm thick Ta pinhole with 300 µm diameter aperture is useds to collimate the x-rays and calibrate the detector geometry. . . 40
3.3 Timing of shock compression experiment for shot 21922. Top:
representative laser pulse shape for the beams that drives the sample (left axis) and the beams that drive the x-ray backlighter (right axis).
The ramping of intensity in the laser drive pulse shape compensates for adiabatic cooling due to expansion of the plasma plume which would otherwise generate a decaying shock. The steepening of the laser pulse relative to the ideal laser pulse shape (black) starting at 15 ns is responsible for the late time unsteadiness observed in the VISAR profile. Bottom: representative VISAR profile for shock compression experiments. The initial steady velocity plateau is used in the impedance match calculation to determine the shock pressure in the sample. The slight increase in particle velocity at 27 ns is confirmed by hydrodynamic simulations to be due to an inadvertent steepening in the laser pulse shape. The decrease in particle velocity at 28.5 ns is due to a release wave from the ablation surface. The axis range of the VISAR trace starts when the x-ray backlighter beams turn off to show relative timing. . . 41 3.4 Characteristics Diagram for shock-ramp experiments. Bottom: Char-
acteristics plot showing the wave interactions for the shock-ramp ex- periments calculated using the radiation hydrodynamics code HYADES (Larsen and Lane, 1994). The complete target assembly of Be ab- lator, forsterite sample, and LiF window is simulated. Top: Wave interactions for just the forsterite region (enclosed in red). The x- ray source is timed to probe the forsterite after the ramp wave has transited the sample. . . 42
3.5 Timing of ramp compression experiment for shot 24313. Top:
representative composite laser pulse for shock-ramp experiments.
Three 10 ns laser beams are stacked sequentially in time to produce the composite shock and ramp pulse (left axis). The single 3-ns laser pulse that illuminates the Cu foil and thereby generates the x-ray source is plotted on the right axis. Bottom: Measured velocity at the interface between the forsterite sample and LiF window. The ramp wave enters the LiF at∼23.5 ns and gradually ramps to the maximum velocity over a period of ∼2.5 ns, indicating shockless compression of the forsterite sample. The x-ray source is timed so that the sample is probed after the ramp wave has transited the sample. The decrease in velocity observed at 27 ns is due to release associated with laser turn off. . . 43 3.6 Thermodynamic path for the shock-melt ramp-resolidification
experiments. The forsterite sample is first shocked to a point on the Hugoniot between the solidus and the liquidus, determined from single shock measurements (state 1). Subsequently, the sample par- tially releases at constant entropy into a LiF window, a process which further drives the sample towards the liquidus (state 2). Finally, the sample is shocklessly compressed back across the liquidus where it is probed with x-rays (state 3). . . 44 3.7 Forsterite Hugoniot between 90 GPa and 140 GPa. SelectedUS−
up data for forsterite in the solid high pressure phase region (top) and the partial melt regime (bottom) (Mosenfelder, Asimow, and Ahrens, 2007; Jackson and Ahrens, 1979; Wett and Ahrens, 1983).
To account for the large disparity in the errors associated with each data point, the data are linearly fit using a total least squares approach that includes uncertainties in both the particle and shock velocity (Krystek and Anton, 2007; Ruoff, 1967). The linear fits are used to infer the shock pressure in the sample from the LiF interface velocity through the standard impedance matching technique (Zeldovich and Raizer, 1965). . . 45
3.8 Diffraction data collected for shock compression to 125 GPa. The raw image files are dewarped intoφ−2θspace. Diffraction identified as coming from the shock sample is boxed in red. In each experiment, we observe three distinct Bragg peaks at 64◦that correspond to crystal planes rotated 33◦with respect to one another. This indicates that the microstructure induced by shock compression is consistent in each experiment and may suggest twinning. . . 46 3.9 The observed d-spacing is plotted as a function of Hugoniot pressure
and compared to the expected diffraction peak positions for peri- clase at the relevant thermodynamic condition (Tange, Nishihara, and Tsuchiya, 2009; Wu et al., 2008). The line width denotes the relative intensity of the diffraction peaks; however due to the texture of the sample relative peak intensities or the absence of a diffraction peak cannot be used to rule out a structure. The peaks that we inter- preted as solid diffraction from the shocked sample are plotted as red circles. The observed diffraction peaks do not match the expected peak location for periclase, and so we rule out periclase as a structure. 47 3.10 The observed d-spacing is plotted as a function of Hugoniot pressure
and compared to the expected diffraction peaks for bridgmanite at the relevant thermodynamic condition (Tange, Kuwayama, et al., 2012; Fiquet, Andrault, et al., 1998; Fiquet, Dewaele, et al., 2000).
Diffraction peaks are plotted if they fall above a threshold intensity of 25% (left) and 5% (right) of the most intense diffraction peak for the bridgmanite structure. The peaks interpreted as solid diffraction from the shocked sample are plotted as red circles. Diffraction is not expected at 2.2 and 125 GPa for the bridgmanite structure, so we rule it out as a candidate. . . 48 3.11 The observed d-spacing is plotted as a function of Hugoniot pressure
and compared to the expected diffraction peaks for post-perovskite at the relevant thermodynamic condition Sakai, Dekura, and Hirao, 2016; Murakami et al., 2004. Diffraction peaks are plotted if they fall above a threshold intensity of 25% (left) and 5% (right) of the most intense diffraction peak for the post-perovskite structure. The peaks interpreted as solid diffraction from the shocked sample are plotted as red circles. Diffraction is not expected at 2.2 and 125 GPa for the post-perovskite structure, so we rule it out as a candidate. . . 48
3.12 Diffraction data for partally molten forsterite. Raw (top) and pro- cessed (bottom) diffraction data for forsterite shocked into the partial melt regime. In this Hugoniot region, we observe two features asso- ciated with diffraction from the forsterite sample; a sharp peak which we assign to periclase (red arrow) and a broad peak characteristic of diffuse scattering from a liquid (blue arrow). In this illustration, we show the raw diffraction data (top), a lineout of the de-warped diffraction data (middle), and the de-warped diffraction data (bottom). 49 3.13 Raw (top) and processed (bottom) diffraction data for shock compres-
sion to 214 GPa. The processed diffraction data has been dewarped in toφ−2θspace and background subtracted. In this Hugoniot region, we only observe diffuse liquid scattering. . . 50 3.14 The observed d-spacing is plotted as a function of Hugoniot pressure
and compared to the expected diffraction peaks for periclase at the relevant thermodynamic condition Fiquet, Andrault, et al., 1998;
Fiquet, Dewaele, et al., 2000.The peaks interpreted as solid diffraction based on peak width are plotted as red circles. . . 51 3.15 The observed d-spacing is plotted as a function of Hugoniot pressure
and compared to the expected diffraction peaks for post-perovskite at the relevant thermodynamic condition Sakai, Ohtani, et al., 2011;
Murakami et al., 2004. While the peak we observe does match a diffraction peak of post-perovskite, we rule out this structure because under powder diffraction we do not observe any of the other post- perovskite peaks. . . 52 3.16 The observed d-spacing is plotted as a function of Hugoniot pressure
and compared to the expected diffraction peaks for forsterite with a threshold intensity greater than 25% at the Hugoniot density. We rule out the forsterite structure because we do not observe the more intense forsterite peaks expected at roughly 2.1 and 1.5 . . . 53 3.17 The observed d-spacing is plotted as a function of Hugoniot pressure
and compared to the expected diffraction peaks for forsterite III with a threshold intensity greater than 25% at the forsterite Hugoniot density (Finkelstein et al., 2014). We rule out the forsterite III structure because under powder diffraction we do not observe any of the most intense forsterite III diffraction peaks. . . 54
3.18 The observed d-spacing is plotted as a function of ramp pressure and compared to the expected diffraction peaks for periclase at the relevant thermodynamic condition. . . 55 3.19 Raw (top) and processed (bottom) diffraction data for ramp com-
pression to 284(28) GPa. The processed diffraction data has been dewarped in to φ − 2θ space and background subtracted. Peaks indexed as periclase are indicated by blue arrows. . . 56 3.20 Plot of log grain diameter normalized by the lattice parameter of
MgO as a function of log time (Syono, Goto, Takei, et al., 1981; H.
Fei, 2013; De Koker, Stixrude, and Karki, 2008; Farver, Yund, and Rubie, 1994). The region shaded in red corresponds to grain sizes less than one lattice parameter of MgO and the region shaded in blue corresponds to the timescale of the experiments performed in this work. The black data points are lower bounds on the grain size for B1 MgO in the partial melt region of the Hugoniot calculated from the Scherrer equation. . . 57 4.1 Timing of shock compression experiment. Panel (a) shows a char-
acteristic EP laser pulse shape from shot 22564 for the beam that drives the sample (left axis) and EP laser pulse shape for the beam which illuminates the Cu or Fe foil used as an x-ray source (right axis). The ramping of intensity in the laser drive pulse shape com- pensates for adiabatic cooling due to expansion of the plasma plume which would otherwise generate a decaying shock. Panel (b) shows a characteristic VISAR trace from shot 22564 for shock compression experiments. The wave velocity following shock breakout is used in the impedance match calculation to determine the shock pressure in the sample. The decrease in particle velocity at 12 ns is due to the laser shut off. The difference in velocity observed in VISAR 1 and VISAR 2 is consistent with the assumed phase uncertainty of 5%. The x-ray source laser (panel (a)) turns off prior to the shock releasing into the LiF (panel (b)) at 10 ns so that release states are not probed by x-rays. . . 74
4.2 Electron Backscatter Diffraction (EBSD) characterization of the Fe-15Si starting material. Grain map of a characteristic Fe-15Si sample indicating a grain size on the order of 500 µm. The 300 µm pinhole aperture is shown as a black circle (in an arbitrary location) for relative scale which indicates that the sample is highly textured under the pinhole aperture. . . 75 4.3 Experimental setup and target geometry. Top: Schematic diagram
of the diffraction detector (PXRDIP box) where x-rays are detected on image plates that line five sides of a 5×5×7.5 cm3box. Solid red lines show the direct beam x-ray path and the dashed red line shows schematically the path of reflected x-rays from the shocked sample.
The path of the VISAR laser is down range of the sample. Bottom:
Schematic diagram of the target package consisting of an Fe-15Si foil sandwiched between a kapton ablator and LiF window held together by a thin (< 1µm thick) layer of epoxy. The VISAR is incident upon the Fe-15Si/LiF interface. A 150 µm thick W pinhole with 300 µm diameter aperture is used to collimate the x-rays and calibrate the detector geometry. . . 76 4.4 Iron Silicide Hugoniot Parameters. Top: power law fit to the linear
Hugoniot parameters (C and S) as a function of composition in weight percent. The fit was used to determine the Hugoniot parameters for iron silicide at 15 weight percent silicon. We assumed a 5%
uncertainty in the fit parameters determined from the mean residual squared error of the power law fit. Bottom: linear fit to the ambient density as a function of composition in weight percent. The density measured in this work (plotted as an asterisk) shows good agreement to the power law fit to available data. . . 77
4.5 X-ray diffraction patterns for solid samples. Characteristic x-ray diffraction data for samples shocked into the solid Hugoniot regime.
Each peak is attributed to either diffraction from the sample, W pin- hole, Al layer, or LiF single-crystal like peaks. Top: Raw diffraction data for shot 81664. The peaks assigned to thehcpandbccstructures are indicated in red and blue respectively. The curves labeled with green, yellow, and red points correspond to powder diffraction from the W pinhole used to callibrate the detector geometry and de-warp the image into 2θ−φspace. The diffraction signatures encircled in cyan come from LiF single-crystal like diffraction and indicated in green come from polycrystalline Al. Left: De-warped image plates.
Right: Composite lineout showing the integratedφdata as a function of d-spacing. The black correspond to individual lineouts taken over each individual diffraction peak and the red curve corresponds to the summation of each curve. . . 78 4.6 X-ray Diffraction patterns for molten samples. At 313(29) GPa we
observe shock melting indicated by the loss of texture associated with crystallographic orientation and the onset of liquid diffuse scattering indicated in blue on the diffraction panels and lineout. Top: Raw diffraction data where the peaks encircled in cyan correspond to single crystal diffraction from the LiF window, the intense powder peaks correspond to diffraction from the W pinhole, and the diffuse signature corresponds to diffraction from the molten Fe-15Si. . . 79 4.7 d-spacing versus pressureObserved d-spacing versus pressure are
plotted against their theoretical values for hcpwith an ideal c/a ratio and ordered cubic structures at the Fe-15Si Hugoniot density. Rela- tive expected peak intensities are indicated by line width. The in situ x-ray diffraction data are consistent with a cubic (plotted in black) andhcp(plotted in red) structure in coexistence from 166(14) GPa to 282(24) GPa. . . 80 4.8 d-spacing versus pressure for Lyα and HeαenergiesObserved d-
spacing versus pressure assuming that peaks previously indexed as bccare actually Lyαdiffraction from the (011)hcpplane. . . 80
4.9 Calculated Hugoniot temperatures for Fe-15Si. Hugoniot tem- peratures for Fe-15Si calculated using a 3rd order Birch-Murnaghan equation of state and Debye and electronic model of the heat capacity (Fischer, Campbell, Caracas, Reaman, Heinz, et al., 2014; Brown and McQueen, 1986). The highest pressure where we observe solid diffraction and the lowest pressure where we observe only liquid scattering are 282(24) GPa and 313(29) GPa respectively. The upper bound corresponds to the limit where there is no latent heat associ- ated with melting and no electronic contribution to the heat capacity.
The lower bound includes a latent heat and electronic heat capacity taken to be equivalent to pure iron. We find that incipient melting observed at 282(24) GPa corresponds to melting point depression relative to the melting temperature of pure iron, which is expected due to entropy of mixing (Ma et al., 2004). The melt boundary from literature for Fe-16Si is plotted in solid black and extrapolation of the data to higher pressure is plotted as a dashed black line. . . 81
LIST OF TABLES
Number Page
2.1 Shock States Achieved In Each Experiment. Tabulation of the shock and release pressures and density determined from the mea- sured interface velocity from PDV. The densities are used to compare theoretical diffraction from the forsterite and forsterite III structures to the observed diffraction pattern. . . 13 2.2 Relative mass percent of states probed by x-rays. Tabulation of the
sample conditions determined from the x-ray probe time relative to shock breakout into LiF (column 2) and known shock velocities and sound speeds in forsterite (Duffy and Ahrens, 1992; Brown, Furnish, and Boness, 1987). X-rays timed before shock breakout probe both shocked and unshocked forsterite states, while x-rays timed after shock breakout probe both shock states and partially released states. . 13 2.3 Lattice parameters fit to the diffraction data. Lattice parameters
for the forsterite and forsterite III structures observed in shots 084 and 085 respectively. . . 13 3.1 Shock States Achieved In Each Experiment. Tabulation of the
measured interface velocity from VISAR and the shock pressure from the impedance match calculation. The uncertainty in the interface velocity includes 5% uncertainty in VISAR phase, the uncertainty associated with wave unsteadiness, and the uncertainty in the velocity correction due to the LiF index of refraction. . . 38 3.2 Textured Diffraction Angles . . . 38 3.3 Relative Crystal Plane Angles . . . 39
4.1 Summary of experimental data. Tabulation of the laser drive en- ergy, measured interface velocity from VISAR, the shock pressure from the impedance match calculation, and observed d-spacing for experiments on the omega extended pulse laser (EP) and the omega 60 beam laser (ω). The uncertainty in the interface velocity includes 5% uncertainty in VISAR phase as well as the uncertainty associated with wave unsteadiness. D-spacings are determined by Gaussian fit to lineouts of the de-warped image plates. Each peak was assigned to a crystal plane in either thebccorhcpstructure. Due to the texture of the sample, absence of a diffraction peak is not evidence for ab- sence of the structure. The dominant source of error in the d-spacing is the uncertainty in the location along the pinhole from where the diffraction is occuring. This introduces an error of roughly 0.1◦ in the 2θ diffraction angle, which we use as our reported error (Rygg et al., 2012). . . 72 4.2 Orientation relationship for bcc andhcp structures. Tabulation
of the textured diffraction data that indicates an orientation relation- ship between the bcc and hcp phases. Columns 2 and 3 denote the polar and azimuthal angles where diffraction from the (011)bcc crystal plane was observed. Columns 4 and 5 denote the polar and azimuthal angles where diffraction from the (011)hcp crystal plane was observed. Column 5 tabulates the calculated angle between the (011)bccand(011)hcp crystal planes implied by the observed diffrac- tion angles. The planes are nearly parallel, consistent with Burgers correspondence betweenbccandhcpstructures. . . 73
C h a p t e r 1
INTRODUCTION
Modeling the interior structure and thermal evolution of rocky planets requires knowledge of the equation of state and phase diagram of planetary materials at thermodynamic conditions that are relevant to planetary interiors and planetary formation processes. There has been wide interest in the multi-component melting behavior of magnesium silicates and iron alloys as model systems for understanding the dynamics of planetary mantles and cores, respectively (De Koker, Stixrude, and Karki, 2008; De Koker, Karki, and Stixrude, 2013; Adjaud, Steinle-Neumann, and Jahn, 2011). Mg2SiO4 forsterite is close to the bulk silicate Earth composition and has been studied extensively at the conditions relevant to the Earth’s mantle (De Koker, Stixrude, and Karki, 2008; Adjaud, Steinle-Neumann, and Jahn, 2011).
Pure iron or iron-nickel alloys do not reproduce the density required by geophysical observations, and so an alloy of iron and silicon (iron silicide) has been considered as a potential candidate for the core composition (Birch, 1952; McDonough, 2003).
Previous studies of Mg2SiO4, forsterite and iron silicides illuminate the interplay between thermodynamics and planetary processes.
Both forsterite and iron silicide exhibit complicated thermodynamic behavior as according to the Gibbs-Duhem relation, the number of phases that can exist in equi- librium increases with each material component in the system. For forsterite at the conditions relevant to the Earth’s lower mantle, there is no stable solid structure with Mg2SiO4 composition (De Koker, Karki, and Stixrude, 2013; Presnall et al., 1998). Achieving equilibrium at lower mantle conditions from an initially homoge- neous forsterite composition necessarily requires decomposition into the sub-solidus phase assemblage of periclase (MgO) and perovskite (MgSiO3) or the sub-liquidus phase assemblage of periclase and silica rich liquid. This phase separation is poten- tially important, as the density contrast between periclase and liquid phases induced by phase separation in magnesium silicates could drive chemical stratification of planetary mantles during magma ocean crystallization (Solomatov, 2007).
Similarly, for iron silicides at core conditions, silicon is insoluble with iron and no stable structure with silicon composition greater than 7.9% has been observed (Fischer, Campbell, Reaman, et al., 2013; Fischer, Campbell, Caracas, et al., 2014;
Lin et al., 2002; Lin, 2009). Light element rejection (incongruent melting) upon solidification at the inner core boundary has been hypothesized to contribute to the buoyant instability responsible for convection of the Earth’s outer core which in turn generates the Earth’s magnetosphere. Therefore, for both forsterite and iron silicide, achieving equilibrium at the extreme pressures and temperatures relevant to planetary interiors requires the creation of heterogeneous domains from the originally homogeneous material, a process we refer to as chemical segregation.
For most single component systems, the kinetics associated with phase transitions have been attributed to the timescale for homogeneous nucleation (S.-N Luo and Ahrens, 2004). Single-component transitions may occur rapidly through pathways to equilibrium which only require local deformation of the material (Hennig, 2005).
In contrast, for multi-component systems that may chemically segregate, the kinetics may be controlled by the ionic diffusivity of the homogeneous solution from which the heterogeneous domains are precipitated (Porter, Easterling, and Sherif, 2009).
Given this constraint, the equilibrium phase diagram does not give the complete physical picture for materials that may phase segregate. For example, under 300 K compression of forsterite to 90 GPa, a series of compounds with Mg2SiO4compo- sition have been shown to remain metastable well into the region where chemical segregation should occur (Finkelstein et al., 2014).
Historically, dynamic compression techniques have been used to probe the pressure and temperature conditions deep within the Earth and other planets (Jackson and Ahrens, 1979; Wett and Ahrens, 1983; Mosenfelder, Asimow, and Ahrens, 2007;
Lyzenga and Ahrens, 1980; S-N Luo, Akins, and Asimow, 2004; Brown, Furnish, and Boness, 1987; Brown and McQueen, 1986). However, for the study of multi- component materials, it is important to consider the fact that we are using nanosecond to microsecond timescale experiments to infer the behavior of natural processes that occur over the thousand year timescale. Broadly, dynamic compression techniques come in two flavors: uniaxial plate impact and laser driven compression. In plate impact experiments, the pressure state of the sample is induced by impact with a projectile. The ultimate pressure achieved is limited by the impedance and velocity of the projectile. The two stage light-gas gun at the Dynamic Compression Sector is capable of launching projectiles up to 6 km s−1generating pressures on the order of hundreds of GPa. The amount of time that the sample is subjected to the shock state is limited by the thickness of the sample, which in turn is limited by the time it takes for free surface waves to release the sample to ambient pressure. A typical
timescale for plate impact induced compression may range from 102ns to 103ns.
In laser driven compression experiments, the sample pressure is limited by the in- tensity of the laser beam and the efficiency with which laser energy can be converted to pressure in the ablation plasma. At the Omega laser facility, lasers can be used to generate pressures in excess of 1 TPa. However, the duration of the experiment is limited by the pulse duration of the laser which may range from roughly 1 ns to 10 ns.
Historically, material response under dynamic compression has been probed using measurements of the wave profile or wave speeds. However, recently, in-situ x- ray diffraction measurements have started to become more common in dynamic compression science. Powder X-ray diffraction measurements provide a method to record the high-pressure phase or phases of the compressed material. Solid structures are readily identified through comparison of the observed diffraction pattern to candidate crystal structures. Liquid phases may be inferred from loss of texture associated with crystallographic orientation and onset of diffuse scattering attributed to the loss of the strict order of a crystalline solid.
Combined, plate impact and laser platforms allow us to probe material response across three orders of magnitude in both pressure and time. To our knowledge, prior to this work, there have been no direct investigations into the kinetics of chemical segregation at high pressures and temperatures.
For solid-solid phase transitions, chemical segregation will be kinetically limited by solid state diffusion, which may occur as volume diffusion or as diffusion along grain boundaries. In chapter 1, we present the results of uniaxial plate impact exper- iments, where my collaborators and I used in situ x-ray diffraction measurements to determine the microsecond response of forsterite shocked to pressures of up to 75 GPa. These measurements demonstrate the persistence of metastable forsterite compounds at the elevated temperatures and pressures on the forsterite Hugoniot and thereby bound the solid state diffusivity of Mg2SiO4 as the equilibrium phase assemblage does not nucleate on the microsecond timescale of these experiments.
For materials dynamically compressed to a partially molten state, the path to equilib- rium may proceed more rapidly. In chapter 2, we present the results of laser driven dynamic compression experiments on forsterite driven into the partially molten regime. Results demonstrate that by progressing from the liquid state to the solid state, dynamic experiments may be used to probe equilibrium properties even in
materials that chemically segregate.
In chapter 3, we discuss the results of a series of laser driven shock compression experiments on an iron silicide alloy with 15 weight percent silicon. Iron silicide alloys of varying composition have been studied extensively in uni-axial plate impact experiments, but these results show the first in situ measurement of the crystal structure and melting upon shock loading (Matassov, 1977; Funtikov, 2007; Balchan and Cowan, 1966; Kormer and Funtikov, 1965). Motivated by the results of this initial effort, we suggest future experiments and diagnostic developments that would be valuable for measuring chemical segregation and incongruent melting in dynamic experiments.
C h a p t e r 2
IN SITU OBSERVATION OF SHOCK INDUCED PHASE TRANSITIONS IN FORSTERITE
2.1 Introduction
Knowledge of the equation of state and phase diagram of the MgO-MgSiO3 ther- modynamic system is important for modeling the interior structure and dynamics of the Earth’s mantle (Asimow, 2017; Y. Fei et al., 2004). Mg2SiO4forsterite has been studied extensively by the high pressure community over a wide range of thermody- namic conditions to understand partial melting and potential chemical stratification of the mantle (Adjaud, Steinle-Neumann, and Jahn, 2011; De Koker, Stixrude, and Karki, 2008). Figure 2.1 shows that at the pressures relevant to the Earth’s lower mantle, there is no stable compound with composition Mg2SiO4. Achieving an equi- librium state from an initially homogeneous forsterite crystal necessarily involves decomposition into at least two compounds with different composition and hence creation of heterogeneous domains from the originally homogeneous material, a process that we refer to as chemical segregation.
Chemical segregation in magnesium silicates is well established by heated static high pressure experiments and further supported by first-principles calculations.
First-principles molecular dynamics simulations support chemical segregation of forsterite into a sub-solidus phase assemblage of periclase and bridgmanite (De Koker, Karki, and Stixrude, 2013). As a single component, the bridgmanite structure is stable to 125 GPa, where a phase change to a post-perovskite phase (CaIrO3 structure) occurs (Murakami et al., 2004; Oganov and Ono, 2004). Similarly, the periclase structure remains stable to 600 GPa, where a phase change from the B1 structure to the B2 structure occurs (Coppari et al., 2013). Chemical segregation in Mg2SiO4 has been observed at pressures above 23 GPa from detailed equilibrium experiments in heated multi-anvil presses (Presnall et al., 1998). However, under 300 K compression, a series of compounds with Mg2SiO4composition have been shown
This chapter is in preparation for submission with Minta C. Akin, Joel V. Bernier, Richard G.
Kraus, Paul D. Asimow, Jed L. Mosenfelder, Amanda Dillman, Sally Lee, Barbara Lavina, Darren C. Pagan, Ryan Crum, and Jonathan Lind.
to remain metastable to 90 GPa, well into the region where chemical segregation to the equilibrium phase assemblage is expected to occur (Finkelstein et al., 2014).
Uniaxial plate impact experiments provide a platform to measure the high-pressure and high-temperature equation of state of materials. Therefore, plate impact ex- periments facilitate the study of geologic materials at the elevated pressures and temperatures that are directly relevant to the conditions in the Earth’s lower man- tle. Previous experiments have delineated several phase regions on the forsterite Hugoniot on the basis of density variations, sound speed measurements, and shock temperature measurements (Mosenfelder, Asimow, and Ahrens, 2007; Lyzenga and Ahrens, 1980; Brown, Furnish, and Boness, 1987); however, no direct in situ obser- vations of the phase or phases behind the shock front have been made. Therefore, the nature of the state behind the shock front (metastable or equilibrium) remains unidentified. This question is particularly pertinent to forsterite, where access to the equilibrium phase assemblage may be kinetically inhibited due to the timescale required for chemical separation, which is limited by the ionic diffusivity of the solid solution from which the equilibrium phase assemblage is precipitated. To nucleate nanometer sized grains (the smallest grains that may reasonably be called stable (Hawreliak et al., 2007; Gleason et al., 2015)) on the characteristic microsecond timescale of plate impact experiments would require an ionic diffusivity of 1 nm2 µs−1, which is 5 orders of magnitude larger than the ionic diffusivity expected for bulk solid forsterite (H. Fei, 2013). Therefore, a reconstructive phase transformation is unlikely on the basis of volume diffusion under experimental shock conditions.
However, crystallization of the equilibrium phase assemblage may be possible from other mechanisms such as diffusion along grain boundaries (where the diffusivity may be as much as 9 orders of magnitude larger than the volume diffusion) or liquid diffusion activated by localized melting (De Koker, Stixrude, and Karki, 2008; H.
Fei, 2013).
Shock recovery experiments, which look for signatures of the shock state in samples recovered to ambient conditions, show disparate results. Samples shocked to 78 GPa and recovered at ambient conditions by Syono et al. suggest that the nature of the so called “Mixed-Phase” Hugoniot region between 50 GPa and 120 GPa is incomplete transformation to the equilibrium periclase and bridgmanite phase assemblage supported by transmission electron microscopic observation of periclase and MgSiO3glass (Syono, Goto, Takei, et al., 1981). In contrast, recovery of samples shocked to pressures up to 75 GPa by Jeanloz, 1980 show no reconstructive phase
transition (Jeanloz, 1980).
In this paper, we present in situ powder x-ray diffraction observations of the crystal structure of forsterite samples shocked to 44.6(6) GPa and 73.4(7) GPa. Our results demonstrate that chemical segregation of forsterite does not occur on dynamic experimental timescales but rather highly non-equilibrium states persist to 73.4(7) GPa on the forsterite Hugoniot.
2.2 Methods
Sample Synthesis and Characterization
The forsterite samples were synthesized by hot pressing finely grained forsterite powder at temperatures between 1200◦C and 1250◦C and a nominal pressure of 3 GPa (Mosenfelder, Deligne, et al., 2006; Mosenfelder, Asimow, and Ahrens, 2007).
The resulting forsterite polycrystalline rod had nearly zero porosity as determined from computed tomography measurements indicating a bulk density very near the crystal density of 3.227 g cc−1. The forsterite rod was cut into 5 discs of approximate 2 mm thickness and polished flat.
To quantify the amount of cracking that occured as a result of the synthesis process, four of the five cut samples were characterized at GSECARS (sector 13) at the Advanced Photon Source, Argonne National Lab (APS). High resolution images (Figure 2.2) were collected for computed tomographic analysis to determine the presence of internal void space, with a voxel size of 6 µm. Internal cracks were observed near the edges of three of the four samples, with the deepest crack approx- imately 2 mm from the edge. The forsterite samples were oriented in the chamber at the Dynamic Compression Sector (DCS) of APS so that the cracks were not in the path of the x-ray beam.
To quantify the composition and distribution of grain size and orientation, a charac- teristic forsterite sample was analyzed by electron backscatter diffraction (EBSD).
The measurements show polycrystalline forsterite composed of randomly oriented grains with an approximate mean grain size of 10 µm as shown in Figure 2.3. All indexed grains were identified as forsterite by comparing the observed diffraction pattern to the theoretical one for forsterite, with no evidence of periclase or bridg- manite in the forsterite samples. Scaling the volume of the forsterite sample by the approximate grain volume suggests each forsterite sample is composed of on the order of 108 randomly oriented grains. Static x-ray diffraction images of the ambient forsterite taken under the quasi-monocromatic x-ray source further demon-
strate that there were no strongly preferred grain orientations in the samples and no measurable amount of periclase in the starting material. To quantify the amount of periclase that may be in the ambient forsterite sample, we take the lowest intensity observed forsterite peak as a bound on the resolution of the diffraction diagnostic.
This methodology implies that the starting sample is composed of less than 0.05 vol- ume percent periclase as the quantity of periclase where the most intense periclase diffraction peak is expected to be less intense than the diffraction threshold.
Experimental Geometry
The nominal target assembly consisted of a 2 mm thick forsterite sample sandwiched between a 100µm thick quartz driver plate and 1 mm lithium flouride (LiF) window.
The downstream face of the forsterite sample is coated with 150 nm of Al to improve reflectivity for velocimetry measurements. The LiF window is used because it is well impedance matched to forsterite and therefore generates a shallow release from the shock state. This is important so that the range of pressures probed by x-rays once the shock exits the sample is minimized.
The targets were impacted by a 4 mm thick LiF single crystal flyer plate mounted in a Lexan sabot. Single crystal LiF was used as a flyer since it is low-Z (to avoid x-ray attenuation) and the single crystal LiF diffraction signature will be easy to separate from the polycrystalline forsterite diffraction signature. The sabot was launched by the two-stage light gas gun at DCS (12.5 mm bore diameter) that is capable of generating projectile velocities up to 6 km s−1.
Pressure Determination
Photon Doppler Velocimetry (PDV) was used to monitor the flyer velocity as well as the particle velocity at the interface between the forsterite sample and LiF window.
The PDV system records the beat frequency of time averaged light intensity which is related to the surface velocity of the reflector (Strand et al., 2006). The apparent particle velocity in the LiF was converted to the true interface velocity using the measured index of refraction for LiF (Rigg et al., 2014). The pressure in the shock state was determined through the standard impedance matching technique using the known Hugoniots of forsterite (Figure 2.4) and LiF (Mosenfelder, Asimow, and Ahrens, 2007; Rigg et al., 2014; Jackson and Ahrens, 1979; Wett and Ahrens, 1983;
Syono, Goto, Sato, et al., 1981; Marsh, 1980). PDV lineouts of the forsterite/LiF interface velocity corrected for the index of refraction of LiF are shown in Figure 2.5 and the pressure states achieved in each experiment are tabulated in Table 2.1.
In Situ X-ray Diffraction
A narrow-band (∼ 0.01% Bandwidth) 23 keV light source is used for precision powder x-ray diffraction measurements. The quasi-monochromatic source generates single-pulse x-ray diffraction images of 100 ps duration. Diffracted photons are detected on an LSO (lutetium oxyorthosilicate) scintillator coupled to four PIMAX cameras capable of recording four frames with an interframe spacing of 153.4 ns per plate impact experiment.
The experimental setup used to collect diffraction images is shown in Figure 2.6.
The axis of the gun was rotated by 28◦relative to the normal of the x-ray beam, such that the path of the beam penetrates the target assembly at 62◦. The angle of the gun axis with respect to the x-ray beam is chosen so that as the sample accelerates along the gun axis, the path of the beam stays ahead of lateral release waves. Therefore, laterally released states in the forsterite are not probed by diffraction. As the x-ray beam path penetrates the flyer, it must be composed of low-Z materials, which inherently limits the pressures that can be induced by plate impact.
Prior to each plate impact experiment, polycrystalline Si was placed in the DCS target chamber and used to calibrate the precise detector geometry. The Si calibration is used to de-warp the diffraction data from raw spatial coordinates into the diffraction coordinates,φversus 2θ, where polycrystalline diffraction data project onto lines of constant 2θ. Contour images of the diffraction pattern are integrated with respect to φto produce diffraction lineouts (intensity as a function of 2θ). Intense single- crystal like diffraction peaks associated with diffraction from the single crystal LiF window are masked out of the contour image so that they are not integrated into the diffraction lineout.
For diffraction images of the forsterite sample, the Si calibration is corrected to account for the change in apparent sample-to-detector distance caused by the finite sample thickness. A diffraction image of the ambient forsterite poly-crystal is used to approximate the uncertainty in the 2θdiffraction angle by comparing the observed forsterite diffraction angles to the theoretical diffraction angles. The calculated residual squared error implies uncertainties in the 2θdiffraction angle of 1%. The calibration for driven forsterite samples is further corrected to account for movement of the sample center of mass along the gun axis using the known particle velocity in the shock state.
To determine the thermodynamic state of the sample during each pulse of the x-ray source, the timing of the synchrotron relative to the observation of shock breakout
into the LiF is recorded on an oscilloscope (additional timing corrections are applied to account for known system delays). In both shots, the first frame was observed prior to breakout into the LiF so that a portion of the sample was shocked and the remainder unshocked. The proportion (by mass) of shocked and unshocked material was calculated using the known shock velocity and sample thickness. The second frame was observed after breakout into the LiF, so that a portion of the sample was shocked and the remainder partially released into LiF. The proportion of shocked and partially released material was calculated using the sound velocity in forsterite, sample thickness, and Hugoniot compression (Brown, Furnish, and Boness, 1987;
Duffy and Ahrens, 1992). The sample states probed during the first two x-ray pulses are tabulated in Table 2.2.
2.3 Results
Full density polycrystalline forsterite was shock compressed to pressures of 44.6(6) GPa and 73.4(7) GPa. At 44.6(6) GPa we recorded two diffraction images prior to release to ambient pressure, which showed diffraction peaks consistent with forsterite compressed to the Hugoniot density. The processed diffraction image for frame 2 (where the sample was predominantly in the shock state) are shown in Figure 2.7. Figure 2.8 shows the progression of the observed diffraction, where each frame is separated in time by 153.4 ns. The observed lineouts are compared to the theoretical lineouts for the mixture of crystal structures and thermodynamic states that are presumed to exist in each frame. Lattice parameters for the forsterite and forsterite III structures are taken from power law fit to the 300 K isothermal data to determine the lattice parameter as a function of volume (Finkelstein et al., 2014).
Two peaks not identified as compressed forsterite are indexed as diffraction from the (131) and (132) planes of the forsterite III structure. The density of the forsterite III structure inferred from the diffraction peaks is roughly 10 percent more dense than the forsterite structure, consistent with previous observations of the equation of state of forsterite and forsterite III (Finkelstein et al., 2014). Matching the relative intensity of the (112) forsterite peak and (131) forsterite III peak would suggest a mixture of 3 parts forsterite to 1 part forsterite III. Therefore, the error we make by using the Hugoniot density to index the forsterite diffraction peaks is small (on the order of 2%) since the mixture is composed mostly of forsterite.
Upon shock compression to 74.8 GPa, we observed diffraction consistent with com- plete transformation to the forsterite III structure, which suggests that the nature of the mixed phase region corresponds to a diffusion free phase transition to Forsterite
III. Figure 2.7 shows the processed diffraction data for frame 2 and 2.9 shows the pro- gression of the observed diffraction lineouts compared to the theoretical diffraction from the forsterite III structure at the relevant density.
A comparison of the observed diffraction to the expected diffraction for periclase is shown in Figure 2.10. We fit lattice parameters to the observed diffraction peaks using the Hugoniot density as an initial guess for the forsterite structures and the periclase 3000 K isotherm as an initial guess for periclase. The 3000 K isotherm was chosen as that represents a reasonable estimate of the temperature on the forsterite Hugoniot at these pressures based upon the available data (Luo, Akins, and Asimow, 2004; De Koker and Stixrude, 2009). The resultant densities showed good agreement (<3% error) to the forsterite structures and poor agreement to periclase (>15% error) as shown in Figure 2.11. The lineouts fit to the forsterite structure are plotted in Figure 2.12 and the lattice parameters are tabulated in Table 2.3.
Our results show that the previously described “low pressure” Hugoniot regime corresponds to compression of the forsterite lattice and that the nature of the density collapse at 50 GPa is a deformational phase change to the metastable forsterite III structure. The deformation seems to correspond to stretches of the principle a, b, and c forsterite lattice parameters by 12, 2, and 1 to produce the forsterite III c, a, and b lattice parameters accompanied by a volume collapse of ∼ 10%. We do not observe the equilibrium phase assemblage of periclase and bridgmanite in the diffraction pattern, consistent with the shock recovery results of Jeanloz et al., 1980 but in disagreement with the recovery experiments of Syono et al., 1981. This suggests that MgO crystallization may not have occurred in the shock state or that additional heat was generated due to the geometry of the recovery capsule speeding up diffusion.
Our result confirms that crystallization of periclase is not feasible under the mi- crosecond timescales of the experiment, which provides insight into the nature of the shock state. First, this indicates localized melting is not activated by the shock process at these pressures as periclase would readily nucleate based on reason- able liquid diffusivities (De Koker, Stixrude, and Karki, 2008). Second, this work bounds the grain boundary diffusivity of forsterite below 1 nm2 µs−1at the elevated pressures and temperatures probed in these experiments.
2.4 Conclusions
This work provides the first in situ observation of forsterite under uniaxial plate impact conditions. We found that solid state decomposition into the equilibrium phase assemblage (periclase and bridgmanite) is not possible under the kinetic constraints imposed by the experiment, but rather metastable structures persist at the elevated Hugoniot pressures and temperatures. The structures that we observed are in good agreement with the structures observed at ambient temperature in diamond anvil cells (Finkelstein et al., 2014). Absence of the periclase structure suggests that localized melting does not occur in the material processed by the shock and that the grain boundary diffusivity of forsterite at these conditions is less than previously theorized based on extrapolations from data at lower pressure (H. Fei, 2013). Future work observing the crystal structure or structures of forsterite in situ at higher pressure would be valuable to determine the nature of the density change along the Hugoniot observed at 120 GPa.
Plate impact experiments provide a platform to observe the properties of geological materials at the pressure and temperatures that are relevant to the deep interior of the Earth. However, the results of this paper illustrate that kinetics and not equilibrium can dictate the observed equation of state and material properties on microsecond timescales for multi-component systems that may phase segregate.
Shot PShock(GPa) ρShock(g cm−3) PRelease(GPa) ρRelease(g cm−3)
084 44.6(7.0) 4.06(0.2) 38.4(8.0) 3.96(0.4)
085 73.4(9.0) 4.57(0.2) 66.2(10.0) 4.46(0.4)
Table 2.1: Shock States Achieved In Each Experiment. Tabulation of the shock and release pressures and density determined from the measured interface veloc- ity from PDV. The densities are used to compare theoretical diffraction from the forsterite and forsterite III structures to the observed diffraction pattern.
Shot X-ray time (ns) Ambient Fo Shocked Fo Partially Released Fo
084 -103.6 64.4 35.6 0
084 49.8 0 76.8 23.2
085 -128.9 44.8 55.2 0
085 24.5 0 53.9 46.1
Table 2.2: Relative mass percent of states probed by x-rays. Tabulation of the sample conditions determined from the x-ray probe time relative to shock breakout into LiF (column 2) and known shock velocities and sound speeds in forsterite (Duffy and Ahrens, 1992; Brown, Furnish, and Boness, 1987). X-rays timed before shock breakout probe both shocked and unshocked forsterite states, while x-rays timed after shock breakout probe both shock states and partially released states.
Shot Structure a b c V
084 Fo 4.4917 9.0967 5.5875 228.30 085 Fo III 2.6415 8.5829 8.7457 198.28
Table 2.3: Lattice parameters fit to the diffraction data. Lattice parameters for the forsterite and forsterite III structures observed in shots 084 and 085 respectively.
Figure 2.1: Qualitative equilibrium phase diagram for the MgSiO3-MgO sys- tem. This phase diagram shows that at all pressures above 23 GPa there are no thermodynamically stable single component crystal structures of forsterite com- position. At the pressures and temperatures relevant to this study, forsterite will decompose to bridgmanite (Bd) and periclase (Pe) in equilibrium.
typical crack deepest
crack
Figure 2.2: A reconstructed computed tomography slice of a forsterite sample.
Computed tomographic analysis was conducted to determine the porosity of the forsterite samples and search for internal voids/cracks. The “deepest” crack ap- proaches closer to the sample center than any other observed CT images. Samples were oriented in the DCS target chamber so that the x-ray beam path avoids cracks where possible. Voxel size is 6 µm.
Figure 2.3: Electron backscatter diffraction (EBSD) characterization of forsterite polycrystalline samples. Electron backscatter diffraction was conducted to determine the grain size, orientation, and composition of a characteristic forsterite sample. Top: Grain map of forsterite sample indicating a characteristic grain size of ∼ 10 µm. All identified grains were indexed as forsterite, with no evidence of periclase or bridgmanite by comparing the observed diffraction pattern to the the- oretical one for these structures. Bottom: Pole figure illustrating that the observed grain orientations are approximately random.
Figure 2.4: Forsterite Hugoniot data used to determine the shock pressure and density. Plot of the available data of the forsterite Hugoniot in pressure versus density space (top) and shock velocity versus particle velocity (bottom). For shot 084 (below 50 GPa) we used the linear Us-up relationUS = 6.43+1.06upand for shot 085 (above 50 GPa) we usedUS =6.46+0.905upto determine the shock state through impedance matching. This work attributes the change in density observed on the Hugoniot above 50 GPa to a phase transition from the forsterite structure to the metastable forsterite III structure.
Figure 2.5: Timing of plate impact experiment. Photon doppler velocimetry (PDV) lineouts of the true interface velocity between the forsterite sample and LiF window. The initial velocity plateau corresponds to shock breakout into the LiF window, while the subsequent velocity plateau corresponds to release to 0 pressure from the LiF free surface. The asterisks correspond to the timing of the x-ray source, indicating that in each experiment we observed one frame prior to shock breakout into the LiF window and one frame prior to release to 0 pressure.
Figure 2.6: Beam configuration for in situ x-ray diffraction measurements. The sample is rotated by 28◦with respect to the beam normal so that the beam path does not probe laterally released states. The path of the beam penetrates the lexan sabot, LiF window, quartz driver, forsterite sample, and forsterite window. The driver and window materials are chosen to minimize x-ray attenuation. Diffracted x-rays are collected every 153.4 ns on an LSO scintillator coupled to a four frame imaging system.
Figure 2.7: Diffraction data for shocked forsterite. Diffraction data is dewarped into the diffraction coordinates 2θ-φ. The powder peaks correspond to diffraction from the shocked polycrystalline forsterite. The masked out regions (black) corre- spond to single-crystal like diffraction from the LiF window and do not represent diffraction from the forsterite sample. Top: diffraction pattern for forsterite shocked to 44.6(7.0) GPa. Bottom: diffraction pattern for forsterite shocked to 73.4(9.0) GPa.
Figure 2.8: X-ray diffraction lineout for forsterite shocked to 44.6(7.0) GPa and released to 38.4(8.0) GPa. Experimental lineout (red) compared to the theoretical lineout (black) for a mixture of shocked and released forsterite and forsterite III.
The red blue and green data points indicate diffraction peaks for ambient forsterite, compressed forsterite, and compressed forsterite III respectively with a threshold of 10%. The lattice parameters for forsterite and forsterite III are determined by power law fit to the isothermal diamond anvil cell data. Therefore the theoretical diffraction assumes that temperature does not distort the ratios of the lattice parameters. The ratio of forsterite to forsterite III is determined to be 3 to 1 by fitting the theoretical lineout to the data to give the correct relative intensity of the (112) forsterite peak and the (131) forsterite III peak.
Figure 2.9: X-ray diffraction lineout for forsterite shocked to 73.4(9.0) GPa and released to 66.16(10.0) GPa. Progression of experimental lineouts (red) compared to the theoretical lineouts (black) of the forsterite III structure. The red and green data points indicate diffraction peaks for ambient forsterite and compressed forsterite III with a threshold of 10%.
Figure 2.10: Comparison of observed diffraction to expected diffraction from periclase. Diffraction from the periclase structure at the pressures and temperatures relevant to the forsterite Hugoniot are compared to the diffraction data observed in shot 084 frame 2 (bottom) and shot 085 frame 2 (top). The asterisks (bottom) corre- spond to diffraction peaks not already indexed as diffraction from shock compressed forsterite.
Figure 2.11: Comparison of expected density to density inferred from the diffraction pattern. The density of periclase, forsterite, and forsterite III are com- pared to the expected values based upon the previously measured forsterite Hugoniot and the 3000 K periclase isotherm from equations of state (Tange, Nishihara, and Tsuchiya, 2009; Wu et al., 2008). The density required to fit the periclase structure is well outside the uncertainty in the periclase isotherm while the forsterite structures are in good agreement with the Hugoniot density.
Figure 2.12: Lineouts fit to the diffraction data for shot 084 frame 2 (top) and shot 085 frame 2 (bottom). Lattice parameters were fit to the observed diffraction data (Table 2.3) using the Hugoniot density and ambient temperature crystal structure from Finkelstein as an initial guess. The resulting fits are slightly more dense than expected from the Hugoniot bulk density, but well within uncertainties (< 3%).
References
Adjaud, O., G. Steinle-Neumann, and S. Jahn (2011). “Transport properties of Mg2SiO4liquid at high pressure: Physical state of a magma ocean”. In:Earth and Planetary Science Letters312, pp. 463–470.
Asimow, P. (2017). “A measure of mantle melting”. In:Science355, pp. 908–909.
Brown, M., M. Furnish, and D. Boness (1987). “Sound velocities for San Carlos olivine”. In:Shock Waves in Condensed Matter, pp. 119–122.
Coppari, F. et al. (2013). “Experimental evidence for a phase transition in magnesium oxide at exoplanet pressures”. In:Nature Geoscience6.11.
De Koker, N., B. Karki, and L. Stixrude (2013). “Thermodynamics of the MgO-SiO2 liquid system in Earth’s lowermost mantle from first principles”. In:Earth and Planetary Science Letters361, pp. 58–63.
De Koker, N. and L. Stixrude (2009). “Self-consistent thermodynamic description of silicate liquids, with application to shock melting of MgO periclase and MgSiO3 perovskite”. In:Geophysical Journal International178.1, pp. 162–179.
De Koker, N., L. Stixrude, and B. Karki (2008). “Thermodynamics, structure, dy- namics, and freezing of Mg2SiO4 liquid at high pressure”. In: Geochimica et Cosmochimica Acta72, pp. 1427–1441.
Duffy, T. and T. Ahrens (1992). “Sound velocities at high pressure and temperature and their geophysical implications”. In:Journal of Geophysical Research: Solid Earth97.B4, pp. 4503–4520.
Fei, H. (2013). “Silicon and oxygen self-diffusion in forsterite and implications to upper-mantle rheology”. PhD thesis.
Fei, Y. et al. (2004). “Experimentally determined postspinel transformation bound- ary in Mg2SiO4 using MgO as an internal pressure standard and its geophysical implications”. In:Journal of Geophysical Research: Solid Earth109.B2.
Finkelstein, G. et al. (2014). “Phase transitions and equation of state of forsterite to 90 GPa from single-crystal X-ray diffraction and molecular modeling”. In:
American Mineralogist99.1, pp. 35–43.
Gleason, A et al. (2015). “Ultrafast visualization of crystallization and grain growth in shock-compressed SiO2”. In:Nature communications6.
Hawreliak, J et al. (2007). “High pressure nano-crystalline microstructure of shock compressed single crystal iron”. In:Physical Review B78.UCRL-JRNL-237258.
Jackson, I. and T. Ahrens (1979). “Shock-wave compression of single crystal forsterite”. In:Journal of Geophysical Research84, pp. 3039–3048.
Jeanloz, R. (1980). “Shock effects in olivine and implications for Hugoniot data”.
In:Journal of Geophysical Research: Solid Earth85.B6, pp. 3163–3176.