Chapter 1. Introduction
Problem statement and significance
Therefore, acid degradation of semi- and fully-aromatic PA membranes should be considered for the use of the above processes that have an acidic state of less than pH 2. Evidence for acid degradation of PA membranes was suggested by greatly increased water flux and reduced salt/target rejection .
Objectives of this work
Scope of this work
Outline of this work
The degree of twist angle (τ) was calculated by computer modeling method and reported by several researchers [35-39]. Membrane surface zeta potential measurement was performed by electrophoresis method to elucidate the effect of acid degradation on membrane surface charge.
Chapter 2. Background and literature review
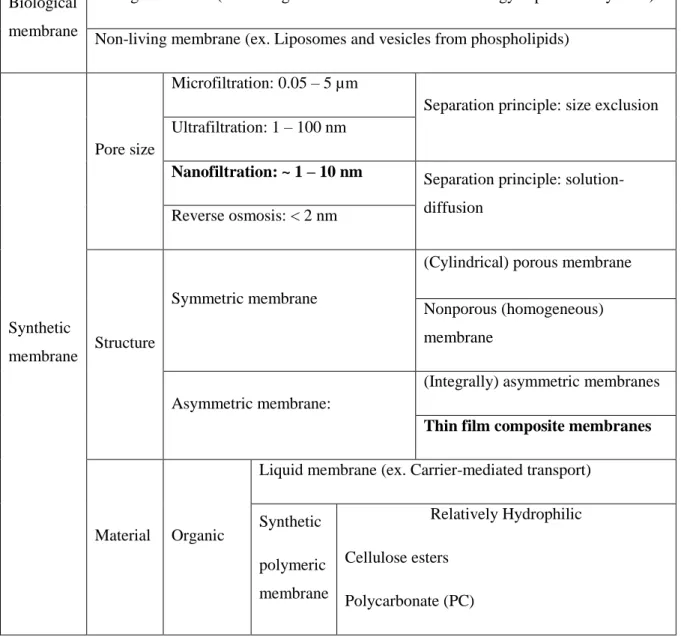
Classification of membrane
Pressure-driven process
When the feed solution is applied perpendicular to the membrane, it enables rapid separation of target compounds, as shown in Fig. showed. However, dead-end filtration leads to an easy build-up of fouling phenomenon on the membrane surface, which leads to a serious decrease of water flux [30].
Polyamide (PA) membrane
- Cross-sectional structures of TFC PA membrane
- Interfacial polymerization
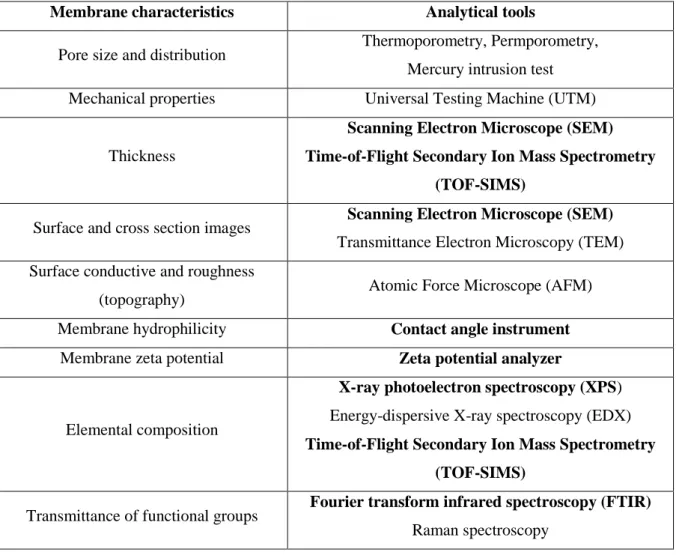
- Characterizations of polyamide membrane
- Scanning electron microscopy (SEM)
- Attenuated total reflectance-Fourier transform infrared spectroscopy
- X-ray photoelectron spectroscopy (XPS)
- Contact angle
- Zeta potential (ζ)
- Time-of-flight secondary ion mass spectrometry (ToF-SIMS)
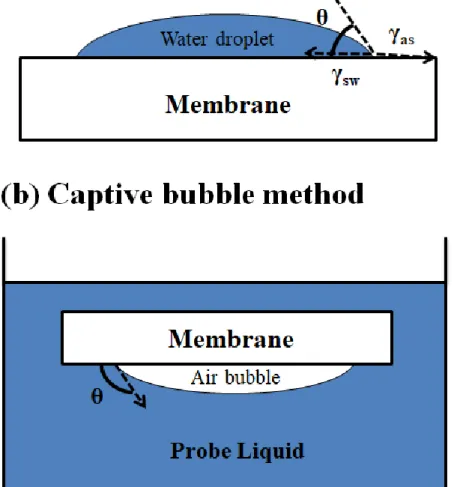
A common method for measuring membrane hydrophilicity is based on measuring contact angle values using (1) the entrapped bubble method, which uses air bubbles on a submerged membrane, and (2) the sessile drop method, which measures the deposition of a liquid droplet on the membrane. membrane surface [63]. Increasing membrane surface hydrophilicity can improve permeate flux/rejection in a pressure-driven process.
![Figure 2.2 The three main Lewis structure of amide group using resonance model [33].](https://thumb-ap.123doks.com/thumbv2/123dokinfo/10518516.0/33.892.184.760.346.520/figure-lewis-structure-amide-group-using-resonance-model.webp)
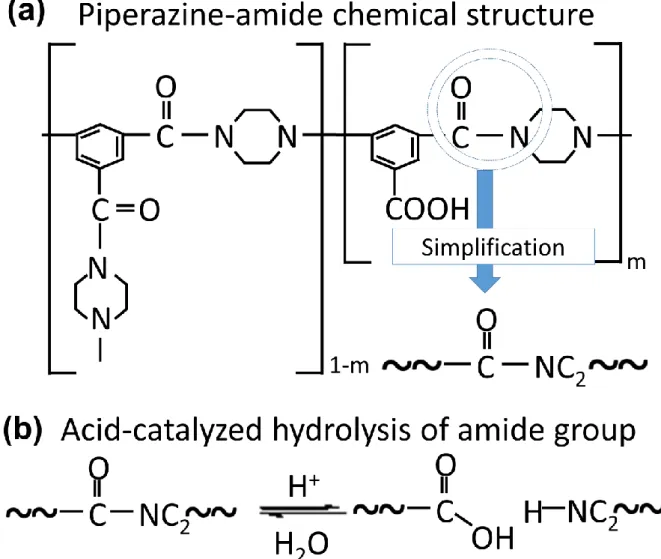
Acid-catalyzed hydrolysis of amide group
81], the second and third steps of the hydrolysis reaction were combined into the same transition state to calculate the polyacrylamide polymer using the density functional theory (DFT) computational modeling method (Fig. 2.21).
Acidic degradation of PA membranes
Top surface images of the membranes were observed using Scanning Electron Microscopy (SEM) (Quanta 200, FEI, Hillsboro, OR, USA) to investigate the effect of acid soaking on the surface. ATR-FTIR spectra were measured to investigate the effect of acid solution on NF membranes. A ToF-SIMS experiment was also performed to elucidate acid-catalyzed hydrolysis of the polyamide bond.
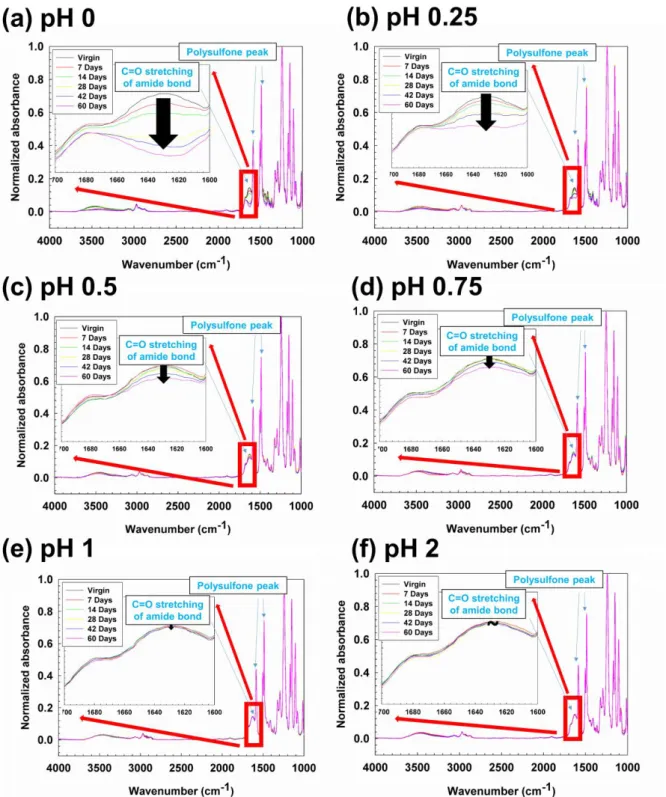
ATR-FTIR spectra of untreated NE70 and post-treated membranes were measured to investigate the effect of post-treatment on membrane chemical structure. The water flow and salt rejection of membranes exposed to different acid strengths and exposure times are shown in Fig.
![Table 2.4 Permeability after exposure to various acidic conditions during 0 to 4 months for NF-45 membranes [18]](https://thumb-ap.123doks.com/thumbv2/123dokinfo/10518516.0/58.892.115.783.406.578/table-permeability-exposure-various-acidic-conditions-months-membranes.webp)
Chapter 3. Study on acid-catalyzed hydrolysis of polyamide NF membranes in terms of
Introduction
For example, in the twisted lactams case, N-protonation of the amide bond increases the distortion and length of the C-N bond [40], causing destabilization of the bond [34]. That is, the amide hydrolysis reaction of the first step can proceed through either an O-protonated or N-protonated pathway, depending on the species of amide (undeformed amides are highly protonated at the oxygen) [38]. This second step of the amide hydrolysis reaction is known as the rate-determining step (RDS) for the acid-catalyzed hydrolysis [39].
As described above, the stability of the amide bond is affected by the resonance between the nitrogen lone pair electrons and the πCO carbonyl bond electrons [34]. That is, the degree of distortion of the amide C-N bond is closely related to the rate of amide hydrolysis.
Materials and methods
- Chemicals and materials
- Characterization of membranes
- Scanning electron microscopy (SEM)
- X-ray photoelectron spectroscopy (XPS)
- Contact angle
- Zeta potential
- Time-of-flight secondary ion mass spectrometry (ToF-SIMS)
- Permeation experiments of membrane soaked in acid
- Computational calculation methods
- Calculation details
- Model systems
- Out-of-plane deformation and energy calculations
Fragments of the polymer before and after the acid soaking test were detected using Time-of-Flight Secondary Ion Mass Spectrometry (ToF-SIMS) (TOF.SIM5, ION-TOF GmbH, Germany) in both positive charge and negative charge modes with a bismuth gun ( Bi+). The ToF-SIMS spectra of the secondary ions were measured over mass ions (m/z) ranging from 0 to 100 or 120 in positive and negative mode, respectively. The peak intensities of the secondary ions were normalized by total ion intensities detected in the spectrum to perform qualitative comparison.
ΔE represents the energy difference between the energy of the system at each step and the energy in step 1 (Fig. By defining U' with degrees of freedom of motion (ie vibration (vib.), rotation (rot.) and translation (translation) .)), the equation ( 3.6) is rewritten as follows.
Results and discussion
- Characterization of membrane soaked in acid
- Effect of sulfuric acid on morphology (SEM)
- Chemical surface property change of polyamide NF membrane by sulfuric
- Effect of sulfuric acid on hydrophilicity and surface charge of polyamide NF
- Permeation of the virgin and hydrolyzed membranes
- Computational analysis to interpret degradation of NE70 and NE90
56 fragments out of a total of 64 (about 88%) linked to amine and carboxyl groups increased in intensity after exposure of the NE70 membrane to sulfuric acid for 7 days. Similarly, the contact angle value of NE40 and NE70 membrane sample monotonically decreased with acid soaking up to 14 or 28 days because the number of amine and carboxyl groups increased by acid-catalyzed amide bond hydrolysis, as shown in the ToF-SIMS result (Figure 3.4 ). The NE70 PA membrane surface became more negative below the isoelectric point (IEP, ~ pH 4) and positive above the IEP due to the protonation and deprotonation of the carboxyl and amine groups of piperazine, respectively [111].
We report that the lower energy barrier rate of NE70(N) well compensates for the higher value of NE70(O). Finally, the deformation of the C-N bond was an exothermic reaction (Step 3 to Step 4 in Fig.
Conclusions
To investigate the effect of acid degradation on surface morphology, surface images of the NE90 virgin and degraded membranes were measured using a Field Emission-Scanning Electron Microscopy (FE-SEM) (Cold FE-SEM SU8000, Hitachi, USA). All membrane samples were simultaneously vacuum dried under the same conditions. The surface zeta potentials of NE90 and degraded membranes were analyzed by electrophoresis method to investigate the effect of acid degradation on the membrane surface charge according to our previous work [6].
The surface morphology of the fully aromatic NE90 virgin and degraded membranes was characterized by SEM images. Surface images of the virgin and post-treated membranes were obtained using a Field Emission Scanning Electron Microscope (FE-SEM) (Cold FE-SEM SU8000, Hitachi, USA) to investigate the effect of post-treatment on membrane surface morphology.
Chapter 4. Investigation of degradation by sulfuric acid and hydrogen halides on full-
Introduction
However, high-quality commercial NF fully aromatic PA membranes, which are manufactured by MPD with TMC, are limited in the range of pH 2 to 11 [24]. Therefore, additional research on the degradation of fully aromatic PA membrane by acid is needed to apply the above-mentioned processes that have an acidic state less than pH 2. However, to the best of our knowledge, there are the effects of acid degradation on the entire aromatic membrane when using different pH values.
Because the spectral interpretation of polymeric materials is quite difficult, benzanilide can be used for the model compound of fully aromatic PA membrane [114]. In this work, systematic physicochemical characterization was performed to elucidate the effect of degradation by sulfuric acid in the range of pH 0 to 2 as well as hydrogen halides at pH 0 on the fully aromatic membrane.
Materials and methods
- Chemicals and materials
- Membrane degradation protocol
- Characterization of membranes
- Scanning electron microscopy (SEM)
- Attenuated total reflectance-Fourier transform infrared spectroscopy (ATR-
- X-ray photoelectron spectroscopy (XPS)
- Contact angle
- Zeta potential
- Filtration tests
The surface zeta potentials of the wet membrane samples were measured by electrophoretic light scattering spectrophotometer (ELS-8000, Photal, Otsuka Electronics, Japan). An attenuated Total Reflectance-Fourier Transform Infrared spectroscopy was used for the analysis of the influence of post-treatment on the chemical properties of the membranes. The MWCO values of the virgin and post-treated membranes were obtained by the method reported in previously published articles.
108] studied the effect of surface charge on the hydrophilicity of a membrane surface and showed that hydrophilicity increases when the surface of the membrane is positively or negatively charged. Lipowitz, "Acid-catalyzed amide hydrolysis assisted by a neighboring amide group," Journal of the American Chemical Society, vol.
Results and discussion
- Characterizations of degraded membranes
- Effect of degradation by acid on surface morphology (SEM)
- Effect of degradation by acid on change of membrane surface’s chemical
- Effect of degradation by acid on change of membrane surface’s
- Effect of degradation by sulfuric acid (pH 0 to 2) on permeability properties 83
Chapter 5. Acid-catalyzed hydrolysis of semi-aromatic polyamide NF membrane and its
Introduction
During the hydrolysis reaction of the amide group, the C-N piperazine-amide bond breaks, causing depolymerization of the amide group into carboxyl and amine groups [32, 80]. In addition, modification by acid-catalyzed hydrolysis can adjust the pore size of the membrane for specific purposes, such as enrichment of antibiotics. To apply NF membrane to the recovery of the antibiotics, the membrane should have a high rejection of antibiotics but a low rejection of salt.
Higher amounts of antibiotics retained in the feed side of the membrane due to the high repulsion minimize product loss, while the salt enrichment on the feed side causes a build-up of concentration polarization and osmotic pressure, subsequently decreasing solution permeability and overall energy efficiency [146]. In this work, the physicochemical properties of a commercial NF semi-aromatic polyamide TFC membrane were systemically investigated during the post-treatment of the membrane via acid-catalyzed hydrolysis under different acidic conditions.
Materials and methods
- Chemicals and materials
- Characterization of membranes
- ATR-FTIR and SEM
- Contact angle and zeta potential
- Molecular weight cut off (MWCO) and pore size of membranes
- Filtration tests
- Ideal selectivity and mixture selectivity
- Antibiotics separation and enrichment
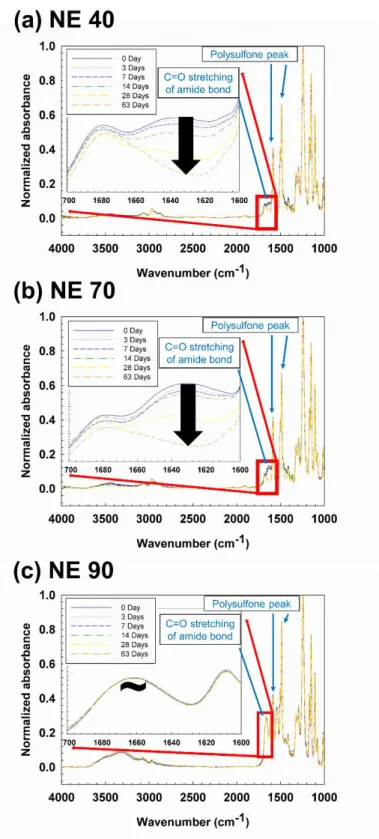
The thickness of the active layers was estimated based on the peak intensities of the C=O bond stretching (1634 cm-1) of semi-aromatic PA and the aromatic in-plane ring stretching vibration (1587 cm-1) of a polysulfone (PSf ) layer. support [92]. The surface zeta potentials of the membranes were measured three times with an electrophoretic light scattering spectrophotometer (ELS-8000, Photal, Otsuka Electronics, Japan). The MWCO value of the membrane was determined from the molecular weight of the neutral solute which had 90% rejection.
The concentration of neutral solute in the feed and permeate solutions was measured with a Total Organic Carbon analyzer (TOC-V, Shimadzu, Japan). Ideal selectivity is an intrinsic property of the membrane, and should be equal to mixture selectivity regardless of the mixture species' interaction with the membrane.
Results and discussion
- Characterization of virgin and post-treated membrane
- Effect of post-treatment on chemical structure of membrane and surface
- Effect of post-treatment on permeability and salt rejection
- Effect of post-treatment on hydrophilicity and surface charge (Contact angle
- Application of post-treated membrane to water softening
- Application of post-treated membrane in enrichment of antibiotics
The surface morphology of virgin and post-treated membranes was characterized by SEM images (Fig. 5.3). The performance of semi-aromatic PA NE70 virgin and post-treated membranes was measured in a pressure condition to investigate the effect of post-treatment on permeability and salt rejection. On the basis of NE70 virgin and post-treated membranes MWCO value as shown in fig.
5.8, NE70 virgin and post-treated membranes (pH 0.25 for 7 and 14 days) were chosen for antibiotic enrichment to minimize losses. The C𝑎𝑛𝑡𝑖𝑏𝑖𝑜𝑡𝑖𝑐𝑠𝑎𝑙𝑡 value was used to compare the amount of salt enrichment between virgin and post-treated membranes (Table. 5.7).
Conclusions
Benes, “pH stable thin-film composite polyamine nanofiltration membranes by interfacial polymerization,” Journal of Membrane Science , vol. Wessling, “Effect of pH on the Performance of Polyamide/Polyacrylonitrile-Based Thin-Film Composite Membranes,” Journal of Membrane Science , vol. Li, “Progress in the fabrication and modification of PVDF membranes,” Journal of Membrane Science , vol.
Nyström, “Fouling effects of polysaccharides and humic acid in nanofiltration,” Journal of Membrane Science , vol. Park, “Surface modification of polysulfone ultrafiltration membrane by oxygen plasma treatment,” Journal of Membrane Science , vol.
Chapter 6. Summary and conclusions
![Figure 1.1 The reaction scheme and procedure most commonly used for TFC NF membranes [10]](https://thumb-ap.123doks.com/thumbv2/123dokinfo/10518516.0/23.892.121.781.820.1061/figure-reaction-scheme-procedure-commonly-used-tfc-membranes.webp)
![Figure 2.1 Schematic diagram of (a) cross flow filtration and (b) dead–end filtration [30]](https://thumb-ap.123doks.com/thumbv2/123dokinfo/10518516.0/32.892.107.795.121.826/figure-schematic-diagram-cross-flow-filtration-dead-filtration.webp)
![Figure 2.10 Schematic illustration for the horizontal ATR accessory and formula to calculate penetration depth [59]](https://thumb-ap.123doks.com/thumbv2/123dokinfo/10518516.0/42.892.104.795.58.533/figure-schematic-illustration-horizontal-accessory-formula-calculate-penetration.webp)
![Table 2.3 Example of the common ATR crystals and their properties [59].](https://thumb-ap.123doks.com/thumbv2/123dokinfo/10518516.0/42.892.113.832.781.1099/table-2-example-common-atr-crystals-properties-59.webp)
![Figure 2.11 Schematic illustration for the XPS process, which shows photoionization of an atom from a 1s electron [61]](https://thumb-ap.123doks.com/thumbv2/123dokinfo/10518516.0/43.892.135.768.461.1028/figure-schematic-illustration-xps-process-shows-photoionization-electron.webp)
![Figure 2.12 Example of XPS survey spectrum from tin (Sn), which shows multiplet splitting peaks in p and d orbitals [61]](https://thumb-ap.123doks.com/thumbv2/123dokinfo/10518516.0/44.892.156.758.556.1057/figure-example-survey-spectrum-shows-multiplet-splitting-orbitals.webp)