Characterization of Cu/ZnO Catalysts from a Methanol Plant
By
Wan Norafiza binti W. Othman
(2887)
Dissertation submitted in partial fulfillment of The requirement for the
Bachelor of Engineering (Hons) (Chemical Engineering)
NOVEMBER 2005
Universiti Teknologi PETRONAS,
Bandar Bam Scri Iskandar, 31750Tronoh,
Perak
PUSAT SUMBER MAKLUMAT UNIVERSITI TEKNOLOGI PETRONAS
UNIVERSITITEKNOLOGI PETRONAS Information Resource Center
IPB180990
-t
•CIS
c^\^ v*">^
7- Cc\*V
3. c^-IU
CERTIFICATION OF APPROVAL
Characterization of Cu/ZnO Catalysts from a Methanol Plant
By
Wan Norafiza W. Othman
A Project dissertation submitted to the Chemical Engineering Programme Universiti Teknologi PETRONAS
In partial fulfillment of the requirement for the
BACHELOR OF ENGINEERING (Hons) (CHEMICAL ENGINEERING)
Approved by,
%u* y
(A.P. DR. NOOR ASMAWATIM. ZABIDI)
Universiti Teknologi PETRONAS,
Bandar Baru Seri Iskandar, 31750 Tronoh, Perak Darul Ridzuan
27 October 2005
--1 *.
CERTIFICATION OF ORIGINALITY
This is to certify that I am responsible for the work submitted in this project, that the original work is my own except as specified in the references and acknowledgements, and that the original work contained herein have not been undertaken or done by
unspecified sources or persons.
(WAN NORAFPZA W. OTHMAN)
ABSTRACT
The main objectives of this project are to study the physical and chemical properties of fresh and spent catalysts, to identify the type of decays which led to the catalysts deactivation, and to propose the best handling option of the spent catalyst that is economical and environmental friendly, based on the causes of catalyst decay. Samples of fresh and spent Cu/ZnO catalysts were obtained from Petronas Methanol Plant in Labuan. The properties of catalysts studied were the reduction and oxidation profiles, BET surface area, density, morphology, phase changes as well as the chemical contents.
Series of experiments were conducted using equipment such as Temperature Programming Desorbtion, Reduction and Oxidation (TPDRO), Carbon, Hydrogen, Nitrogen, and Sulphur Analyzer (CHNS), Scanning Electron Microscope (SEM), Energy Dispersive X-ray (EDX), X-ray Diffraction Unit (XRD), Pycnometer and
Fourier Transform Infrared Spectrometer (FTIR).
The BET surface area was 109.48 m2/g and 71.15 m2/g for fresh and spent catalysts respectively. The results showed that sulfur and carbon exist in the fresh and spent catalysts. Results of SEM, TPR and TPO analyses showed that the spent catalysts experienced thermal sintering. The spent catalyst cannot be regenerated because of the changes in its physical and chemical properties. The best handling option proposed is disposal and prevention of the catalysts life degradation is preferred because the
decayed catalysts cannotbe reused.
ACKNOWLEDGEMENT
I would like to express my greatest appreciation to the Project Supervisor, A.P. Dr.
Noor Asmawati M. Zabidi for the guidance and advices. Your full encouragement did not only tune my mind to the new dimensional way of thoughts but also generate my mind to think critically. My deepest gratitude goes to all technicians who helped me
upon completing this project throughout the semester. There is no beautiful word to convey to all of you except thousands of thank you for the supports and co-operations.
IV
TABLE OF CONTENT
CERTIFICATION OF APPROVAL CERTIFICATION OF ORIGINALITY
ABSTRACT
ACKNOWLEDGMENT
1
ii iii iv
CHAPTER 1 INTRODUCTION
1.1 BACKGROUND OF STUDY
PROBLEM STATEMENT 1.2.1 Problem Identification
1.2.2 Significant of the Project
OBJECTIVE AND SCOPE OF WORKS
1.2
1.3
CHAPTER 2: LITERATURE REVIEW AND THEORY
METHANOL PROCESS FLOW DESCRIPTION CATALYSTS FAILURE
2.2.1 Thermodynamics of Adsorption and
Segregation
Adsorbate-Induced Surface Modification
Surface Segregation and Interfacial Support
DEACTIVATION MODES 2.3.1 Thermal Sintering
Carbon Deposition (Coking) Sulfur Poisoning
Chloride Poisoning
Other Poisons
Physical Damages
CHAPTER 3:
2.1 2.2
2.3
2.2.2 2.2.3
2.3.2 2.3.3 2.3.4 2.3.5 2.3.6
2.4 HANDLING OPTIONS
METHODOLOGY
3.1 PROJECT METHODOLOGY
3.2 TOOLS AND EQUIPMENT
3.3 TEST PROCEDURES FOR PHYSICAL
PROPERTIES
3.3.1 XRD
3.3.2 SEM
3.3.3 Pycnometer
3.4 TEST PROCEDURES FOR CHEMICAL
PROPERTIES
3.4.1 SEM/ EDX
3.4.2 FTIR
8 9
9 9 9 11 11 12 14 14 15
17 18
19 19 19 19
20 20 20
3.4.3 CHNS 20
3.4.4 TPR 21
3.4.5 TPO 21
CHAPTER 4: DISCUSSION AND RECOMMENDATION
4.1 PHYSICAL PROPERTIES OF CATALYST 22
4.1.1 XRD 22
4.1.2 SEM 23
4.1.3 TPR and TPO
(Metal and BET Surface Area) 25
4.1.4 Pycnometer 25
4.2 CHEMICAL PROPERTIES OF CATALYSTS 26
4.2.1 SEM/EDX 26
4.2.2 FTIR (Fourier Transform Infrared) 28
4.2.3 CHNS Analysis 29
4.2.4 TPR Analysis 30
4.2.5 TPO Analysis 32
4.2.6 TPR and TPO 33
CHAPTER 5: CONCLUSION
5.1 CONCLUSION 35
5.2 RECOMMENDATION FOR FUTURE WORKS 35
REFERENCES 37
VI
LIST OF FIGURES
Figure 2.1 Simplified process flow diagram of methanol processing in PML
Figure 2.2 Relative activities of typical copper/ zinc oxide under poisons free
conditions
Figure 2.3 Effect of activity of very small amount of HCl onwater-gas-shift activity
ofaCu/ZnO/Al203 Figure 3.1 Project Methodology
Figure 4.3 Morphology of fresh catalyst, obtained from SEM analysis Figure 4.4 Morphology of spent catalyst, obtained from SEM analysis
Figure 4.5 Metal compositions of fresh catalystsFigure 4.6 Metal composition of spent catalyst
Figure 4.7 TPR profiles for fresh, spent and CuO standard sample Figure 4.8 TPO profiles for fresh, spent and CuO standard sample
LIST OF TABLES
Table 2.1 Melting points of copper, iron, nickel and some other compounds
Table 3.1 Equipment used in catalyst characterizationTable 4.1 XRD results
Table 4.2 Surface characterization
Table 4.3 Summary of Pycnometer result
Table 4.4 FTIR results
Table 4.5 Summary of TPR result Table 4.6 Summary of TPO results
Table 4.7 Summary of TPR and TPO results
v n i
APPENDICES
APPENDIX 2-1: CATALYST COMPOSITION APPENDIX 3-1: GANTT CHART
APPENDIX 3-2: PICTURES OF EQUIPMENT USED APPENDIX 4-1: XRD RESULT FOR FRESH CATALYST APPENDIX 4-2: XRD RESULT FOR SPENT CATALYST
APPENDIX 4-3: SURFACE CHARACTERIZATION OF FRESH CATALYST APPENDIX 4-4: SURFACE CHARACTERIZATION OF SPENT CATALYST
APPENDIX 4-5: PYCNOMETER RESULT FOR FRESH CATALYSTAPPENDIX 4-6: PYCNOMETER RESULT FOR SPENT CATALYST
APPENDIX 4-7: COMPLETE SEM/ EDX RESULT FOR FRESH CATALYST APPENDIX 4-8: COMPLETE SEM/ EDX RESULT FOR SPENT CATALYST
APPENDIX 4-9: FTIR RESULT FOR FRESH CATALYSTAPPENDIX 4-10: FTIR RESULT FOR SPENT CATALYST
CHNS RESULTS
TPR PROFILES FOR FRESH CATALYST TPR PROFILES FOR SPENT CATALYST TPO PROFILES FOR FRESH CATALSYT TPO PROFILES FOR SPENT CATALYST APPENDIX 4-11
APPENDIX 4-12 APPENDIX 4-13 APPENDIX 4-14 APPENDIX 4-15
CHAPTER 1
INTRODUCTION
1.1 BACKGROUND OF STUDY
Twenty years ago, methanol synthesis was carried out at higher pressure (20-40 MPa) and higher temperatures (300-400°C) over ZnO/Cr203 catalysts. The fundamental methanol catalyst is ZnO, whereas Cromia acts as a stabilizer. The lowering of synthesis temperature and pressure was made possible by application of copper containing-catalysts with an activity about 100 times higher than the original catalysts [1]. However, methanol is currently produced from CO-rich synthesis gas (CO/CO2/H2) using a ternary Cu-Zn-Al oxide catalyst at 50-100 bar and 473-523 K. The conventional catalysts (ternary CuO-ZnO-A^Os catalyst) have been modified to improve the catalytic performance for methanol synthesis from the feeds. The CuO-ZnO catalysts have been widely modified with different metals such as chromium, zirconium, vanadium, cerium, titanium, gallium and palladium [2].
Historically, spent catalysts have been disposed off as landfill in approved dump sites.
However, catalysts could be disposed off into landfill only if it could be proven with certainty that the landfill met non-hazardous criteria [3]. Currently, a few technologies have been developed to process the spent catalysts to reduce production cost. Although the spent catalyst can be processed, the nature of the processing depends markedly on the means of deactivation. The level of deactivation has to be determined before any treatment process or disposal can take place. Thus, the characterization of the catalysts plays an important role to the methanol industries, especially in economical aspects.
The three most common causes of catalyst decay are fouling, poisoning or thermal degradation. Fouling involves the deposition of material on catalyst surface which blocks the active sites. As a result, there will be less surface area for the reactions to
occur and leads to the decrease of product yield. One of the examples of impurities that might lead to catalyst fouling is the formation of coke deposition. The coke deposition occurs in the pores and/or on the surface of the catalysts [4].
Poisoning involves strong chemical interaction of a component of the feed or products with active sites on the catalyst surface. Sulfur poisoning of metal is the most widely quoted example, but depending on the catalyst, deactivation may be caused by a wide range of chemicals. The catalyst life might also be degraded by the thermal oversupplied during certain processing activities. Catalyst overheating can often lead to loss of surface area and unwanted chemical reactions. If a high temperature in the absence or presence of a suitable chemical environment arises, the catalyst will rearrange to form the more favorable lower surface area agglomerates, called sintering process [4].
In PETRONAS Methanol Plant (PML) which was commissioned in the middle of 1984, the feedstock to this plant is natural gas, which is 92% for processing and 8% for fuel.
The design capacity is 2000 metric tonnes per day and the operating product is the AA grade methanol. The PML uses LURG1 Low Pressure Combined Reforming Process (LPCR) for methanol production. The main processing units are;
• Steam Reforming
• Autothermal Reforming
• Methanol Synthesis
• Methanol Purification
[Source: Presentation Slide from Petronas Methanol Labuan]
1.2 PROBLEM STATEMENT
1.2.1 Problem Identification
Over period of time, the catalysts tend to degrade and the efficiency of reactions reduced due to some factors such as formation of impurities on the surface of catalysts and inside the catalysts' pores. The three most popular catalysts deactivation agents are sulfur, halogens and carbon deposits. These agents can cause decrease in surface tension of the catalyst (based on Gibbs adsorption isotherm rule), less contact area and weaker attraction with the reactants. These agents also can induce changes in surface morphology due to faceting, which results in preferential segregation of one component in a multi-component metal catalyst particle, enhance sintering as a result of adsorbate induced diffusional transport of metal surface components, and modify metal support interactions [1].
Large amount of money was spent to handle the spent catalysts from PML and also for purchasing new catalysts. The catalysts life only ended for 3 years normally, and then had to be disposed. Actually, there are few options in dealing with the spent catalysts.
The options could be disposal, regeneration, metal recovery and also utilization of spent catalysts as raw materials to produce other valuable products. However, initial prevention before the poisons or impurities disturb the catalyst performance is preferred. The best method of handling obviously relies on the cause of catalyst decay.
1.2.2 Significant of the Project
Some of the catalysts from a reactor can be reused or recovered depending on the degree of deactivation. Tests on the fresh and spent catalysts from the methanol synthesis reactor were conducted to compare the properties of the catalysts. The catalysts were characterized in terms of;
i. BET surface area ii. Metal surface area
iii. Mean particle diameter iv. Dispersion percentage
v. Oxidation and reduction temperature profiles
vi. Chemical contents such as carbon, nitrogen, hydrogen and sulfur
Based on the catalysts' characteristics, further studies could be carried out as the catalysts could be modified to enhance its performance for the maximum production yield, to recover some important metal components from the catalysts or to dispose the catalyst as a waste in most economical and safe ways.
1.3 OBJECTIVES AND SCOPE OF WORKS
The main objectives of this research project are:
• To study the physical and chemical properties of the fresh and spent catalysts from methanol plant
• To identify the factors that led to catalyst degradation or catalyst damage
• To identify and propose the best handling options based on the characteristics of the spent catalysts
This project involved identification of chemicals on the catalysts' surfaces and inside the catalysts' pores. Based on the physical and chemical properties of fresh and spent catalysts, it gives choices to the methanol industries the best option of handling the spent catalysts based on the economical and environmental aspects. From this project, the level of poisons on the catalysts can be determined.
Characterization of the spent catalyst from methanol plant significantly relates to the spent catalyst handling options. Conventionally, the spent catalysts were disposed as a landfill waste because there were no detailed studies conducted to determine the options either to recover the precious metal content or to convert the spent catalyst to valuable products. This project will give advantage to the methanol industries and also to the
people in societies in general. Just imagine if all the spent catalysts were disposed, there might be no more space for living. The surrounding area might be too hazardous because of the radioactive conditions from the metal waste, and the poisons of the spent catalysts itself.
CHAPTER 2
LITERATURE REVIEW AND THEORY
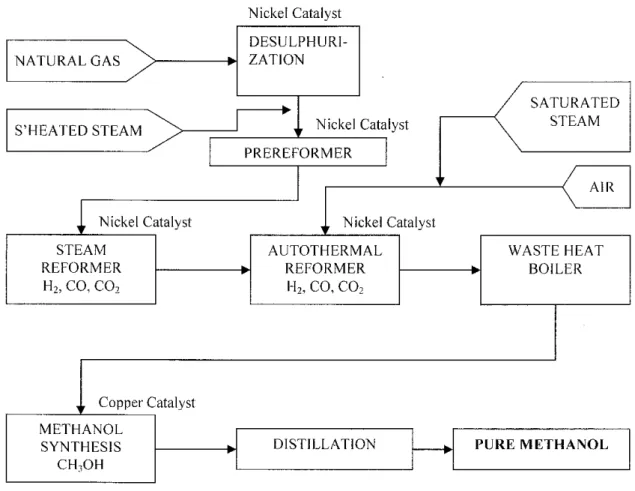
2.1 METHANOL PROCESSING FLOW DESCRIPTION
In PETRONAS Methanol Labuan (PML), the main processing units involved are steam reforming, autothermal reforming, methanol synthesis and methanol purification. The feed to this unit operation is the natural gas. The simplified process flow diagram of this process is shown in Figure 2.1.
NATURAL GAS
S'HEATED STEAM
Nickel Catalyst
STEAM REFORMER H2, CO, C02
Copper Catalyst METHANOL
SYNTHESIS CH^OH
Nickel Catalyst
DESULPHURI- Z ATI ON
Nickel Catalyst
PREREFORMER
Nickel Catalyst
AUTOTHERMAL REFORMER
H2, CO, C02
DISTILLATION
SATURATED STEAM
AIR
WASTE HEAT BOILER
PURE METHANOL
Figure 2.1: The simplified process flow diagram of the LURGI reforming process in Petronas Methanol Plant, Labuan (PML)
Basically, the LURGI (LPCR) process has the desulfurization unit to remove all sulfur in the feed whereby zinc oxide is used as the catalyst. Next, the output of the desulfurization unit will be fed to pre-reformer unit where nickel catalyst supports the prereforming reaction. Nickel is also used in the steam reformer unit and autothermal reformer unit before the product of the unit is fed to methanol synthesis unit to produce
methanol and water. The chemical reactions involved in this unit are as follows:
CO +2H2 -> 2CH3OH (aH(29, - -91 kJI'mol) (l) C02 +3H2 -+ CHyOH +H20 (a//£8 - -50 kJ Imol) (2)
This reaction is slightly exothermic and the equilibrium composition is affected by pressure. Theoretically, for the methanol process, a water-gas shift reaction also takes place [1];
CO +H20 -> C02 +H2 (Aff£8 - 41.2 kJ Imol) (3)
In PML, there are five units processing of reactions which involve catalysts consumption. The catalysts used are zinc oxide for desulfurization, nickel catalysts for pre-reformer, steam reformer and autothermal reformer, and copper catalysts for methanol synthesis. Over the years, PML spent a large amount of money for catalysts disposal and purchase of new catalysts since all the catalysts tend to degrade after certain time of processes.
The main concern here is to look at the copper catalysts, in the methanol synthesis unit.
The catalyst used is C79-5-GL, which comprise the Cu/ZnO and alumina. The compositions of this catalyst are listed in the Appendix 2-1.
2.2 CATALYSTS FAILURE DUE THE POISONS EXISTENCES
On metal surfaces, the presence of adsorbed species containing sulfur, carbon, and halogens are the most serious causes of catalysts poisoning. The presence of such foreign species on the catalyst surface not only can block reaction sites, but can induce changes in surface morphology due to faceting, which results in preferential segregation of one component in a multi-component metal catalyst particle, enhance sintering as result of adsorbate-induced diffusional transport of metal surface components, and modify metal support interactions [1].
2.2.1 Thermodynamics of Adsorption and Segregation
The thermodynamic properties of the surface adlayer interface play an important part in controlling the compositional and structural heterogeneities caused by catalysts poisoning. Equilibrium adsorption (or segregation) is accompanied by a decrease in the total energy of the system. Because of differences in local environment, the bonding of adspecies at the surface can exhibit configuration different from those encountered in the bulk phase. To obtain the relationship between the equilibrium surface density of adspecies and their concentration in the gas phase, it is most useful to employ the Gibbs
"dividing surface" rule [1].
The isothermal change in surface tension in the presence of an adsorbate is obtained;
where y is the surface tension and T,. is the specific surface area.
dy = ~RTT, d\npi (4) .". y = ro-RTl r, d In Pl (5)
Based on the Gibbs adsorption isotherm above, a surface adsorbate causes a decrease in the surface tension of a solid (metal) [1].
2.2.2 Adsorbate-Induced Surface Modification
The adsorption of a strongly bonded species may induce complex changes in the
structure of a metallic substrate. Therefore, the interplanar spacing normal to the surfacemay be altered (surface relaxation). Besides, the rearrangement of the atoms in the topmost plane of the crystal may occur (surface reconstruction). Finally, the adsorbate
can cause drastic changes in the equilibrium shape of the crystal, which can induceinstability of certain monatomic steps (two dimensional faceting) or planes (three
dimensional faceting) [1].
2.2.3 Surface Segregation and Interfacial Support
The mechanical properties of metals can be markedly affected by the presence of impurities which segregate to the grain boundaries. Examination of the transferred
interfaces has shown that the segregation impurities are localized in the very narrow-region which constitutes the grain boundary. The analogy between surface ad grain boundary segregation is further reinforced by the fact that faceting can occur in both
cases by segregation of specific impurities [1].2.3 DEACTIVATION MODES
2.3.1 Thermal Sintering
For metals, the predominant sintering mechanism in the bulk is vacancy diffusion,
which suggests a relationship with cohesive energy. Following is the increasing order of
stability for metals:
Ag < Cu < Au < Pd < Fe < Ni < Co < Pt < Rh < Ru < Ir < Os < Re
Copper has a relatively low melting point (1083°C) compared with, iron for example (1535°C) and nickel (1455°C). Therefore, copper based catalysts have to be operated at relatively low temperatures, usually not higher than 300°C [5].
New formulations were developed containing Cr203, and later AI2O3, in addition to CuO and ZnO in the unreduced catalyst. The thermal stability of these catalysts was significantly higher. It is apparent from data shown in Figure 2.2, as well as extensive other results, thermal sintering can be controlled in well-formulated catalysts manufactured under optimal conditions, provided they are operated under well-
controlled conditions.
>
u to CD
>
JO
0)
500 1000
Time on !ine/h
1500 2000
Figure 2.2: Relative activities of typical copper/zinc oxide under poisons free conditions. (A) Cr203-based catalyst; (B) conventional Al203-based catalyst; (C) high copper-content Al203-based catalyst; (D) optimized Al203-based catalyst. For clarity, experimental points are shown on only one of the curves [5].
2.3.2 Carbon Deposition (Coking)
The morphology of the carbon adlayer on metal surfaces plays an important role in catalyst deactivation. In morphological terms, the surface carbons encountered on catalyst surfaces may be divided in the following groups on the basis of varying degrees of metal-carbon or carbon-carbon bonding [1];
i. Adsorbed carbon atoms bound predominantly to metal sites
ii. Carbon-atom clusters with a mixture of interlayer carbon-metal bonds and interlayer carbon-carbon bonds
iii. Amorphous carbon in the form of filaments, whiskers, or fibers characterized by three dimensional arrays
iv. Crystalline graphite in the form of platelets and fibers
v. Metal carbides, which in the case of transition metal carbides consist of carbon
chains distributed through highly distorted metal lattices, as contrasted to interstitial carbides, in which each carbon occupies an octahedral void in the close-packed metal structure
Unlike reactions involving transition metal catalysts such as those containing iron, nickel or cobalt, or acidic catalysts such as zeolites or sulphated zirconias, Cu catalysis have no strong tendency to catalyze Fischer-Tropsch reactions, or processes involving carbonium ion chemistry. Copper also has a very low activity for breaking C-0 bonds or forming C-C bonds and as a result, wax formation is not usually a major problem in CO/H2 reactions, nor is formation of coke from hydrocarbons. These potential problems are further reduced by the fact that Cu catalysts must be operated at fairly low-temperatures to minimize thermal sintering [5].
2.3.3 Sulfur Poisoning
On the basis of geometric consideration, it is apparent that a sulfur atom has an effective blocking radius extending over a number of nearest and next-nearest neighboring metal
atoms. In addition to the occupied hollow site, a sulfur atom may block adjacent sites, depending on the substrate lattice dimension and the surface plane exposed [1].
Operating catalysts at low-temperature thermodynamically favours adsorption of poisons, giving high surface coverage. As a result, copper catalysts are extremely sensitive towards site-blocking poisons, and they are particularly sensitive to even very low levels of poison such as reduced sulphur or phosphorus species. Under normal operating conditions, sulfur is a powerful poison for Cu [5]
2.3.4 Chloride Poisoning
The chloride poisoning of Cu catalysts can operate by several parallel mechanisms [5];
i. Reaction to give adsorbed chlorine atoms that can block or modify catalytic sites The low melting point and high surface mobility of Cu(I) chloride (Table 2.1) mean that even extremely small amounts of copper halide are sufficient to provide mobile species that accelerate the sintering of Cu catalysts
Poisoning of Cu catalysts by reduced sulfur compounds (e.g. FhS) is exacerbated by traces of mobile Cu(I) chloride
Further, ZnO, often present in Cu catalysts, reacts to form Zn halides, which also have low melting points, and causes further poisoning and sintering problems
n .
i n .
i v .
TABLE 2.1: Melting points of copper, iron and nickel and some of their compounds Melting point (°C)
Metal Chloride Bromide Sulfide
Copper 1083 430 492 1100
Iron 1535 674 684 1195
Nickel 1455 963 963 790
Consequently, even extremely small amounts of chloride provide the species necessary for a surface migration sintering mechanism of Cu crystallites. Similar processes
involving ZnO take place when chloride is present because zinc chloride species (Z11CI2, mp 283°C) also have high surface mobility, and this also contributes to a destructive destabilization of catalytic activity via structural changes that decrease thermal stability.
Figure 2.3 illustrates the decrease in water-gas-shift activity following introduction of a small amount of HCl into the feed gas. Chloride poisoning is particularly difficult problem for water-gas-shift plant operators because it is usually present in process gas in amounts below the normal levels of detection. However, depending on the catalyst concerned, chloride can be retained at the top (inlet region) of the catalyst bed, usually in the form of zinc hydrochlorides, with the result of the overall catalyst charge is partially self-guarding. These species, however, soluble in hot water and it is, therefore, important to avoid conditions that give condensation. Otherwise, condensation will wash chloride further into the bed [5].
It is clear that admission of chloride to process streams involving Cu catalysts should always be kept to an absolute minimum. Strict attention has to be paid to feedstock purity, and traces of chloride have to be removed with an alkali absorbent that has high affinity for HCl during feedstock purification. Similarly, chlorinated solvents should not be used during maintenance operations, and on sites, where gases such as hydrogen are imported, care is necessary to confirm their quality. [5]
100
>
>
o 03
'•M
E
>
'>
<
50
0
Hydrogen chloride
admitted
0.01%
0.03%
/
Increase in chloride
content of catalyst
0 200 400 600
Time/h
Fig. 2.3: Effect on activity of very small amount of HCl on the water-gas shift activity
of a Cu/ZnO/Al203 catalyst2.3.5 Other Poisons
Other poisons for Cu catalysts include arsenic, which might come from some types of C02 removal systems in hydrogen or ammonia plants, and trivalent phosphorus, which could originate from boiler water feed treatment, but in practice, these are seldom actually encountered. Silica, transition metals such as iron, cobalt and nickel may also
occur as poisons in some processes. [5]2.3.6 Physical Damages
Physical damage is rarely a significant cause of deactivation in Cu catalysts. The main
causes of physical damage in other catalytic systems are;i. The formation of carbonaceous deposits within the catalyst pore system [5]
ii. Catalyst attrition in fluidized or moving bed processes. [5]
iii. Catalyst attrition due to unloading and loading activity
Copper catalysts, rarely suffer from carbonaceous deposits. None of the main hydrogenation processes using copper catalysts were designed as fluidized or moving bed processes, so this cause of damage is not encountered, but some kinds of plant maloperation can lead to physical damage of any catalyst. For example, inadvertent exposure to hot liquid water can sometimes cause physical breakage of catalyst pellets.
Copper catalysts are especially susceptible to careless temperature excursions that lead to excessive sintering of the copper crystallites and irreversible loss of activity. [5]
2.4 HANDLING OPTIONS
A few options in dealing with the spent catalyst are catalyst disposal, regeneration, metal recovery and also utilization of spent catalyst as raw materials to produce other valuable products. However, initial prevention before the poisons or impurities disturb the catalyst performance is preferred. The best method of handling must be obviously relying on the cause of catalyst decay.
Various forms of carbonaceous deposits, known collectively as coke, are by far the most common catalyst foulants. All carbonaceous deposits may be removed by gasification as described by the generalized reactions;
•C + 02 -» CO, (6)
C + 2H2 -*CH4 (7) C + H20->CO + H2 (8) C + C02 ->2C0 (9)
For the poisoned catalyst, reactivation is a possible way of catalyst's regeneration.
However, it is reusable if only the poisoning processes are reversible. If not, the catalyst
15
must be discarded [3]. Again, however, prevention is the preferred option, either by
using a guard process such as hydrodesulfurization, a guard bed such as zinc oxide orby including additive in the catalyst that will selectively adsorb sulfur, taking example
as a popular poison.
Thermal degradation, particularly sintering is very hard to reverse and prevention is better much than after treatment. In general, catalysts undergoing thermal degradation cannot be rejuvenated and replacement is necessary. The most common strategy involves prevention of sintering either by controlling conditions or by stabilizing the
catalyst [3].
CHAPTER 3
METHODOLOGY
3.1 PROJECT METHODOLOGY
Preliminary Research Works Background of project
Problem definition
Objective and scope of works
Literature Review
Overall scope of works Planning for future project
works
v
Data Analysis
Results and error analysis
Level of seriousness for each
cause of catalyst decay
Experimental Activities
Test on contaminant
contents
Fresh and spent catalyst
' '
Conclusion and Recommendations Lessons learnt
Catalyst characteristic and handling options
Project Finalization - Oral presentation
Project report
Figure 3.1: Project Methodology
The Gantt Chart of the project is attached in Appendix 3-1
17
3.2 TOOLS AND EQUIPMENT
To achieve the project objectives, a few series of experiments and analyses were carried out. Followings are the equipment used to characterize the catalysts;
TABLE 3.1: Equipment Involved In Catalysts Characterization
EQUIPMENT FUNCTION AND CHARACTERIZATION
PROPERTIES
1. Temperature - Programming
Desorbtion, Reduction and
Oxidation (TPDRO)
To determine the desorbtion, reduction and oxidation profiles of the catalyst using temperature programmed equipment, to measure metal surface area, dispersion percentage, mean particle diameter and also to determine BET surface area using N2 (liquid)
2. Carbon, Hydrogen, Nitrogen, and Sulphur (CHNS) Analyzer
To measure carbon, hydrogen, nitrogen and sulfur contents on the catalysts
3. Scanning Electron Microscope (SEM)
To study surface morphology
4. Energy Dispersion X-ray (EDX) To measure metal composition of a heterogeneous catalyst (The test was conducted together with SEM)
5. X-ray Diffraction Unit (XRD) To determine the elemental species
6. Pycnometer To measure density
7. Fourier Transform Infrared
(FTIR)
To observe functional groups in the catalyst
The pictures of equipment used are attached in Appendix 3-2.
3.3 TEST PROCEDURES FOR PHYSICAL PROPERTIES DETERMINATION
Experiments were conducted using both the fresh and spent catalyst pellets. The fresh and spent catalysts were obtained from PETRONAS Methanol Plant, Labuan. The catalysts composed by Cu/Zn/Al203.
3.3.1 XRD
The procedures of XRD experiment are as follows;
1) All the samples were scanned using Cu Ka (nickel-filtered) radiation the range 1O°<20<75° in the step mode
2) The mean crystallite sizes of CuO and ZnO were determined from the line broadening of the diffraction lines for CuO and ZnO respectively
3.3.2 SEM
The catalyst's morphology was observed using SEM and the procedures are:
1) One pellet of fresh and spent catalyst were placed on the stand and labeled 2) The samples were coated the gold palladium metal to reduce the oxide effect on
catalyst, which block the microscope lenses
3) The coated samples were then put on microscope and analyzed at EHT = 25 kV, working distance 10/15 mm and Magnification 5000X
3.3.3 Pycnometer
The density of the catalyst was measured by a Pycnometer, using helium gas. The procedures are as the followings:
1) catalyst pellets were put in the holder and located in the Pycnometer after the
total mass were recorded
2) The helium gas was passed through the samples to measure the density, and steps were repeated with spent catalyst sample
19
3.4 TEST PROCEDURES FOR CHEMICAL PROPERTIES DETERMINATION
3.4.1 SEM/ EDX
The EDX was conducted together with the SEM analysis. To obtain the metal composition of the catalyst, liquid nitrogen was used. All the metals that were going to be analyzed were chosen from the periodic table in the EDX software and the percentage of the metals were obtained.
3.4.2 FTIR
The samples analyzed were prepared in powder form and mixed with KBr. The samples were scanned using FTIR by following settings;
• Range: Start at 4000 cm"1 and end at 1000cm"1
• Scan number: 40
• Resolution: 4
• Angle: 45°
The steps for the experiments were;
1) The catalysts powder was put in the mortar and grind with the pestle, together with the KBr to dilute the sample
2) The grind sample was put in the holder and pressed using Hand Press
3) The sample was then analyzed using FTIR equipment and peaks were analyzed
3.4.3 CHNS
CHNS analyzer determined the percentage of carbon, hydrogen, nitrogen and sulfur existed in the catalysts. The procedures for CHNS are as follows;
1) The fresh and spent catalysts were prepared in powder form, encapsulated in a tin capsule and weighted
2) The sample was then dropped into the furnace at the same time, oxygen passed
o v e r
3) As the sample entered the combustion chamber, oxygen was injected for
complete oxidation to occur
3.4.4 TPR
TPR analysis was conducted to determine the reduction temperatures of fresh and spent catalysts. The metal surface area was also determined from the TPR experiment.
1) The samples were treated in a U-shaped reactor at 553 K (1 hr) in a 02/He
mixture (10 vol%, 60 mL/min)2) The initial temperature was set to be 28°C and stopped at 600°C, and other
experiment data were keyed in into the computer3) The TPR experiment was carried for 1 hour
3.4.5 TPO
TPO analysis was carried out using the oxygen in helium mixture. The TPO was
conducted to obtain the profile of oxidation processes for fresh, spent and standard
(CuO) sample.
1) The samples placed in a U-shaped reactor was first reduced at 553 K (1 hr) in a
02/He mixture (10 vol%, 60 mL/min) for 1 hour2) The initial temperature was set at 28°C and final temperature was set at 600°C, otherexperiment data were keyed in into the computer
3) The TPO experiment was conducted for 1 hour
21
CHAPTER 4
RESULTS AND DISCUSSION
4.1 PHYSICAL PROPERTIES OF CATALYST
4.1.1 XRD
The results obtained from the XRD tests are attached in Appendix 4-1 and Appendix 4- 2. The summary of the results is as follows;
TABLE 4.1: XRD results
SAMPLE FRESH
(20-scale)
SPENT
(20-scale)
LITERATURE
(20-scale) [6, 7, 8] Fresh and spent)
(l)ZnO 31.8,35 31.8, 35.5, 37,
56.5
31.8 [6, 7, 8]
35.5,37,47.5,56.5,63 [6,8]
(2) CuO 39 39,63 39 [7, 8]
49.5, 68, 70 [8]
63 [6, 8]
(3) Cu (not observed) (not observed) 43 , 50.5 [6],
(4) CuAl204 32 32,68 32, 58.5 [6]
(5) Cu-Zn (not observed) (not observed) 42, 45 [6]
(6) CuAl202 (not observed) 36.5 36.5 [6]
For fresh catalyst, only a few peaks were observed. Peaks for fresh sample occurred at 20 = 12, 15, 17.5, 23.5, 31.8, 32, 35 and 39. The peaks occurred at scale 30 and below cannot be identified because the interpretations are not included in the literature. The
peaks occurred at 31.8° and 35°, indicate the presence ZnO in the catalysts. CuO is
indicated by peak occurs at 20 = 39. The peak at 20 - 32 observed for fresh sample
indicates the presence of CUAI2O4.In the spent catalysts, peaks for ZnO and CuO were observed as sharp signals. There
were nine peaks observed at 20 - 31.8, 32, 35.5, 36.5, 37, 39, 56.5, 63 and 68. Thepresence of CuO was indicated by peaks at 39° and 63°. ZnO was represented by peaks
occurred at 20 = 31.8, 35.5, 37 and 56.5. For spent catalysts, the existence of CuAI204was shown by the peaks at 32° and 68°, but it was not observed in fresh sample. There's a peak occurred at 36.5 which referred to CuAl202 presence. The XRD peaks for spent catalysts are sharper and narrower compared to those of fresh catalyst. It was evident that industrial conditions produce an increase in the crystal size, due to thermal sintering [6]. No peak was observed due to Cu-Zn alloy formation presence in the fresh and spent
catalysts.
4.1.2 SEM
SEM analysis was conducted at 5000X Magnification for both samples, with working
distance 10 mm.
- • *
t
'J
- - • - i
•v
* -
I k
k r* ll- ' 1 ' "
- £"*• . Or1.-1 F." _
•i
'k
•iS : X '--;
"Sf* J"'-
1 - 1
•i ••
- . - a j "'•- ,* ' •".•T" ?.. '•' ^,
^ £>
u .-l;i^* ^ •* ' •_*. / <.>\*1 '•—J I, ., fr •^^j „_ -A-
^ • •*
. - •f -3-*t
1_ L ^ m •
*«$5E *- r
>r-:.;
jF p * •r
* - " ' "L "f /
ft mT
"f-' - i_ _ . 1 * J-
\ ' -' -" irf'
' 1 -/$"
•-
*.
••p. J
"•%*• >^.
**
*fi '•-
X ' \ m JB i"."i* • . 3-j i i
. - 1 *
"-•^'r"-.l • - f Jr^ . - . a
.i •„'•;. A _ 1 "=•J - » . ." _
1 *
•• 'i;'
• m•• - - • "i
•v*-*, ' "1
'•F-f *rr
• V- j -
J . •'
. *" ^" 7i -
•
J
'- 1 sc
v_ ' •
"- .**. , . *!•*«*.. ^ 'tHI =/1M k<J
WD = 10 mm
flag = 5.00 K X urn
SignalA= SE1 D
i»«M:WUi^'
Operaior : lmliss@!pcii unfls.com.ini
" "^"*ml'- SSSS™,,*™ > - - * ™ - ™ * * S M ' « " ^f-™M;<j»!&; ;Wa= ».{J'.-:™.™\^*vs»tm,JK^sKK'^^i'y^^&^feic-^ Jt.::,
Figure 4.3: Morphology of fresh catalyst, obtained from SEM analysis
23
Oxide components are represented by the white dots on the fresh catalyst as shown in Figure 4.3. It shows that the metals (Cu/Zn/Al) exist in the oxide form. The particles are
very small and have similar sizes as the others.
The result of spent catalyst is represented by Figure 4.4. It can be seen that the white
particles (oxides) are less than the fresh catalysts. The particle size appeared larger than that offresh catalyst, indicating thermal sintering had occurred. Copper has a relatively low melting point (1083°C) and therefore, copper based catalysts have to be operated at relatively low temperatures, usually not higher than 300°C [6].
-V •"*'•'-•a^1' -•*-- * * -'•*'•,
„*• *\ £*•* ^p • - + **7^. :. *
"JSi ' ***•. 5r;-- _, J >'-i ,V
- I. *J5|?
•J . • "i1 •#¥» ±fc« > i*
B^rf-
.*
wo =Vn,:; ",UH • L I a*"' a <ri •'-Vni W*
OpL-iutor : Irnfids^pelr
Figure 4.4: Morphology ofspent catalyst, obtained from SEM analysis
4.1.3 TPR and TPO Analysis (Metal and BET Surface Area)
The complete results of surface area determination are attached in Appendix 4-3 and
Appendix 4-4. The summary of the results is as follows;TABLE 4.2: Surface characterization
PROPERTIES/SAMPLE FRESH CATALYST SPENT CATALYST
BET surface (nr/g) 109.48 71.15
Total metal surface (mz)
6.70 6.01Metal surface (m2/g)
64.3 41.8Dispersion degree 11.46 7.45
Total metal (%) 7.22 4.69
Mean particle diameter (nm) 14.38 22.12
From the results obtained, the BET1 surface area and metal surface area offresh sample
were higher than the spent catalysts. The fresh catalysts also had higher dispersion percentage than the spent catalysts, related by smaller particle size. These results show that the particle diameter of catalysts increased after it had undergone industrial processes. Therefore, the increase in particle size led to a decrease in BET and metal
surface area. The catalysts had experienced thermal sintering, as indicated by the
increase in particle size.
4.1.4 Pycnometer
From the experiment, it was found that density for spent catalyst was slightly higher than the fresh catalyst (See Appendix.4-5 and Appendix 4-6). The mass for both
samples was similar, 1.1245 grams for fresh and 1.1222 grams for spent respectively.
These were the total mass for 5 pellets of catalysts being used for this experiment. The average solid volume for spent catalysts seemed to be decreased after the catalyst had 1Surface area based on Brunaur, Emmett and Teller (BET) definition. These people derived isotherm for
multilayer physical adsorption.
25
undergone industrial processes, and the difference was quite huge. The catalysts lost about 0.1466 cc of volume after it was used in the methanol processing. The results of
this experiment are summarized in Table 4.2.
TABLE 4.3: Summary of Pycnometer results
SAMPLE MASS (g) AVERAGE VOLUME
OF SOLID (cc)
AVERAGE SKELETAL
DENSITY (g/cc)
Fresh 1.1245 0.1983 5.6718
Spent 1.1222 0.0517 21.7039
The results indicate that the volume of the catalysts reduced after it was used in the industry, possibly due to the presence of more void spaces between the catalyst particles. The Pycnometer measured the density by calculating the ratio of mass over solid volume of the material used. All the void spaces (pores volume) was deducted and
eliminated in the calculation. Hence, the results showed that there were more voidspaces in spent catalysts and caused the skeletal density of spent to be higher than that of fresh catalyst. The increase of skeletal density might be due to catalyst attrition
during loading and unloading activities.
4.2 CHEMICAL PROPERTIES OF CATALYSTS
4.2.1 SEM/EDX
The quantitative results of metal composition for fresh and spent catalyst are shown in
Figure 4.5 and Figure 4.6. The results were analyzed at Magnification 1103 X and the
accelerating voltage used was 25 kV. The process time used was 5.Quantitative results
0 Pi Si S Cl Fe Co Ni Cu Zh As Br Hg
Figure 4.5: Metal composition for fresh catalyst obtained from SEM and EDX analysis
Four metals were observed, which were oxygen, aluminium, copper and zinc. The oxygen had 17,55 wt% and aluminium was 9.03 wt%. The copper and zinc were 52.5lwt% and 20.92wt% respectively. No other metal were observed and the complete result is attached in Appendix 4-7.
In Figure 4.6, the analysis at 1103X showed that spent catalyst composed of 4 main components, carbon, oxygen, copper, and zinc (refer Appendix 4-8) for complete result). The carbon content was 10.13 wt% and the atomic percentage was 23.93%.
Copper and zinc weight percentage were 31.18 and 30.85 respectively. The oxygen was 27.33 wt% of the overall catalyst. Other metal observed was Fe, 0.5 wt%. At this spot,
no aluminum was observed.
27
Quantitative results
40 &
C Na Si Fe Ni Zh Br
0 M CI Co Cu As Hg
Figure 4.6: Metal composition for spent catalyst obtained from SEM and EDX analysis
By comparing the fresh and spent catalyst, more copper but less zinc were observed in fresh. However, no aluminum was observed in spent catalyst. More oxygen in fresh catalyst indicates that more oxide material at the 1103X spot. It was hard to conclude the exact value of metal compositions in the catalysts sample because only one pellet was used for each test. The EDX only measured the metals those present within the spot range of SEM.
4.2.2 FTIR (Fourier Transform Infrared)
The results of FTIR analysis for fresh and spent catalysts are shown in Appendix 4-9 and Appendix 4-10 respectively. The summary of the results are shown in Table 4.3.
TABLE 4.43: FTIR results
SAMPLE WAVENUMBER(citT) FUNCTIONAL GROUP
Fresh 1020- 1080 SO Stretching
350- 1410 Combination C-H stretching
1470- 1530 N-FI stretching
1620- 1700 C-H stretching
3000 - 3660 O-H Bending
Spent 1590-1710 C-H stretching
iOOO - 3660 O-H Bending
The O-H bending for fresh catalyst ranged from 3000-3660 cm"1 wavelength showing the existence of moisture in the catalyst. The N=H and C=H stretching were also observed at wavelength ranged from 1470-1530 cm"1 and 1620-1700 cm"1. The result also showed the S=0 stretching at 1020-1080 cm"1 indicating the existence of sulfur in
the catalyst [8, 9].
Only O-H bending was clearly showed in the spectroscopy analysis for spent catalyst
sample. Besides, at 1590-1710 cm"1 the C-H stretching was noted indicating the
existence of hydrogen in the sample [8, 9].
4.2.3 CHNS Analysis
The CHNS analysis (see Appendix 4-6) determined the carbon, nitrogen, hydrogen and sulfur of fresh and spent catalysts. The carbon content was 3.4% and 3.7% the spent and fresh samples respectively. The carbon contents for both samples were higher than the amount given by manufacturer. The result also showed that the average sulfur content for fresh sample was 0.017%, which was lower than allowable sulfur content given by
manufacturer (0.04%). On the spent catalyst, 0.05% sulfur was obtained from the testindicated that the catalysts might have been poisoned by sulfur [5].
29
4.2.4 TPR Analysis
The detail TPR results for fresh and spent catalysts are shown in Appendix 4-12. Figure 4.7 shows the TPR curves for standard CuO sample together with the fresh and spent
catalyst. The samples were exposed to 5.42% H2/He and were heated from 25°C to
600°C. This treatment only caused CuO species to be reduced whereas other components such as AI2O3 and ZnO will not be reduced. The TPR profile for standard CuO sample is symmetrical indicating a homogeneous sample.8000™
6000-
>
E 75
c 01
5>
-4
4000^
2000-
0d
-1-1 r-p
0
Frc.ili
200
I 1 ! : 1 !
400
Temperature / °C
800
Figure 4.7: TPR patterns for fresh, spent and CuO standard samples
The amount of hydrogen consumed as per attached in the Appendix 4-13 corresponds to reduction of Cu(II) to Cu(0) [5]. For comparison purposes, the reduction of standard CuO was also included, and the three profiles were combined together so that the analysis could be done easily. The area under the curve represented the total amount hydrogen consumption. The summary of TPR results is shown in Table 4.5.
TABLE 4.5: TPR results
SAMPLE
TPR PEAKS ( C) (Max. temperature required for complete reduction)
Fresh 344
Spent 456
Standard 445
For the fresh sample, a peak observed at 344°C, with hydrogen consumption of 8473.4387umol/g. However, a shoulder was observed at the higher temperature indicates strong interaction between CuO and ZnO. Large amount of hydrogen consumed for reduction indicating that more oxides component in the fresh catalysts.
The peak for spent catalyst was broader than spent and standard CuO sample.
For fresh catalyst, the reduction property of Cu(II) to Cu(0) was distinguishable because
Cu(II) were highly concentrated [5]. This could be due to;• A broadening of the peaks in presence of high amount of Cu (II)
• The large heat released that increased the temperature of the sample speeding up
the second reduction stepHighly dispersed CuO gave TPR signals at lower temperature than bulk CuO [5].
Therefore, from the results it showed that the fresh catalysts having high dispersion
percentage and hence gave lower reduction temperature than bulk CuO.The TPR profile for spent showed a reduction peak which occurred at 456°C. The peak of spent catalysts showed the reduction step of Cu(II) to Cu(0). Compared to the fresh catalyst, higher temperature was required to complete the reduction process of spent
catalyst, indicating larger CuO particles [8]. Therefore, it could be concluded that the spent catalysts deactivated due to thermal sintering which caused the particles sizes to larger and this conclusion was supported by BET surface area and SEM result.33
4.2.5 TPO Analysis
Figure 4.8 shows the TPO profiles for standard CuO, fresh and spent catalysts. The TPO process was carried out after the reduction process. Thus, it was assumed that no oxides components were not present in the samples before TPO analysis. The oxidation process was carried for 1 hr in 5% 02/He and stopped at 600°C. (See Appendix 4-14 and Appendix 4-15 for complete results of TPO)
2000-
1500-
Fresh
^£1GOO
'S
c
« 500
j-r 1 r-r-f-f J-n-, i t t : prr i j-]—i |-r-[-| i~r-T) i
0 200 400 600
Temperature / °C
"I j l i t r—T~! r 800
Figure 4.8: TPO patterns for fresh, spent and CuO standard samples
The results of TPO analysis is summarized in Table 4.4
TABLE 4.6: TPO results
SAMPLE TPO PEAKS (°C) (Max. temperature required for completeoxidation)
Fresh 213,320
Spent 185,316
Standard 320
From the TPO plot, profile for spent samples was quite complex and contained three or four peaks. However, for fresh samples, 1 clear peak and a shoulder was observed; and for standard there was one peak observed. For CuO standard, the peak occurred at
320°C indicating the oxidation of Cu(0) to Cu(II).
The oxidation process for fresh sample started at higher temperature (205°C), about
10°C higher than start up point for spent catalyst's oxidation process. For fresh sample, the first peak occurred at 213°C indicating the oxidation of Cu(0) to Cu(I) and the high temperature peak (320°C) was assigned to oxidation of Cu(I) to Cu(II) [5]. An intermediate peak, which was observed for the fresh catalysts was believed to span the transformation of Cu(0) in a hard oxidized state to Cu(I), and Cu(I) is an easily oxidized state to Cu(II) [8]. From literature, it is suggested that the hard oxidized state consists of
crystalline Cu, while the easily oxidized state corresponds to amorphous Copper [8].
For spent catalysts, the oxidation profile started at around 185°C and ended at 600°C. A
shoulder observed for spent catalyst's curve which occurred at higher temperature than
the maximum peak temperature. The peak occurred at 185°C was due to the oxidation
of Cu(0) to Cu(I), and the shoulder at 316°C corresponded to the oxidation of Cu(I) to Cu(II). The temperature profiles obtained showed that the spent catalyst was easily oxidized than the fresh sample because the temperature gap for oxidation of Cu(0)^
Cu(I)->Cu(II) was small. Therefore, it could be concluded that the amorphous Cu exist in the spent sample, might be due to thermal sintering during processing [1, 4, 8].
4.2.6 TPR and TPO
From the TPR and TPO profiles, it could be seen that the oxidation stages for fresh and spent catalysts were clearly shown by two peaks. The first peak represents the oxidation of Cu(0) to Cu(I) and the second peak represents the oxidation of Cu(I) to Cu(ll).
However, the reduction processes for both fresh and spent catalyst were only shown by a single peak. From literatures, the reduction and oxidation stages from TPR and TPO
33
profiles are supposed to be represented by two peaks respectively. In summary, the
results for TPR and TPO is shown in Table 4.5
TABLE 4.5: Summary of TPR and TPO results
SAMPLE TPR PEAKS (C1C) TPO PEAKS (°C)
Fresh 344 213,320
Sample 456 151,206,316,459
Standard 445 320
CHAPTER 5
CONCLUSION AND RECOMMENDATION
5.1 CONCLUSION
The physical and chemical properties of the fresh and the spent catalysts samples were
analyzed using several equipment such as SEM, XRD, EDX, CHNS, TPDRO, Pycnometer, and FTIR. The fresh and spent catalysts are characterized based on metals surface area, density, catalysts structure, functional group, impurities content, metal dispersion and also temperature programmed profiles, TPR and TPO. The resultsindicated that the catalysts were degraded due to sulfur, which poisoned the catalysts.
However, the major factor which caused the catalysts decay is thermal sintering, as
supported the SEM, TPR and TPO analyses. The results showed that the BET surfacearea, metal surface area and dispersion degree for the spent catalysts were decreasing after experienced industrial processes. Besides, the mean particle diameter was increasing as showed by TPR results and approved by SEM image. Thus, the
prevention is required to avoid the thermal sintering, by controlling the operating
temperature or by stabilizing the catalyst.5.2 RECOMMENDATIONS FOR FUTURE WORKS
Further works need to be performed on this project. Some of the recommendations are;
i. Use other characterization technique such as AAS (Atomic Absorption Spectrometry) to determine the metal compositions present in the catalysts ii. Repeat the SEM and EDX analysis to see the exact components in the catalysts iii. Test for catalysts regeneration activity using TPDRO
35
ST
-z, \
O ;
regeneration activity is not appropriate for the spent catalysts and disposal is the best £2 option of handling the aged catalysts from methanol plant. Therefore, the initial 5|
55 '
>
C3
iv. Check for catalyst' pores distribution using mercury porosimeter and other
appropriate equipment
v. Find the equipment that can test large number of catalysts because the equipment used in this project only consider a few pellets of catalysts, which is not representative for the whole catalysts in real industry environment,
vi. Research on production of a more valuable product from the spent Cu/ZnO
catalyst
REFERENCES
1. Oudar, Jacques and Wise, Henry 1985, Deactivation and Poisoning ofCatalysis,
(Chemical Industries; v. 20), New York, Marcel Dekker.
2. I. Melian-Cabrera, M. Lopez Granados, and J.L G. Fierro, 2002, "Reverse Topotactic Transformation of a Cu-Zn-Al Catalyst during Wet Pd. Impregnation:
Relevance for the Performance in Methanol Synthesis from C02/H2 Mixtures",
Journal ofCatalysis, 210, 273-284.
3. M.Marafi, A. Stanislaus, 2003, "Options for Spent Catalyst Handling and
Utilization", Journal ofHazardous Materials, B101, 123-132
4. D.L. Trimm, 2001, "The Regeneration or Disposal of Deactivated Heterogeneous
Catalysts", Applied Catalysis A; General, 212, 153-160
5. Martyn V. Twigg, Michael S. Spencer, 2001, «Deactivation of Supported Copper Metal Catalysts for Hydrogen Reactions", Applied Catalysis A: General, 212, 161-
174
6. C.H Bartholomew and G.A. Fuentes, 1997, Catalyst Deactivation, Elsevier S
cience.7. T.L Reitz, S. Ahmed, M. Krumpelt, R. Kumar. H.H Kung, 2000. "Characterization of CuO/ZnO under Oxidizing Conditions for the Oxidative Methanol Reforming
Reaction", Journal ofMolecular Catalysis A: Chemical, 162, 275-285
8. Johan Agrell, Magali Boutonnet, Ignacio Melian Cabrera, Jose L.G. Fierro, 2003, '•Production of Hydrogen from Methanol over Binary Cu/ZnO Catalysts Part I.
Catalyst Preparation and Characterization", Applied Catalysis A: General 253, 201-
211
37
9. Brian C Smith, 1999, Infrared Spectral Interpretation, New York, CRC Press.
10. Barbara H. Stuart, 2004, Infrared Spectroscopy: Fundamentals and Applications,
United Kingdom, John Wiley & Sons, Ltd.
ll.Guo-Cheng Shen, Shin-ichiro Fujita, Susumu Matsumoto, Nobutsun Takezawa, 1997, "Steam Reforming of Methanol on Binary Cu/ZnO Catalysts: Effect of Preparation Condition upon Precursors, Surface Structure and Catalytic Activity",
Journal ofMolecular Catalysis A: Chemical, 124, 123-126
12. Shin-ichiro Fujita, Masahito Usui, Hiroto Ito, and Nobutsune Takezawa, 1995,
"Mechanism of Methanol Synthesis from Carbon Dioxide and from Carbon Monoxide at Atmospheric Pressure over Cu/ZnO", Journal of Catalysis, 157, 403-
413
13.1. Melian-Cabrera, M. Lopez Granados, and J.L G. Fierro, 2002, "Pd Modified
Cu/Zn Catalysts for Methanol Synthesis from C02/H2 Mixtures: Catalytic
Structures and Performance", Journal ofCatalysis, 210, 285-294
14. Nan Su*, Hung-Yuan Fang, Zong-Huei Chen, Fu-Shung Liu, August 2000, "Reuse of Waste Catalysts from Petrochemical Industries for Cement Substitution", Cement
andConcrete Research, 30, 1773 - 1783
15. M. Turco, G. Bagnasco, U. Costantino, F. Marmottini, T. Montanari, G. Ramis, G.Busca, 2004, "Production of Hydrogen from Oxidative Steam Reforming of Methanol I. Preparation and Characterization of Cu/ZnO/A1203 Catalysts from a
Hydrotalcite-like LDH Precursor", Journal ofCatalysis, 228, 43-55
APPENDIX 2-1
CATALYST COMPOSITION
Composition Weight (%)
CuO 63 ±2
Zinc Oxide, ZnO 25 ±2
Aluminum Oxide, A1203 12±2
Sodium, Na Max 0.7
Iron, Fe Max 0.02
Nickel, Ni Max 0.01
Sulfur, S Max 0.04
Carbon, C Max 0.01
[Source: Petronas Methanol Labuan]
x
GANTTCHARTAPPENDIX3-1 No.ACTIVITIES<