Drying of Ionic Liquid
by
Che Fatin Humaira Binti Che Yusuf (ID: 11907)
Dissertation submitted in partial fulfillment of the requirements for the
Bachelor of Engineering (Hons) (Chemical Engineering)
SEPTEMBER 2012
Universiti Teknologi PETRONAS Bandar Seri Iskandar
31750 Tronoh Perak Darul Ridzuan
i
CERTIFICATION OF APPROVAL
Drying of Ionic Liquid by
Che Fatin Humaira Binti Che Yusuf (ID: 11907)
A project dissertation submitted to the Chemical Engineering Programme Universiti Teknologi PETRONAS in partial fulfilment of the requirement for the
BACHELOR OF ENGINEERING (Hons) (CHEMICAL ENGINEERING)
Approved by,
_____________________
(Dr. Lukman Bin Ismail)
UNIVERSITI TEKNOLOGI PETRONAS TRONOH, PERAK
September 2012
ii
CERTIFICATION OF ORIGINALITY
This is to certify that I am responsible for the work submitted in this project, that the original work is my own except as specified in the references and acknowledgements, and that the original work contained herein have not been undertaken or done by unspecified sources or persons.
______________________________________
CHE FATIN HUMAIRA BINTI CHE YUSUF
iii
ABSTRACT
Room Temperature Ionic Liquids (RTILs) are salts in liquid phase. Continuous use of RTIL in a process may cause it to be contaminated with water and organic impurities over time making it necessary to regenerate and purify the RTIL for recycle purposes. Thus, drying is needed during pre-treatment and purification of IL solution before it can be used in any application to reduce weight, increase ease of handling and eliminate unwanted effects of moisture content towards IL properties. Drying process of ionic liquid is important since moisture levels that are too high may affect performance and reliability in most applications such as during synthesis of RTILs using aqueous solution to necessitate anion exchange and also in concentrating Benfield solution for recycles purposes during removal of CO2. Therefore, to obtain the most optimum condition of drying for ionic liquids, the study on kinetic of drying is reported here by investigating the effects of drying temperatures, initial water content, types of ionic liquid cation and anion and different drying methods on drying curves and their subsequent kinetic parameters. Drying was done at 100, 120, 140, 160 and 180°C. The ratios of ionic liquid to water used were 1:4, 1:3, 1:2, 1:1 and 2:1. Ionic liquids containing [bmim] cation with [SO4]- or Phosphate-containing anion were used and drying methods applied were halogen lamp and vacuum drying methods. Thermogravimetric analysis which measures change of mass over time throughout the drying process was used to generate primary drying curves which were then manipulated to get secondary kinetic data. The drying process mainly occurred during falling rate period. Samples dried under higher temperature using vacuum drying have higher maximum drying rates, lower final moisture contents, higher drying constants and shorter drying times. The same result is observed for samples containing smaller anion and higher ratio of IL to water.
iv
ACKNOWLEDGEMENTS
In the Name of Allah, The Most Merciful and Compassionate, praise to Allah, He is the Almighty. Eternal blessings and peace upon the Glory of the Universe, our Beloved Prophet Muhammad (S.A.W), his family and companions. First and foremost, thank to the Almighty for the strength given to carry out the Final Year Project II under the title of Drying of Ionic Liquid in September 2012 Semester. A deep gratitude goes for the author’s supportive families, who throughout the way provide her with motivation in completing the project.
Special regards with deepest appreciation dedicated to DR LUKMAN BIN ISMAIL, the author’s supervisor for his continuous support and help throughout the project consultation. The supervision and support that he gave truly help the progression and smoothness of the author in completing this project.
This acknowledgement is also extended to all other lecturers, lab executives, lab technicians and graduate assistants who continuously show their cooperation to the author. The author’s gratitude also goes to the course mates in exchanging ideas and providing guidance in unfamiliar experimental procedures and usage of laboratories equipments. Last but notleast, the author would like to show her heartfelt gratitude to all those who has directly or indirectly involved in this project, for their tremendous support and motivation during the progress and completion of this project.
v
TABLE OF CONTENTS
CERTIFICATION OF APPROVAL . . . i
CERTIFICATION OF ORIGINALITY . . . ii
ABSTRACT . . . . . iii
ACKNOWLEDGEMENTS . . . . iv
LIST OF FIGURES . . . . . vii
LIST OF TABLES . . . . . viii
ABBREVIATIONS AND NOMENCLATURES . . . ix
CHAPTER 1: INTRODUCTION . . . 1
1.1 Background of Study . . . 1
1.2 Problem Statement . . . 2
1.3 Aim and Objectives . . . 3
1.4 Scope of Study . . . 3
CHAPTER 2: LITERATURE REVIEW AND THEORY . 5
2.1 Chronological Development of Ionic Liquid Study . 6
2.2 The Drying Curve . . . 6
2.3 Kinetic of Drying . . . 7
2.4 Kinetic of Drying by TGA Analysis . . 10
2.5 Drying of Salt Solution . . . 11
2.6 Application of Ionic Liquid in Removal of CO2 . 12
CHAPTER 3: METHODOLOGY/PROJECT WORK . . 13
3.1 Overview . . . . 13
3.2 Effect of Drying Temperature . . 14
3.3 Effect of Different Types of Cation and Anion . 15 3.4 Effect of Initial Water Content . . 16
3.5 Effect of Drying Methods . . . 17
3.6 Research Methodology . . . 17
3.7 Tools Required . . . 18
vi
3.8 Gantt Chart . . . 19
CHAPTER 4: RESULT AND DISCUSSION . . 20
4.1 Overview . . . . 20
4.2 Effect of Drying Temperature . . 21
4.3 Effect of Initial Water Content . . 26 4.4 Effect of Different Types of Cation and Anion . 30 4.5 Effect of Different Drying Methods . . 37
CHAPTER 5: CONCLUSION AND RECOMMENDATION . 41
REFERENCES . . . . . 43
APPENDICES . . . . . 45
vii
LIST OF FIGURES
Figure 1.1 Common Cations in Ionic Liquids 1
Figure 2.1 Plots of Total Moisture Content and Drying Rate versus Time 6
Figure 2.2 Kinetic of Drying 8
Figure 2.3 Drying rate and temperature curves for a particle 9 Figure 2.4 Drying Curve of Moisture Content versus Time 10
Figure 2.5 Drying Curve of Drying Rate versus Time 10
Figure 2.6 Drying Curve of –ln MR versus Time 11
Figure 2.7 Drying Curve of Brines of Different Concentrations 12 Figure 2.8 Permeance of CO2 at Different Water Content 12 Figure 3.1 Expected Drying Curve from Moisture Analyzer 13
Figure 3.2 METTLER TOLEDOKarl Fischer Titrator 14
Figure 3.3 METTLER TOLEDO Halogen Moisture Analyzer 15
Figure 3.4 [bmim][Cl] Sample in Heating Tray 16
Figure 3.5 Samples of Ionic Liquid mixed with Different Ratio of Water 16
Figure 3.6 Weighing Mass of Ionic Liquid 17
Figure 4.1 Moisture Content Reading from Moisture Analyzer 21 Figure 4.2 Drying Curve of Moisture Content vs Time at Different Temperatures 23 Figure 4.3 Drying Curve of Drying Rate versus Time at Different Temperatures 23 Figure 4.4 Drying Curve of Moisture Ratio at Different Temperature 25
Figure 4.5 Plot of ln k against 1/T 26
Figure 4.6 Drying Curve of Moisture Content vs Time at Different Water Content 27 Figure 4.7 Drying Curve of Drying Rate vs Time at Different Water Content 28 Figure 4.8 Drying Curve of Moisture Ratio at Different Ratio 29 Figure 4.9 Drying Curve of Moisture Content vs Time for [bmim] Cation 31
viii
Figure 4.10 Drying Curve of Drying Rate versus Time for [bmim] Cation 32 Figure 4.11 Drying Curve of Moisture Content versus Time for [SO4]- Anion 33 Figure 4.12 Drying Curve of Drying Rate versus Time for [SO4]- Anion 33 Figure 4.13 Drying Curve of Moisture Content versus Time for Phosphate Anion 34 Figure 4.14 Drying Curve of Drying Rate versus Time for Phosphate Anion 34 Figure 4.15 Drying Curves of Moisture Ratio for Different Ionic Liquid 36 Figure 4.16 Comparison of Drying Curves for Moisture Content versus Time 38 Figure 4.17 Comparison of Drying Curves for Drying Rate versus Time 39 Figure 4.18 Drying Curves of Moisture Ratio for Vacuum Drying 40
LIST OF TABLES
Table 2.1 Chronological Development in Study of Ionic Liquid 5
Table 3.1 Tools Required 18
Table 3.2 Gantt Chart for Project Development 19
Table 4.1 Experimental Data from Drying Curves 24
Table 4.2 Kinetic Data 25
Table 4.3 Experimental Data from Drying Curves 28
Table 4.4 Kinetic Data 29
Table 4.5 Experimental Data from Drying Curves 35
Table 4.6 Molecular Structures of Ionic Liquid 36
Table 4.7 Kinetic Data 37
Table 4.8 Experimental Data from Drying Curves 39
Table 4.9 Kinetic Data 40
ix
ABBREVIATIONS
RTILs Room-Temperature Ionic Liquids
GPU Gas Permeation Unit
NA Not Applicable
MR Moisture Ratio
ppm parts per million
[bmim][MeSO4] 1-butyl-3-methylimidazolium methylsulfate [emim][HSO4] 1-ethyl-3-methylimidazolium hydrogensulfate
[bmim][(C2F5)3PF3] 1-butyl-3-methylimidazolium tris(pentafluoroethyl)-trifluorophosphate [mmim][DMP] 1,3-dimethylimidazolium dimethylphosphate
[bmim][Cl] 1-butyl-3-methylimidazolium chloride [bmim][DCA] 1-butyl-3-methylimidazolium dicyanamide [bmim][MeSO4] 1-butyl-3-methylimidazolium methylsulfate
[bmim][(C2F5)3PF3] 1-butyl-3-methylimidazolium tris(pentafluoroethyl)-trifluorophosphate
NOMENCLATURE
Symbol Definition [SI unit]
K Drying Rate Constant [min-1]
Ea Activation Energy [J/mol]
T Temperature [oC]
t Time [min]
R Gas Constant [J/mol]
MCinfinity Final Moisture Content [%]
1
CHAPTER 1 INTRODUCTION
1.1 Background of Study
Ionic liquids are salts in the liquid state with a low melting point of below 100°C (Binnemans, 2006). The first ionic liquid, ethanolammonium nitrate, was discovered in 1888 by Gabriel and Weiner. In the 1970s and 1980s, ionic liquids based on alkyl- substituted imidazolium and pyridinium cations, with halide or tetrahalogenoaluminate anions, were initially developed for use as electrolytes in batteries. Two major drawbacks for some applications were moisture sensitivity and acidity/basicity which leads to the concern of removing the moisture content from the ionic liquids. As an overview, several types of ionic liquids are liquid at room temperature and they are usually referred to as Room-Temperature Ionic Liquids (RTILs). The cations of ionic liquids are often large organic cations, like imidazolium, pyridinium, pyrrolidinium, quaternary ammonium or phosphonium ions (Figure 1.1).
Figure 1.1 Common Cations in Ionic Liquids: (1) 1-alkyl-3-methylimidazolium; (2) 1- alkylpyridinium; (3) quaternary ammonium; (4) 1,1-dialkylpyrrolidinium; (5) 1,1-
dialkylmorpholinium; (6) phosphonium (Binnemans, 2006)
The 1-alkyl-3-methylimidazolium ions are often used as the cationic part of ionic liquids. Cl- and Br- yield hydrophilic ionic liquids which are miscible with water and
2
fluorinated anions like [PF6]- allow preparation of hydrophobic ionic liquids that are immiscible with water. Hydrophobicity of ionic liquids containing [BF4]- depends on the alkyl chain length of the associated cation whereby increasing alkyl chain length from butyl to hexyl to octyl increases hydrophobicity. Due to their hydrophobicity, they can be dried to very low final water contents. Recently, the studies on effect of water content in ionic liquids are getting increasing attention and several attempts to remove or reduce this moisture content have been done by incorporating the various methods of drying. In addition, we are also looking into the long-term stability of RTIL to identify the resulting decomposition products during the degradation due to thermal, mechanical, chemical or electrochemical stress. This is the basis for selection of appropriate processes for separation of decomposition products and regeneration of RTIL which is by using melt crystallization followed by subsequent drying process (Philipp, 2012).
Drying is a mass transfer process consisting of the removal of water or another solvent by evaporation from a solid, semi-solid or liquid. In some cases as described by Geankoplis (2003), water may be removed mechanically from solid materials by means of presses, centrifuging and other methods. This is cheaper than drying by thermal means for removal of water. A source of heat and an agent to remove the vapor produced by the process are often involved. Commonly, a gas stream such as air applies the heat by convection and carries away the vapor as humidity. Other possibilities are vacuum drying, where heat is supplied by conduction or radiation while the vapor produced is removed by the vacuum system.
1.2 Problem Statement
Molecular interactions that lead to the formation of aggregate structures in aqueous ionic liquid solutions have been the subject of recent studies. Water molecules can form hydrogen bonds with ionic liquid cations and anions. At low water concentrations, water molecules complex primarily with anions rather than with other water molecules and form clusters at high water concentrations. Complex formation can affect fluid properties, notably diffusivity. Although the anion is smaller than the cation, the anion diffusivity can be lower. This is attributed to water complexation.
3
Furthermore, ionic liquid’s properties can be highly dependent on water concentration, especially at low concentration. Additionally, solvation properties can change dramatically and necessitate careful control of water concentration.
Judging from the effects of water content in ionic liquid, drying or water removal is necessary to produce dry ionic liquid. The significance of producing dry ionic liquid is as an alternative to dry water and dry gel because they tend to collapse due to the temporal water vaporization in an open system. Dry ionic liquid is free from this undesirable defect due to its non-volatility. Based on literature review, there is only one paper which discussed about drying process of ionic liquid using membrane drying (Lipscomb, 2011) and it appears that there is not much development which deals with kinetic of drying for ionic liquids. Therefore, this work will contribute in the subject of drying kinetic for ionic liquid in order to analyze the optimum drying condition for ionic liquids based on drying curves analysis.
1.3 Aim and Objectives
The aim of this project is to study the kinetic of drying process for ionic liquids under different operating parameters and conditions. There are several objectives to be achieved in this study:
i. To study the effect of drying temperature on drying rate of ionic liquids
ii. To study the effect of different types of cation and anion on drying of ionic liquids
iii. To study the effect of moisture content on drying rate of ionic liquids
iv. To compare the performance of different drying methods in drying of ionic liquids
1.4 Scope of Study
In studying the kinetic of drying for ionic liquids, several parameters need to be set as the upper and lower boundary for the process. The first variable to be investigated is the temperature of drying for the ionic liquids. Lazzus (2011) points out that ionic liquid have favorable thermal stabilities and operate over large temperature ranges. The
4
upper limit of the liquid range is usually bounded by the thermal decomposition temperature of the ionic liquid, since most ionic liquids are nonvolatile. In most cases, the decomposition occurs with complete mass loss and volatilization of the component fragments. Most ionic liquids will start to decompose above 300°C with thermal decomposition for imidazolium-based ionic liquids range between 225°C to 422°C (Lazzus, 2011). Moreover, since the ionic liquids to be dried contain significant amount of water, we have to note the boiling point of 100°C. Combining these two factors, the drying temperature will be varied between 100°C to 180°C.
Furthermore, in order to investigate the performance of different drying methods in drying ionic liquids, two different processes will be used in this study. The first method is by using halogen lamp drying whereby the heating element comprises of a glass tube filled with inert halogen gas containing a tungsten wire heating element. The second method will be vacuum drying whereby the ionic liquid sample is dried by means of hot circulating air under vacuum condition. Apart from different drying methods, different combination of ionic liquid anion and cation consisting of [bmim]
cation, [SO4]- and Phosphate-containing anion are also chosen since their molecular structures and diameters are different from each other and these may also affect the drying process and kinetic of the ionic liquid samples.
In drying of ionic liquids, solutions of ionic liquid samples will be prepared initially with different ionic liquid to water ratio. This is to study the effect of initial water content in ionic liquid samples on the drying performance. To select the ratio of water to ionic liquid, references were made on the application of Benfield Process whereby it is a thermally regenerated cyclical solvent process that uses a solution of amine sorbent in ionic liquid to remove CO2, H2S and other acid gas components (Baugh, 2012). Permeance of CO2 increases at low water content and decreases after reaching a maximum value due to the hydrogen bond. The permeance of CO2 increases from 11.5 to 13.8 GPU, where the water content increases from 0 to 0.10, and then decreases to 13.3 GPU at the water content of 0.15. Thus, for the purpose of my study, the range of ionic liquid to water content ratio will be between 1:4 and 2:1.
5
CHAPTER 2
LITERATURE REVIEW AND THEORY
This chapter will focus on the analytical, critical and objective review of written materials on kinetic study of drying for ionic liquids. It was found out that drying of ionic liquids have been done by many researchers for the purpose of purification of ionic liquid for their experiments. However, there is not much emphasis on the behavior of ionic liquid during the drying process itself especially on the kinetic part.
2.1 Chronological Development of Ionic Liquid Study
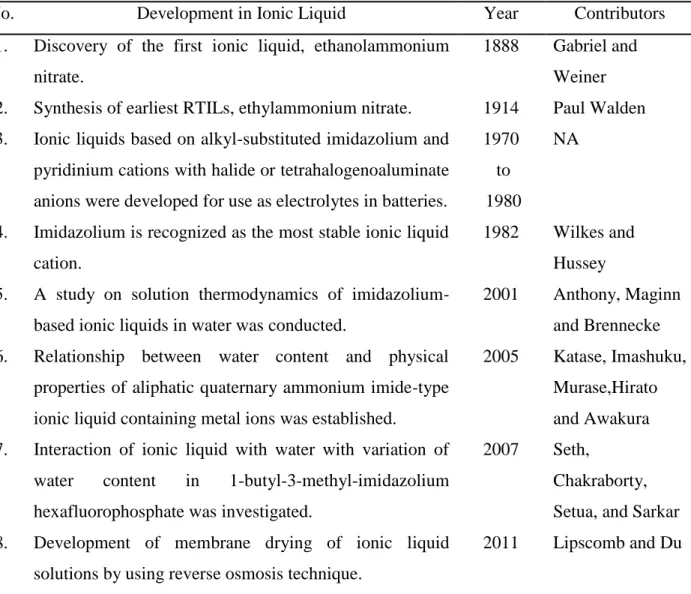
Table 2.1 Chronological Development of Ionic Liquid Study
No. Development in Ionic Liquid Year Contributors
1. Discovery of the first ionic liquid, ethanolammonium nitrate.
1888 Gabriel and Weiner 2. Synthesis of earliest RTILs, ethylammonium nitrate. 1914 Paul Walden 3. Ionic liquids based on alkyl-substituted imidazolium and
pyridinium cations with halide or tetrahalogenoaluminate anions were developed for use as electrolytes in batteries.
1970 to 1980
NA
4. Imidazolium is recognized as the most stable ionic liquid cation.
1982 Wilkes and Hussey 5. A study on solution thermodynamics of imidazolium-
based ionic liquids in water was conducted.
2001 Anthony, Maginn and Brennecke 6. Relationship between water content and physical
properties of aliphatic quaternary ammonium imide-type ionic liquid containing metal ions was established.
2005 Katase, Imashuku, Murase,Hirato and Awakura 7. Interaction of ionic liquid with water with variation of
water content in 1-butyl-3-methyl-imidazolium hexafluorophosphate was investigated.
2007 Seth,
Chakraborty, Setua, and Sarkar 8. Development of membrane drying of ionic liquid
solutions by using reverse osmosis technique.
2011 Lipscomb and Du
6 2.2 The Drying Curve
The literatures being considered for this study will focus on drying process.
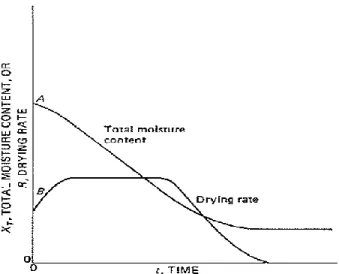
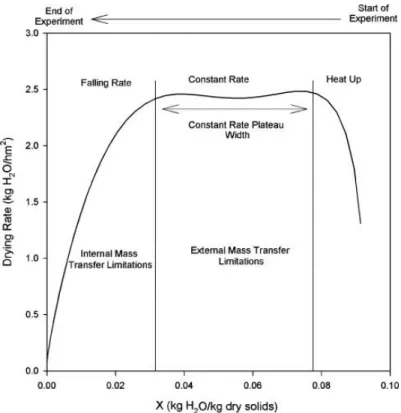
Referring to an article by Traub (2002), for each and every product, there is a representative curve that describes the drying characteristics for that product at specific temperature, humidity, drying methods and conditions. Figure 2.1 represents a plot of total moisture content and drying rate versus time whereby drying occurs in three different periods (McCabe et al., 1993). The first phase or initial period is where sensible heat is transferred to the product and the contained moisture which enables the subsequent processes to take place. This is the heating up of the product from the inlet condition to the desired condition. During this period, the rate of evaporation increases dramatically with mostly free moisture being removed. Moving on to the second phase of constant rate period, free moisture persists on the surfaces and the rate of evaporation alters very little as the moisture content decreases. During this period, drying rates are high and higher inlet air temperatures than in subsequent drying stages can be used without detrimental effect to the product. There is a gradual and relatively small change in the product temperature during this period. The next stage will be falling rate period during which migration of moisture from the inner interstices of each particle to the outer surface becomes the limiting factor that reduces the drying rate.
Figure 2.1 Total Moisture Content and Drying Rate versus Time (McCabe et al., 1993)
7 2.3 Kinetic of Drying
A series of work and studies on the kinetic of drying by thermal analysis have been performed previously by researchers to determine the kinetic data from the whole drying process of any materials. According to Pope et al. (1977), to extract the data for kinetic information, we have to recognize a reaction mechanism from the shape of the weight loss curve. Where a single mechanism predominates, as in the case of gas phase or solution reactions, it is often possible to describe the reaction by a general rate law:
where: C = fractional conversion
t = time (min)
k = rate constant (min-1) n = reaction order
Consider the reaction:
A Products
If first order kinetic is followed, then the rate of the reaction is proportional to the concentration of A:
Rate = k (concentration A) In the case of drying the reaction is:
(H2O) absorbed (H2O) Gas
Let α be the concentration of (H2O) absorbed at t=0 and (α-x) be the concentration of (H2O) absorbed at any other time denoted by t. The reaction rate for desorption is
. On integration, this equation becomes:
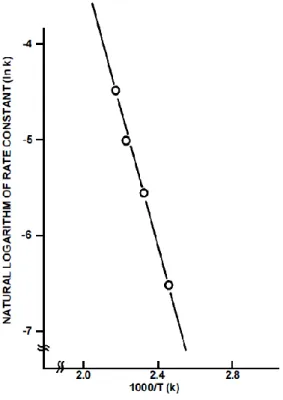
The k values calculated can be used to plot a kinetic graph of ln k against 1/T (Figure 2.2) which will produce a reasonable straight line with gradient –E/R whereby R is the gas constant according to:
(Z is Arrhenius frequency factor, min-1)
8
Thus, the activation energy, E (J/mol), can be directly obtained from the plot.
Furthermore, all the kinetic value can also be used to approximate the theoretical drying time at any temperature via the following equation:
where: t = drying time at the desired temperature (min)
kT = calculated rate constant at the desired temperature, T (min-1)
Figure 2.2 Kinetic of Drying (Pope et al., 1977)
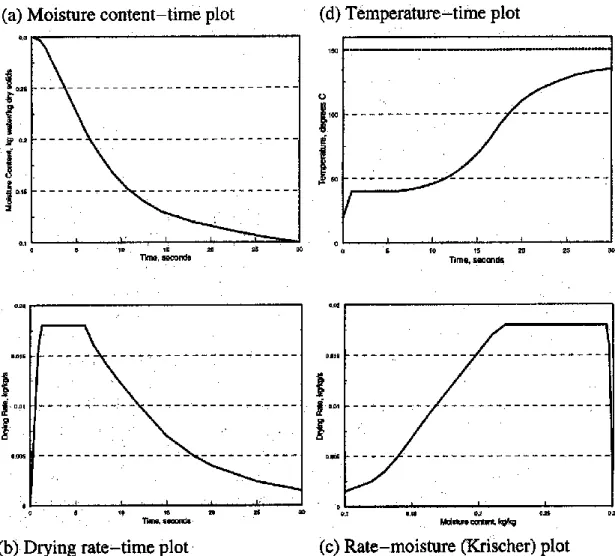
Furthermore, an analysis done by Kemp et al. in 2001 suggested several methods for processing the kinetic data obtained from drying. Generally, the approach in analyzing the kinetic data will depend on several factors; particle size, initial and final moisture content, predominant drying regime (unhindered or falling-rate), air velocity, level of accuracy required for the data and availability of measuring equipment. All these data will be used to generate useful drying curves that are interrelated such as Figure 2.3 (a) showing drying curve obtained directly from weight loss-time data (moisture content vs. time). In addition, Figure 2.3 (b) plots drying rate curve obtained directly from humidity-time data (drying rate vs. time) while Figure 2.3 (c) represents time independent or Krischer curve derived from the combination of the previous curves
9
(drying rate vs. moisture content). It is used as the basis for the characteristic curve scaling method. Finally, Figure 2.3 (d) shows a temperature-time plot representing how the sample temperature varies during the experiment.
Figure 2.3 Drying rate and temperature curves for a particle (Kemp et al., 2001)
Figure 2.3 shows the four interrelated curves obtained by simulation of a single particle undergoing convective drying in a hot air stream at a constant 150°C. This approach can be applied to the drying of ionic liquids since under the chosen conditions, the material is assumed to show an induction (initial heating) stage, unhindered drying (constant rate) period and a hindered drying (falling rate) period.
10
2.4 Drying Kinetic Study by Thermogravimetric Analysis
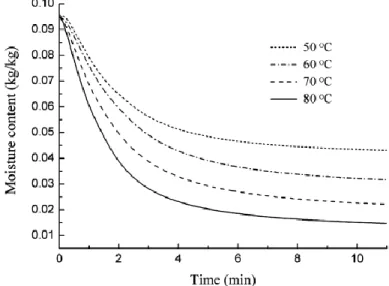
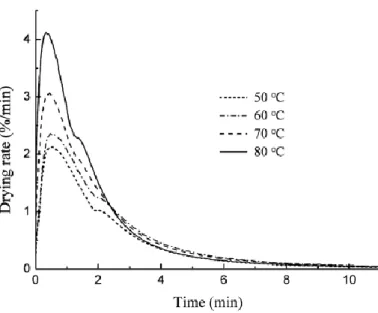
A thermogravimetric approach was applied by Chen et al. (2012) to study the drying of powdered rice straw particles to determine the drying kinetic under isothermal drying conditions. The results obtained by Chen et al. (2012) are presented in forms of drying curve shown in Figure 2.4 and 2.5. Temperature significantly affected drying rate and drying time. More moisture can be removed with high temperature drying because it is the main driving force of moisture evaporation. As seen from Figure 2.5, there was no constant rate period. Thus, the drying process can be divided into two periods, the rising and falling rate period.
Figure 2.4 Drying Curve of Moisture Content versus Time (Chen et al., 2012)
Figure 2.5 Drying Curve of Drying Rate versus Time (Chen et al., 2012)
11
By manipulating the thermogravimetric data as primary data, Ndukwu (2009) had calculated the drying constant, K (min-1), by calculating moisture ratio of samples throughout the drying process by using the following equations:
MR is moisture ratio, Mi is initial moisture content, Me is equilibrium moisture content, M is moisture content at time t and K is drying constant. The drying constant was calculated from slope of negative natural log of moisture ratio against time (Figure 2.6).
Figure 2.6 Drying Curve of –ln MR versus Time (Ndukwu, 2009)
2.5 Drying of Salt Solution
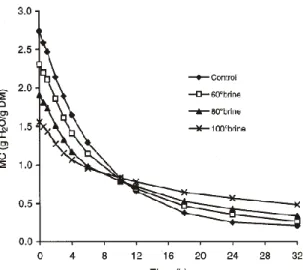
In the study of ionic liquid drying process, not much literature is available currently. However, considering the similar behaviour of ionic liquid with salt solution, we can determine several drying parameters by comparing them. As shown in Figure 2.7, the higher the salt concentration, the lower the decline in moisture. This was caused by higher moisture contents and lower salt contents in lower brine concentrations, allowing faster removal of water (Jason et al., 1992). The higher the salt, the lower the initial moisture of the solution and the faster it reaches equilibrium (Yu et al., 1982).
12
Figure 2.7 Drying Curve of Brines of Different Concentrations (Jason et al., 1992) 2.6 Application of Ionic Liquid in Removal of Carbon Dioxide
Ionic liquids are capable of acting as solvents for amine CO2 absorbent compounds in CO2 separation processes and it will enhance the sorption of the CO2 by the amine. A cyclic sorption process for separating CO2 in Benfield Process from a gas stream, such as flue gas or natural gas, brings the gas stream into contact with an absorbent solution of amine CO2 sorbent in ionic liquid solvent followed by desorbing the CO2 to regenerate the amine (Baugh, 2012). Referring to Figure 2.8, the performance of the process is affected by the water content whereby the optimum permeance of CO2 is at 0.10 water content. From this data, we could expand the study to evaluate the performance of ionic liquids with different initial water content towards drying or water removal process in regenerating the ionic liquid.
Figure 2.8 Permeance of CO2 at Different Water Content (Baugh, 2012)
13
CHAPTER 3
METHODOLOGY/PROJECT WORK
3.1 Overview
This chapter will focus on methods and procedure used to achieve all the objectives of the project. In analyzing the kinetic of drying, moisture content measurement is done individually for effect of drying temperatures, types of cation/anion in ionic liquid sample, initial water contents and drying methods. Modern portable moisture balances are available with built in infrared heaters which directly measures the moisture content of the product and gives a profile of moisture content variations with time. The curve of moisture content as a function of time is then plotted.
While different samples and different conditions of drying often give rise to curves of very different shapes in the falling rate period, the curve in Figure 3.1 occurs frequently and is expected for most of the experimental setups in this study.
Figure 3.1 Expected Drying Curve from Moisture Analyzer
14
During the above measurements, the following conditions are followed:
i. The sample should be subjected to similar conditions of radiant heat transfer ii. Air should have the same temperature, humidity and velocity throughout the
process
Electronic moisture balances with online data collection is used to establish drying curves of ionic liquid samples.
3.2 Effect of Drying Temperature
The initial water content of raw 1-butyl-3-methylimidazolium chloride is measured using Karl-Fischer titrator. Five samples of 0.5 g 1-butyl-3-methylimidazolium chloride mixed with 0.5 g distilled water (ionic liquid to water ratio of 1:1) are prepared and weighed in sample vials using mass balance. The heating temperature of Halogen Moisture Analyzer is set to 100°C for a period of 1 hour. Solution of ionic liquid sample is placed in the heating tray for the moisture analyzer to weight the initial mass and the heating process is started. After 1 hour, the ionic liquid sample is removed and the heating tray is cleaned. The result of overall moisture content over the period of 1 hour and final mass of sample is collected. The experiment is repeated at temperatures of 120°C, 140°C, 160°C and 180°C to generate different drying curves for each temperature.
Figure 3.2 METTLER TOLEDOKarl Fischer Titrator
15
Figure 3.3 METTLER TOLEDO Halogen Moisture Analyzer
3.3 Effect of Different Types of Cation and Anion
The initial water contents of every raw ionic liquid samples are measured using Karl-Fischer titrator. Five samples of 0.5 g 1-butyl-3-methylimidazolium chloride mixed with 0.5 g distilled water (ionic liquid to water ratio of 1:1) are prepared and weighed in sample vials using mass balance. The heating temperature of Halogen Moisture Analyzer is set to 100°C for a period of 1 hour. Solution of ionic liquid sample is placed in the heating tray for the moisture analyzer to weight the initial mass and the heating process is started. After 1 hour, the ionic liquid sample is removed and the heating tray is cleaned. The result of overall moisture content over the period of 1 hour and final mass of sample is collected. The experiment is repeated using different types of ionic liquid to generate different drying curves for each ionic liquid samples.
To investigate the effects of different cation in ionic liquids, the following samples will be used:
i. 1-butyl-3-methylimidazolium methylsulfate, [bmim][MeSO4] ii. 1-ethyl-3-methylimidazolium hydrogensulfate, [emim][HSO4]
iii. 1-butyl-3-methylimidazolium tris(pentafluoroethyl)-trifluorophosphate, [bmim][(C2F5)3PF3]
iv. 1,3-dimethylimidazolium dimethylphosphate, [mmim][DMP]
As for the anion part, we will use four different bmim-cation-based ionic liquids:
i. 1-butyl-3-methylimidazolium chloride, [bmim][Cl]
16
ii. 1-butyl-3-methylimidazolium dicyanamide, [bmim][DCA]
iii. 1-butyl-3-methylimidazolium methylsulfate, [bmim][MeSO4]
iv. 1-butyl-3-methylimidazolium tris(pentafluoroethyl)-trifluorophosphate, [bmim][(C2F5)3PF3]
Figure 3.4 [bmim][Cl] Sample in Heating Tray
3.4 Effect of Initial Water Content
The initial water content of raw 1-butyl-3-methylimidazolium chloride is measured using Karl-Fischer titrator. A sample of 0.5 g 1-butyl-3-methylimidazolium chloride mixed with 2.0 g distilled water (ionic liquid to water ratio of 1:4) is prepared and weighed in a sample vial using mass balance. The heating temperature of Halogen Moisture Analyzer is set to 100°C for a period of 1 hour. Solution of ionic liquid sample is placed in the heating tray for the moisture analyzer to weight the initial mass and the heating process is started. After 1 hour, the ionic liquid sample is removed and the heating tray is cleaned. The result of overall moisture content over the period of 1 hour and final mass of sample is collected. The experiment is repeated with distilled water mass of 1.5 g, 1.0 g, 0.5 g and 0.25 g to generate different drying curves under different ratio.
Figure 3.5 Samples of 1-butyl-3-methylimidazolium chloride with Different Ratio of Water
17
Figure 3.6 Weighing Mass of 1-butyl-3-methylimidazolium chloride
3.5 Effect of Drying Methods
The initial water content of raw 1-butyl-3-methylimidazolium chloride is measured using Karl-Fischer titrator. Six samples of 0.5 g 1-butyl-3-methylimidazolium chloride mixed with 0.5 g distilled water (ionic liquid to water ratio of 1:1) are prepared and their initial mass is weighed in a sample vial using mass balance to ensure uniform mass for all samples. The heating temperature of Vacuum Drying Oven is set to 100°C for 14 to 16 vacuum drying cycles (alternating between 50 and 900 millibar). After a stable temperature is achieved, solution of ionic liquid samples are placed in sample trays and left inside the oven before the vacuum pump is started. At 10 minutes interval, the vacuum pump is stopped and one ionic liquid sample is removed to weigh its current mass until a steady mass reading is achieved. The result of overall mass change over the period of 1 hour and final mass of samples are tabulated to generate drying curves for this method.
3.6 Research Methodology
From the raw data of moisture content readings over time obtained from moisture loss reading of the Halogen Moisture Analyzer and weight loss measurement from the Vacuum Drying Oven samples, a drying curve of Moisture Content against Time will be generated. Furthermore, by tabulating the weight loss data over time, the drying rate of ionic liquid samples can be calculated and plotted over time to produce another drying curve of Drying Rate against Time.
18
For analyzing kinetic of drying for ionic liquid, a graph of Negative Natural Log of Moisture Ratio against Time is plotted whereby the drying constant, K (min-1), can be calculated from the slope of the graph. Further tabulation of different isothermal moisture loss curves can give us different K values and plotted as Natural Log of K against Inverse of Temperature to give a reasonable straight line with gradient Ea/R which enables us to get the activation energy of the drying process. All the data tabulated data and graphs will be explained in the next chapter.
3.7 Tools Required
The tools required for this study can be divided into three major parts which are equipment, apparatus and chemical. All the tools required have been summarized in Table 3.1.
Table 3.1 Tools Required
Equipment METTLER TOLEDO Halogen Moisture Analyzer
Thermo Scientific Vacuum Drying Oven
METTLER TOLEDO Karl Fischer Titrator
Mass Balance Apparatus Sample Vials Spatula
Pasteur pipette
Parafilm
Labelling Stickers Chemical
Ionic Liquids
Distilled Water19 3.8 Gantt Chart
Table 3.2 Gantt Chart for Project Development
No. Detail/Week (FYP I) 1 2 3 4 5 6 7 8 9 10 11 12 13 14
1. Preliminary research work on Ionic Liquid and Drying Process 2. Initial preparation of Ionic Liquid samples and required equipments 3. Tuning of parameters and operating conditions
4. Initial testing of experimental setup and data gathering
No. Detail/Week (FYP II) 1 2 3 4 5 6 7 8 9 10 11 12 13 14
1. Determine the effect of temperature on drying of Ionic Liquid 2. Determine the effect cation/anion on drying of Ionic Liquid 3. Determine the effect of water amount on drying of Ionic Liquid 4. Determine the effect of drying methods on drying of Ionic Liquid 5. Data gathering, synthesis and analysis of drying curves for each
parameter
6. Interpretation of drying curves for each parameter 7. Compilation of data analysis and Conclusion
20
CHAPTER 4
RESULT AND DISCUSSION
This chapter presents the finding and outcome of the project work done on kinetic of drying for ionic liquid. All the gathered data from the project work are presented in the form of tables and figures including graphs showing drying curves for all the objectives studied. The data had been analyzed and results had been discussed accordingly with regard to drying of ionic liquid and its kinetic data.
4.1 Overview
For the experiments described above, the raw data will be the total moisture content generated from the METTLER TOLEDO Halogen Moisture Analyzer (Figure 4.1) for a period of 60 minutes in 2 minutes interval for every reading. A period of 60 minutes is chosen due to the indication from initial samples testing whereby equilibrium moisture content for most ionic liquid samples are achieved in that duration. By taking into consideration the boiling point of water, the temperature is set at 100°C in order to dry the water content in the samples. In addition, the temperature settings are also increased gradually until 180°C to investigate the differences in their drying curves.
Thermogravimetric analysis (TGA), which can follow weight loss over a wide temperature range or over a long period of time at a specific temperature, on small (10- 100 mg) samples, is a technique which rapidly provides data for understanding drying processes. The results yield not only quantitative information about the amount of moisture present, but also information about the rate of weight loss which can be used to determine kinetic parameters according to drying curves obtained.
Initially, all raw ionic liquid samples are tested by Karl Fischer Titration to determine its initial water content resulting in readings of less than 100 ppm (0.01%) for all samples and these small traces of water can be assumed as negligible. Thus, for the purpose of this experiment, water is mixed initially with all ionic liquid to produce a solution with ionic liquid to water ratio of 1:1 for most of the samples to be dried to ensure that drying process is possible despite the hygroscopic nature of ionic liquid.
21
Figure 4.1 Moisture Content Reading from Moisture Analyzer 4.2 Effect of Drying Temperature
The data obtained from the experiments are indicated in Figure 4.2 and 4.3 showing the change in moisture content and drying rate over time for temperature settings of 100°C, 120°C, 140°C, 160°C and 180°C with constant ratio of ionic liquid to initial water content (ratio of 1:1). The ionic liquid used is 1-butyl-3-methylimidazolium chloride for all samples. The moisture content is extracted directly from the moisture analyzer reading in percentage from 100% to equilibrium moisture content. Whereby the drying rate is calculated based on the initial and current weight of ionic liquid sample over a period of time using the formula below:
4.2.1 Drying Curves
From the results obtained, Figure 4.2 resembles exactly that of typical moisture content plot for normal drying process whereby the graphs decrease at higher slopes and gradually coming into a constant moisture content which is indicated by the equilibrium moisture content of the sample under the desired temperature. This is possible since the ionic liquid samples are prepared such that it is initially saturated with water content and
22
thus, with sufficient heating under suitable temperature, the water content is gradually released to dry the ionic liquid. However, the final moisture content of the dried ionic liquid sample is not exactly 0%. There is still some percentage of moisture content available since it is well known that water is omnipresent in ionic liquids. Dry ionic liquid will absorb water from atmosphere especially when heat is applied to it.
Imidazolium based ionic liquids in particular are extremely hygroscopic and they absorb water from atmosphere. These are the reasons why the ionic liquid samples need to be initially saturated with water and the final moisture content after drying is only between 40% and 50%.
For drying of all samples, the experiments are repeated twice to ensure data accuracy and repeatability. Error bars based on standard deviations between the first and second trials are presented in Figure 4.2. Since it is observable that the error bars are very small due to very low value of standard deviations, they can be assumed as negligible for all samples. The values of standard deviation for all samples are tabulated in APPENDIX A.
Referring to Figure 4.3, the shape of the drying rate curve is different to the typical drying rate curve shown in Chapter 2. There are only two phases of drying, initial period and falling rate period observed from the plots. It is highest at the first 5 minutes of continuous drying for all temperatures and decreases with time. This is a result of low internal resistance of moisture at the beginning of drying. Therefore, when energy is impacted, moisture can easily move to surface to be evaporated. As the drying progressed, more energy is needed due to the hygroscopic characteristic of ionic liquid which hinders the migration of moisture from the inner interstices of each particle to the outer surface. Consequently, the drying rate decreases gradually in the falling rate period and becomes zero.
23
Figure 4.2 Drying Curve of Moisture Content versus Time at Different Temperatures
Figure 4.3 Drying Curve of Drying Rate versus Time at Different Temperatures
40 60 80 100
0 10 20 30 40 50 60
Moisture Content, %
Time, min
100 120 140 160 180
°C
°C
°C
°C
°C
-0.02 0 0.02 0.04 0.06 0.08 0.1
0 10 20 30 40 50 60
Drying Rate, g/min
Time, min
100 120 140 160 180
°C
°C
°C
°C
°C
24 4.2.2 Analysis on Drying Kinetic
From both the moisture content and drying rate curves, it is observed that the moisture content decreases faster and in larger amount for higher drying temperature and the maximum drying rate is also higher (Table 4.1). The difference in vapour pressure between the inner interstices and surface of ionic liquid sample is the driving force causing the outward movement of moisture. The vapour pressure exerted by water rises very rapidly with increasing temperature and thus increases the drying rate. In addition, the use of high temperatures increases the capacity of air for holding water vapour from being reabsorbed by the ionic liquid and its drying potential which results in lower final moisture content (MCinfinity) as indicated in Table 4.1. This can also be associated with the drying rate constant, k (min-1), for each temperatures calculated by the method explained in Chapter 2.
Table 4.1 Experimental Data from Drying Curves Temperature (°C) Max Drying Rate (g/min) MCinfinity (%)
100 0.036 45.19
120 0.046 49.07
140 0.049 52.05
160 0.089 48.85
180 0.091 42.15
In order to obtain the drying constant, we have to know the moisture ratio of the ionic liquid samples throughout the drying process. Consequently, the drying constant can be obtained from the slope of negative natural log of moisture ratio against time (-ln MR versus time). The governing mathematical equations are as follows:
Where MR is moisture ratio, M
i is initial moisture content, M
e is equilibrium moisture content, M is moisture content at time t and K is drying constant. Referring to Figure 4.4, for higher drying temperature, the slopes of the curve are steeper which also represent higher drying constant. This is due to drying under higher temperature leads to
25
faster drying process and the reaction proceeds at greater speed with higher kinetic energy. The associated kinetic data are tabulated in Table 4.2.
Figure 4.4 Drying Curve of Moisture Ratio at Different Temperature
Table 4.2 Kinetic Data
Temperature (°C) k (min-1) Drying Time (min)
100 0.1168 47
120 0.1284 38
140 0.1419 38
160 0.1617 32
180 0.2089 18
It is clear that the higher the drying temperature, the higher the rate constant obtained and drying time will consequently be shorter due to the higher reaction rate of the drying process. Furthermore, from the rate constants above, a plot of ln k against 1/T will give a reasonable straight line of gradient –Ea/R (E is activation energy in J/mol and R is gas constant of 8.314 J/mol). Thus, the activation energy, Ea, needed to be overcome in order for the drying process to happen is measured from this line with a value of 989.03
0 1 2 3 4 5 6 7
0 10 20 30 40 50 60
-ln MR
Time, min
100 120 140 160 180
°C
°C
°C
°C
°C
26
J/mol for drying under temperature of 100°C to 180 °C which also indicates the sensitivity of the reaction rate to temperature.
Figure 4.5 Plot of ln k against 1/T 4.3 Effect of Initial Water Content
The data obtained from the experiments are indicated in Figure 4.6 and 4.7 showing the change in moisture content and drying rate over time for different ionic liquid to initial water content ratio of 1:4, 1:3, 1:2, 1:1 and 2:1 with constant drying temperature settings of 100°C. The ionic liquid used is 1-butyl-3-methylimidazolium chloride for all samples.
4.3.1 Drying Curves
From the results obtained, Figure 4.6 is similar to that of typical moisture content plot for normal drying process whereby the graphs decrease at higher slopes and gradually coming into a constant moisture content which is indicated by the equilibrium
y = -118.96x - 1.0211
R² = 0.8579 -2.2
-2.1 -2 -1.9 -1.8 -1.7 -1.6
0.005 0.0055 0.006 0.0065 0.007 0.0075 0.008 0.0085 0.009 0.0095 0.01
Natural Logarithm of Rate Constant (ln K)
1/Temperature (°C)
Slope = -Ea/R = -118.96
27
moisture content for all five samples of [bmim][Cl]. The reason behind this is as explained in previous section for the Effect of Drying Temperature. Referring to Figure 4.7, the shape of the drying rate curve is different to the typical drying rate curve shown in Chapter 2. There are only two phases of drying, initial period and falling rate period observed from the plots. The initial or rising rate period is very short and occurred just at the beginning of the drying process due to the rising temperature of the samples which directly improved the evaporation of free moisture on the ionic liquid surface. By increasing the initial water content in the [bmim][Cl] samples, more free moisture persists on the surface of ionic liquid. The falling rate period was the main drying process, during which internal diffusion dominated the moisture transfer in the samples.
Figure 4.6 Drying Curve of Moisture Content versus Time at Different Water Content
20 30 40 50 60 70 80 90 100
0 10 20 30 40 50 60
Moisture Content, %
Time, min
01:04 01:03 01:02 01:01 02:01 Ratio IL:H20
28
Figure 4.7 Drying Curve of Drying Rate versus Time at Different Water Content Table 4.3 Experimental Data from Drying Curves
Ratio Max Drying Rate (g/min) MCinfinity (%)
1:4 0.079 26.26
1:3 0.073 27.50
1:2 0.059 36.92
1:1 0.036 45.19
2:1 0.019 67.52
4.3.2 Analysis on Drying Kinetic
Furthermore, from both Figure 4.6 and 4.7, it is observed that the moisture content decreases faster and in larger amount for higher initial water concentration, the highest with ratio 1:4 and the lowest water content ratio is 2:1, with decreasing maximum drying rate (Table 4.3). This is because water molecules can form hydrogen bonds with ionic liquid cations and anions. At low water concentrations, water molecules complex primarily with anions rather than with other water molecules and form clusters at high water concentrations. Although the anion is smaller than the cation, the anion diffusivity can be lower. Thus, at low water concentrations, it is more difficult for the water molecules to evaporate to the atmosphere due to the stronger molecular
-0.01 5E-17 0.01 0.02 0.03 0.04 0.05 0.06 0.07 0.08
0 10 20 30 40 50 60
Drying Rate, g/min
Time, min
01:04 01:03 01:02 01:01 02:01 Ratio IL:H20
29
interactions with ionic liquid anions. This also explains why the final moisture content is lowest for sample with ratio 1:4 (26.26%) and highest for sample of ratio 2:1 (67.52%).
It can also be associated with the drying rate constant, k (min-1). Higher rate constant is obtained for drying of ionic liquid sample with higher water concentration as can be seen from Figure 4.8 whereby the slope of the curve is higher. For higher initial water ratio, the drying process is faster and the reaction proceeds at greater speed.
Figure 4.8 Drying Curve of Moisture Ratio at Different Ratio Table 4.4 Kinetic Data
Ratio k (min-1) Drying Time (min)
1:4 0.1504 34
1:3 0.1348 36
1:2 0.1205 38
1:1 0.1168 47
2:1 0.0974 50
It is observed that the higher the initial water concentration, the higher the rate constant obtained and drying time will consequently be shorter due to the higher reaction rate of the drying process.
0 1 2 3 4 5 6 7 8
0 10 20 30 40 50 60
-ln MR
Time, min
01:04 01:03 01:02 01:01 02:01 Ratio IL:H20
30
4.4 Effect of Different Types of Cation and Anion
The data obtained from the experiments are indicated in Figure 4.9, 4.10, 4.11, 4.12, 4.13 and 4.14 showing the change in moisture content and drying rate over time for different types of ionic liquid with constant ionic liquid to initial water content ratio of 1:1 and drying temperature settings of 100°C. The ionic liquids used are:
i. 1-butyl-3-methylimidazolium chloride, [bmim][Cl]
ii. 1-butyl-3-methylimidazolium dicyanamide, [bmim][DCA]
iii. 1-butyl-3-methylimidazolium methylsulfate, [bmim][MeSO4] iv. 1-ethyl-3-methylimidazolium hydrogensulfate, [emim][HSO4]
v. 1-butyl-3-methylimidazolium tris(pentafluoroethyl)-trifluorophosphate, [bmim][(C2F5)3PF3]
vi. 1,3-dimethylimidazolium dimethylphosphate, [mmim][DMP]
The different samples of ionic liquids are chosen based on their alkyl chain and size of anion. Different length of alkyl chain comprising of butyl, ethyl and dimethyl may affect many ionic liquid properties especially its size and density resulting in different abilities in holding and dissociating water molecules between ionic liquid particles. In addition, it is also desired to observe the behaviour of drying curve for different ionic liquid anion (SO4 and phosphate) to see the extent of hydrogen bonding between the anion and water molecules inside the ionic liquid and the effect on its drying kinetic. To compare the effects of different types of cation and anion towards drying curve of these ionic liquid samples, the plots are separated into three categories based on similar cation or anion:
i. [bmim] cation (Figure 4.9 and 4.10) ii. [SO4]- anion (Figure 4.11 and 4.12)
iii. Phosphate-containing anion (Figure 4.13 and 4.14) 4.4.1 Drying Curves
From all the results obtained, the plot of moisture content is similar to that of typical moisture content plot for normal drying process whereby the graphs initially decrease at higher slopes and gradually coming into a constant moisture content which is indicated by the equilibrium moisture content. The reason behind this is as explained in previous section for the Effect of Drying Temperature. Referring to the drying rate curve of all
31
types of ionic liquid samples, the shape of the curve is different to the typical drying rate curve shown in Chapter 2. There are only two phases of drying, initial period and falling rate period observed from the plots similar to the previous results of different drying temperatures and initial water contents.
In addition, from Figure 4.9, the shapes of the graph are very similar to each other with final moisture content ranging around 45% for all four samples which shows the role of [bmim] cation in determining the extent to which water molecules can be stored and subsequently released in the ionic liquid samples. However, the moisture content decreases fastest with highest maximum drying rate and in largest amount for [bmim][MeSO4] and the lowest amount of dehydration with minimum drying rate is observed for [bmim][(C2F5)3PF3] due to the different extent of hydrogen bonding between the water molecules and the anion in the four samples. When paired with the 1- butyl-3-methylimidazolium cation, the hydrogen-bond basicity of the anion determines the amount of energy needed to break the water molecules bond from ionic liquid particles and consequently this will also affect its kinetic of drying.
Figure 4.9 Drying Curve of Moisture Content versus Time for [bmim] Cation
40 50 60 70 80 90 100
0 10 20 30 40 50 60
Mositure Content, %
Time, min BMIM CL BMIM MeSO4 BMIM (C2F5)3PF3 BMIM DCA
MeSO4 (C2F5)3PF3
32
Figure 4.10 Drying Curve of Drying Rate versus Time for [bmim] Cation
Moving on to Figure 4.11 and 4.12, the shapes of the graph are very similar to each other. However, the moisture content decreases faster with higher maximum drying rate and in larger amount for [emim][HSO4] compared to [bmim][MeSO4] with final moisture content of 8.16% for [emim][HSO4] and 45.11% for [bmim][MeSO4]. This is due to the different length of alkyl chain whereby [emim][HSO4] chain is shorter than [bmim][MeSO4]. Longer alkyl chain has more free volume which enables more water molecules to be contained and bonded with the ionic liquid particles resulting in slower drying process. [emim][HSO4] also shows the closest resemblance to the typical drying rate curve with all three phases of drying including the constant rate period.
Furthermore, during the experiment, the sample of [emim][HSO4] tends to vaporize especially when heat is applied to it resulting in greater reduction in its weight after drying. It is also observed that the drying process stops after 24 minutes for [emim][HSO4] which is faster than [bmim][MeSO4] (Table 4.7).
-0.01 0 0.01 0.02 0.03 0.04 0.05
0 10 20 30 40 50 60
Drying Rate, g/min
Time, min BMIM CL BMIM MeSO4 BMIM (C2F5)3PF3 BMIM DCA
MeSO4
(C2F5)3PF3
33
Figure 4.11 Drying Curve of Moisture Content versus Time for [SO4]- Anion
Figure 4.12 Drying Curve of Drying Rate versus Time for [SO4]- Anion
Finally, referring to Figure 4.13 and 4.14, the shapes of the graph are very similar to each other with final moisture content of 44.95% for [bmim][(C2F5)3PF3] and 48.23% for [mmim][DMP]. Although the alkyl chain of [mmim][DMP] is shorter, it contains more water after the drying process due to the stronger hydrogen bonding between its anion and water molecules compared to [bmim][(C2F5)3PF3]. Initially, the moisture content decreases faster and in larger amount for [mmim][DMP] which shows
0 10 20 30 40 50 60 70 80 90 100
0 10 20 30 40 50 60
Moisture Content, %
Time, min BMIM MeSO4 EMIM HSO4
-0.01 0 0.01 0.02 0.03 0.04 0.05
0 10 20 30 40 50 60
Drying Rate, g/min
Time, min BMIM MeSO4 EMIM HSO4
MeSO4 MeSO4
HSO4 HSO4