PREFACE
The National Innovation Survey 2015 (Manufacturing and Services Sector in Malaysia) is the seventh study based on innovation activities conducted from 2012 to 2014. The National Innovation Survey 2015 (Manufacturing and Services Sector in Malaysia) was conducted between March 2015 and March 2016 .
ACKNOWLEDGEMENT
MASTIC is particularly grateful to the members of the Technical Committee and Steering Committee for their advice and input on this report. Special thanks must go to those who participated in the study, as well as consultants and members of the research team from Uni-Technologies Sdn.
RESEARCH TEAM
EXECUTIVE SUMMARY
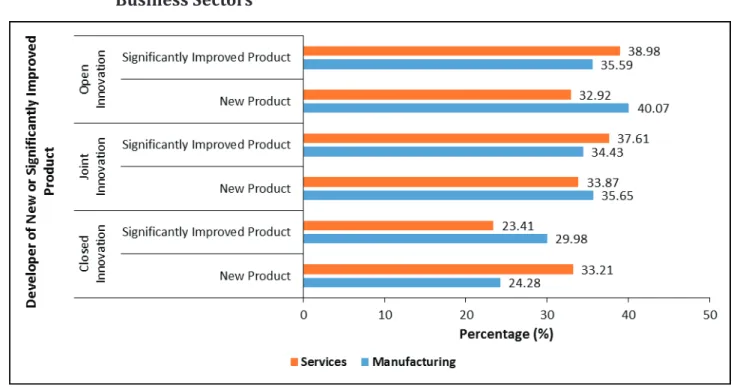
Open, closed and joint innovation methods were used to materialize innovation activities in both sectors. Marketing innovation activities were also carried out in both sectors by launching new or significantly improved product design or packaging, distribution and pricing.
KEY INDICATORS
Another important facet of innovation is to increase human capital capacity, which is to increase the number of higher degree (PhD) graduates, and to encourage more research. The last piece is to promote more competitive market in Malaysia, and to encourage companies to venture into global markets.
LIST OF TABLES
Based on business sectors and company size 85 Figure 5.33: Intellectual property used and granted based on.
LIST OF BOX ARTICLES
INTRODUCTION
INTRODUCTION
- Introduction
- Objectives of the Study
- Scope of the Study
- Innovation Survey
- Case Study of Innovation Companies
- Improvements from Previous Study
To benchmark the status of Malaysian national innovation activities compared to other countries globally (Through this study, data related to the status of innovation activities in manufacturing and service sectors will be provided, based on the standards of the UNESCO Institute for Statistics (UIS) for international comparisons; and.Non-innovative – Any company that has not implemented four (4) innovation activities during the period under review.
LITERATURE REVIEW
LITERATURE REVIEW
- The De�inition of Innovation
- The Role of Innovation in a Company
- Measurement of Innovation
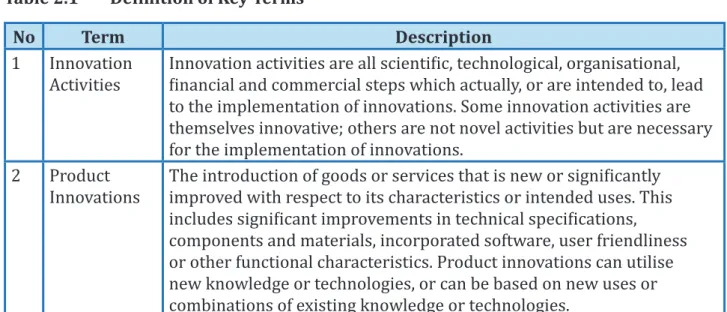
- De�inition of Terms
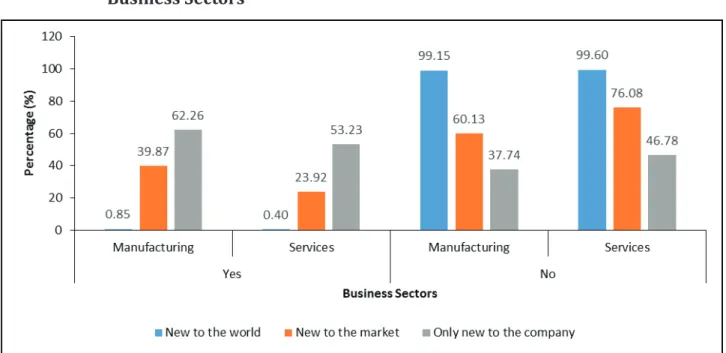
According to the Oslo Manual 3rd Edition (2005), innovation includes product, process, marketing and organizational innovations. 9 New to the market An innovation is new to the market when the firm is the first to introduce the innovation for their market.
SURVEY METHODOLOGY
SURVEY METHODOLOGY
- Methodology
- Sources of data
- Questionnaire Design
- Population and sampling
- Field Work Study
- Data Analysis
- Interview Process and Analysis
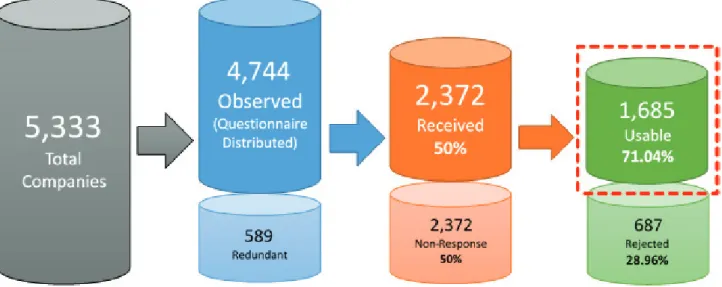
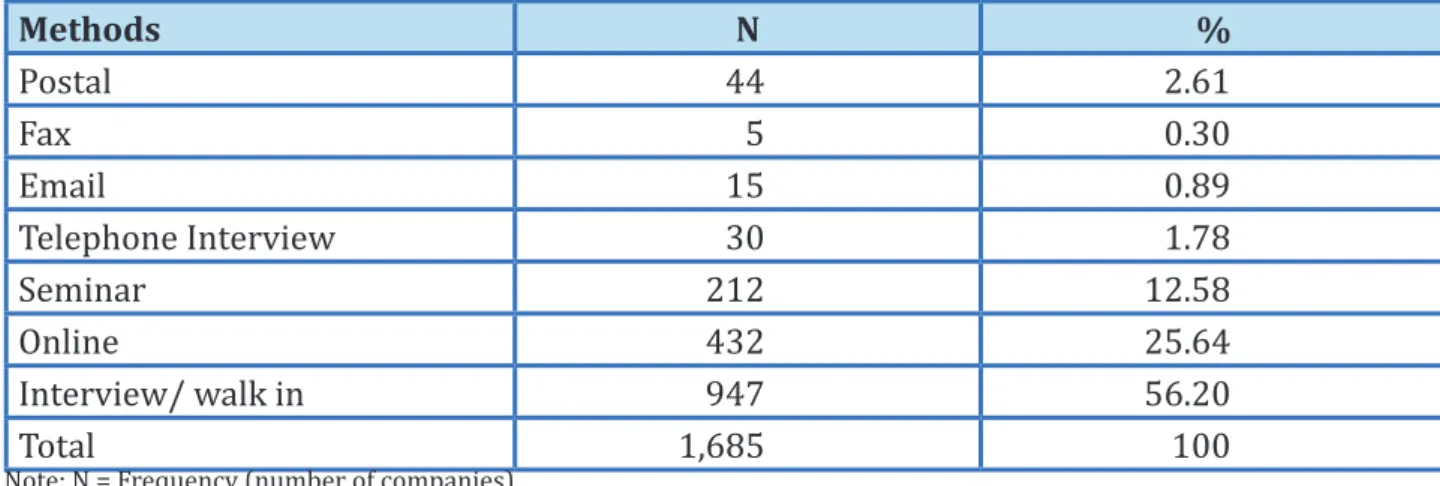
Primary data is collected through questionnaires distributed to companies in the manufacturing and service sectors as identified by the Department of Statistics Malaysia (DOSM). The structure and approach of the questionnaire were developed to attract respondents to participate in the study.
PROFILE OF COMPANIES
PROFILE OF COMPANIES
- Introduction
- Questionnaires Administered
- Innovative and Non-Innovative Respondents Based on States
- Innovative and Non-Innovative Respondents Based on Sectors
- Pro�ile of Innovative Companies
- Types of Ownership of Companies by Sectors
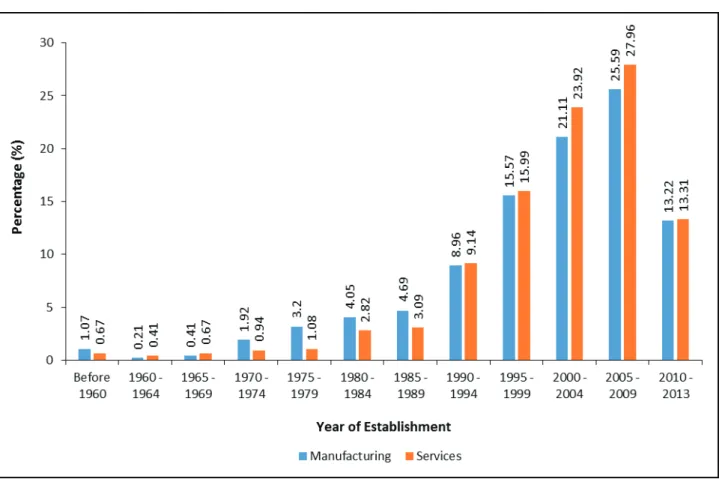
- Classi�ication of Companies Based on Year of Establishment
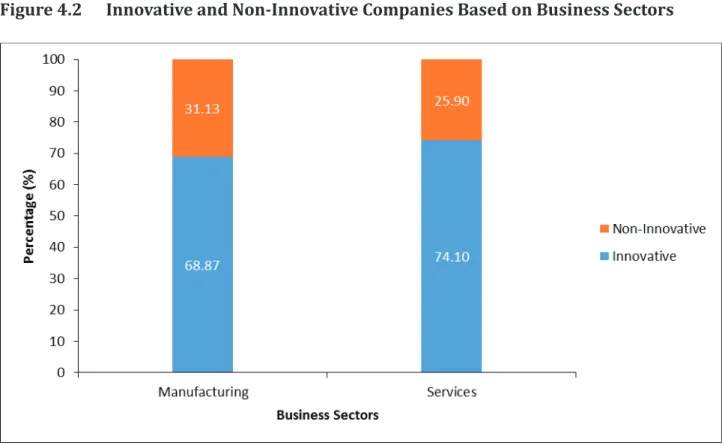
This chapter describes the profile of the companies from different aspects based on the sectors involved, i.e. based on the number of respondents from manufacturing and service sectors, majority of the innovative respondents were from service sector with 74.10%, while 68, 87% were from the manufacturing sector.
PROFILE OF COMP ANIES
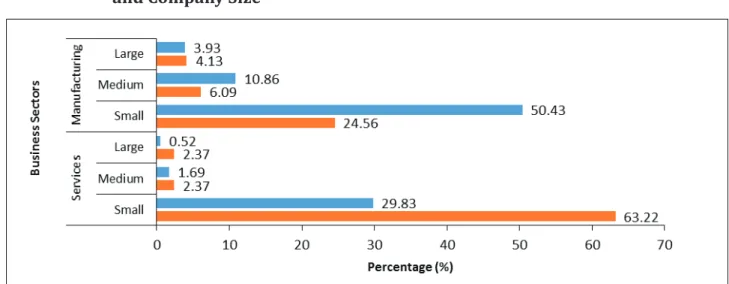
- Size of Companies Based on Sectors
- Companies Annual Sales
- Expenditure on Innovation Activities Based on Sectors
- Conclusion and Comparisons with NSI 2012
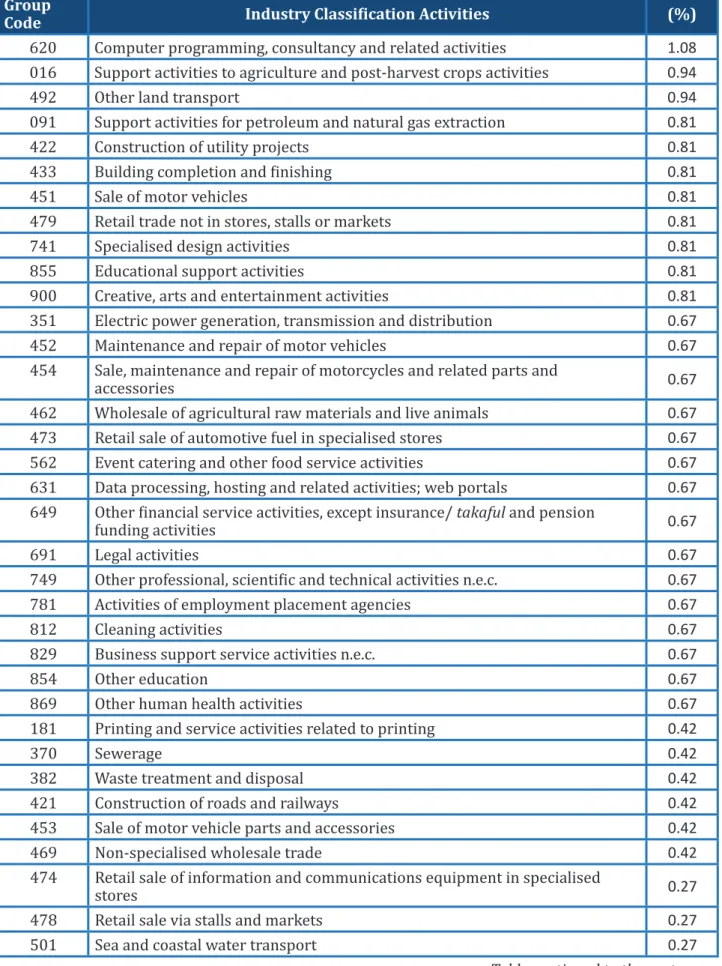
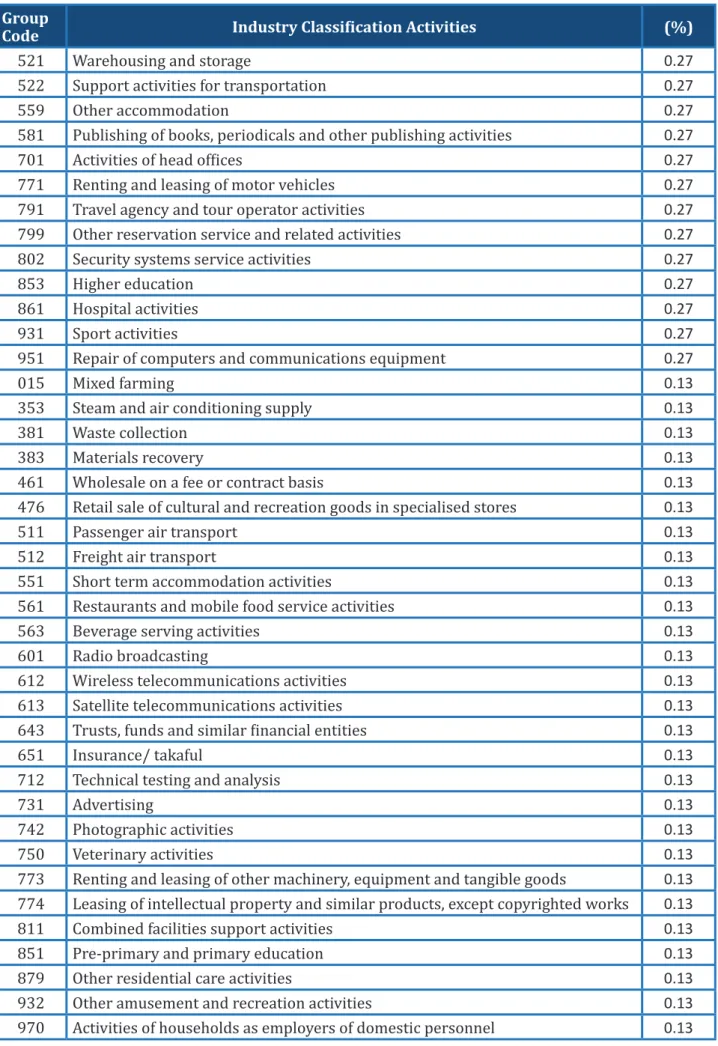
259 Manufacture of metal products; metallurgical service activities 4.26 210 Production of pharmaceutical, medical chemical and botanical products 3.62. 303 Production of aircraft and space vehicles and related machinery 0.21 Table 4.8 Activities of companies according to the service sector.
INNOVATION ACTIVITIES
INNOVATION ACTIVITIES
- Introduction
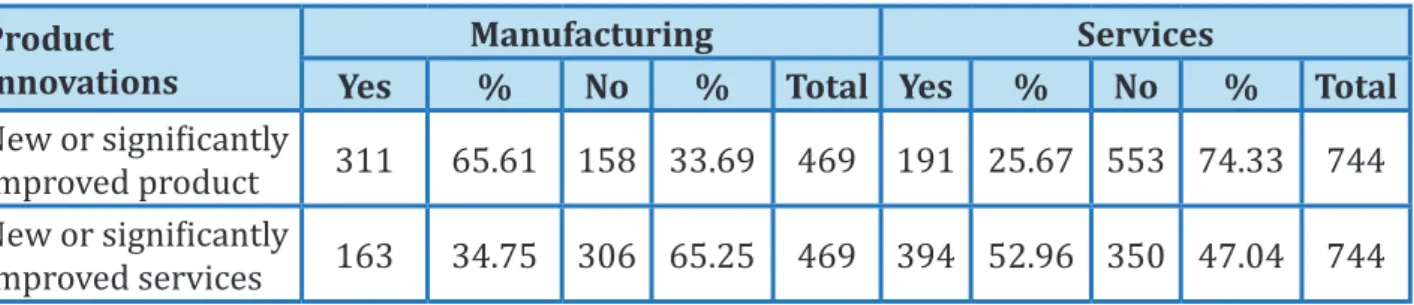
- Product Innovation
- Process Innovation
- Marketing Innovation
- Organisational Innovation
- Abandoned and On-Going Innovation Activities
- Rating on Performance of Innovation Activities
- Government Support
- Funding for Innovation Activities
- Innovation Cooperation
- Sources of Information for Innovation
- Intellectual Property and Protection Method
- The Importance of IP Protection
- Factors Hampering Innovation Activities
- Conclusion and Comparisons with NSI 2012
For both the manufacturing and services sectors, more innovations are presented as new to the company with 292 products and 396 products respectively. While providing special cleaning services, the company has also accumulated special equipment. Based on the company's innovation, it has been evaluated and evaluated by implementing the innovation and marketing process.
Regarding the service sector, large companies considered other companies within the company group and suppliers of equipment, materials and components as their most important partners with an average score of 2.0 for each partner.
BENCHMARKING & INTERNA- TIONAL COMPARISONS
BENCHMARKING & INTERNATIONAL COMPARISONS
- Introduction
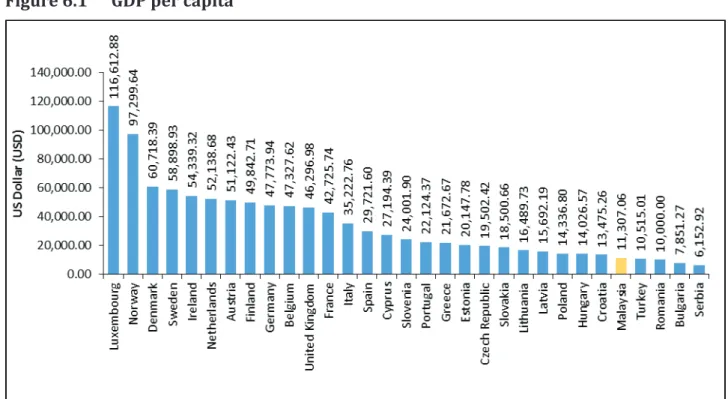
- Economic Characteristics of Countries Compared
- Comparison with Community Innovation Survey (CIS) 2010-2012
- Global Competitiveness Report (GCR)
- Global Innovation Index (GII)
- Innovation Ef�iciency Index (IEI)
- Comparison of International Patent Applications
- Conclusion
All other countries in the Southeast Asian countries (SEA) were lower than Malaysia. In the innovation factor, Switzerland had the highest position, followed by Finland, the USA and Japan. For the business sophistication factor, Switzerland was again in the highest position, followed by Japan, Germany, the United States and the Netherlands.
For both of these factor components together, Switzerland was ranked in the highest position, followed by Japan, Germany, the USA and Finland, respectively. Comparing nations in the Southeast Asia region, Singapore was ranked 1st for innovation, followed by Malaysia, Indonesia and Thailand respectively. Nevertheless, Malaysia has improved its ranking gradually over the years in terms of innovation and competitiveness.
The Innovation Efficiency Index (IEI) is a tool used to measure the innovation efficiency of countries around the world according to their income groups and regional groups. Malaysia was ranked 9th among middle-income economies and 38th globally in terms of quality of innovation metrics. Compared to other neighboring countries in the Southeast Asian region, Malaysia ranks third behind Singapore and Indonesia.
DISCUSSION & RECOMMENDA- TIONS
DISCUSSION & RECOMMENDATIONS
- Introduction
- Innovation Parameters
- Status of Innovative Companies
- Innovation Activities Implemented from 2012 – 2014
- Source of Information for Innovativeness and Impact
- Government Support
- Cooperation and Collaboration
- Intellectual Property Applications and Protection
- Innovation Barriers/ Hampering Factors
- Recommendations to Increase Innovation Activities in Malaysia
- Strengthening the Innovation Ecosystem
- Promoting Innovative Culture amongst SMLs Sector and Education Sector
- Increase Cooperation between Companies
- Increases in R&D, Innovation and IPs Funding
- Generating and Disseminating Information on Innovations
- Supporting the Innovation Product and Services
- Innovating by External Sources
- Increase Human Capital Capacity
- Promote Competitive Market
- Extensive Promotion during NSI Survey is Conducted
- Conclusion
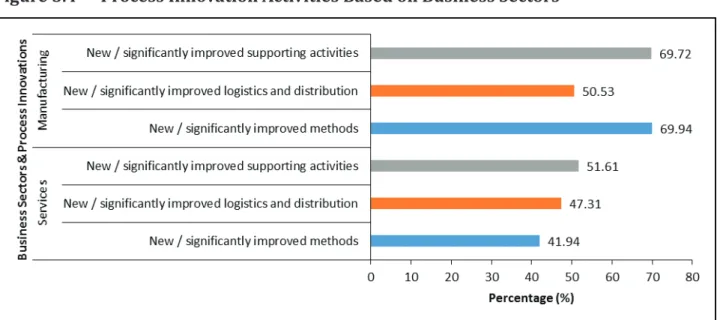
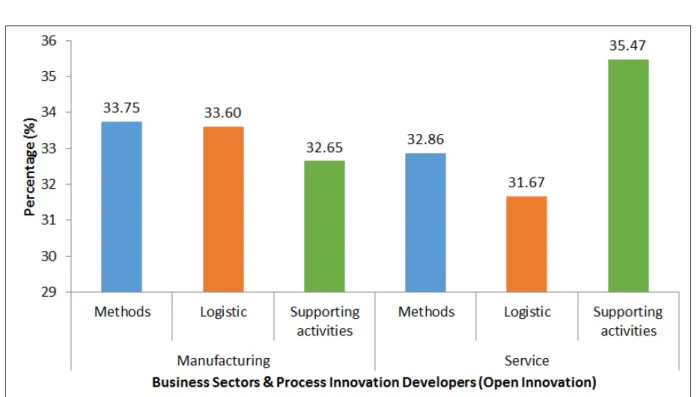
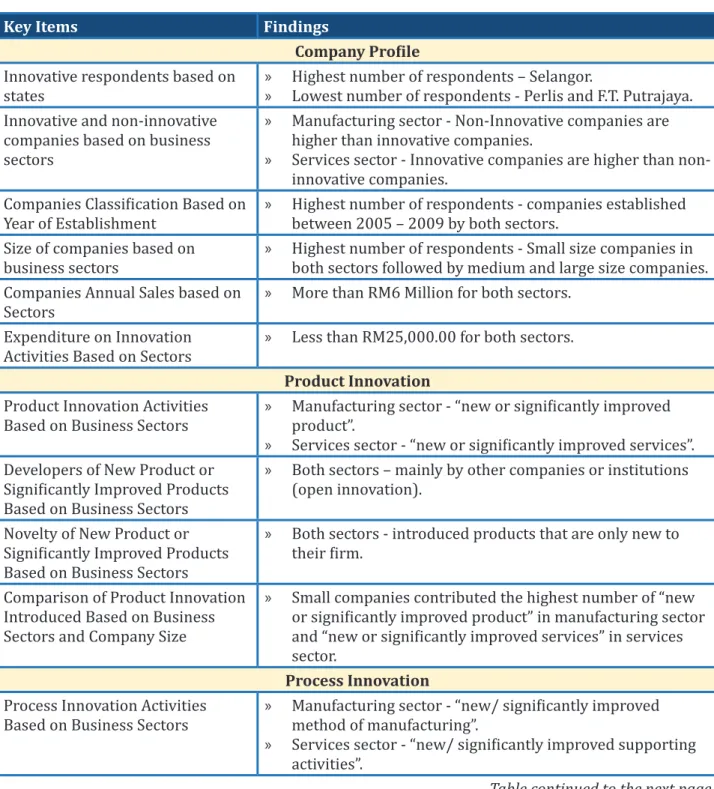
Regarding product innovation (Chapter 5, point 5.2), most companies in the manufacturing sector produced "new and significantly improved products". This trend was similar in the service sector, where most companies offer "new and significantly improved services". For process innovation activities (Chapter 5, point 5.3), most firms in the manufacturing sector introduced "new or significantly improved production methods", while most service firms introduced "new or significantly improved support activities".
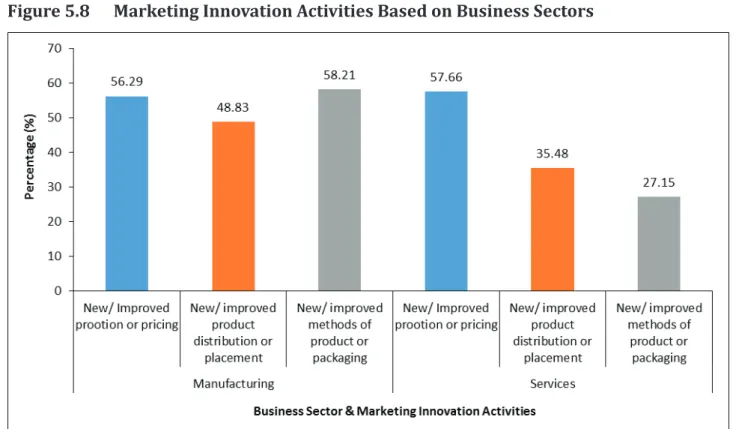
The study of marketing innovation activities (chapter 5, point 5.4) showed that a majority of companies in the manufacturing sector introduced 'new or improved methods of product design or packaging', while a majority of companies in the service sector focused on introducing 'new and improved promotion or pricing'. Another type of innovation activities uncovered in this study is organizational innovation (chapter 5, point 5.5), where most companies in production activities focused on 'new or improved workplace organisation'. Meanwhile, a majority of companies in the service sector implemented "new or improved methods in the company's business practices".
The main form of government support received by companies in the manufacturing sector is technical support and technical advice for the service sector. This conclusion responds to the eighth objective of this study, and details of the discussions can be found in Chapter 5 of the analysis, point 5.14. Information on innovation is also needed to measure the level of innovation in a country.
WAY FORWARD
AND CONCLUSIONS
MOVING FORWARD & CON- CLUSIONS
WAY FORWARD AND CONCLUSIONS
- Where We Are Now – in a Nutshell
- Analysis of Critical Areas and Action Plan Based on Study Findings
- Product Innovation
- Degree of Importance of Objectives on Innovation Activities
- Government Support for Innovation
- Cooperation for Innovation Activities
- Innovation Barriers
- Limitations of the Study
- Future Research
- Conclusion
Innovation activities by company size »» For all company sizes – “Improved quality of goods and services”. Received by company size »» Small businesses generally received more support than large and medium-sized businesses. Ranking »» Malaysia's ranking for the Innovation Efficiency Index by Region Group (SEAO) is at 8th position, which is better than Thailand (10th position) and Indonesia (14th position).
Applications in 2014 »» Malaysia's ranking for global patent applications in 2014 based on Patent Applied is in 14th position, which is better than the Philippines (15th position). Based on the study findings, this section highlights five critical areas that are essential to shed light on relevant government agencies to formulate and implement innovation strategies for SMLs in both manufacturing and service industries. Based on the results, several measures can be taken to strengthen the cooperation between SMLs and GRIs as shown in table 8.5 below.
The data collected is based on the number of companies willing to participate in the survey. Radical innovation is very important for Malaysia to be a high-income and developed country based on a knowledge-driven economy.
APPENDIX A: Questionnaire Survey
QUESTIONNAIRE
NATIONAL SURVEY OF INNOVATION 2015 FOR THE FINANCIAL YEAR: 2012, 2013 and 2014
DEMOGRAPHY
16 Wood and products of wood and cork, except furniture; manufacture of goods from straw and wicker materials. 25 Fabricated metal products except machinery and equipment 251 Manufacture of structural metal products, tanks, reservoirs and steam.
GENERAL INFORMATION ABOUT YOUR COMPANY
302 Manufacture of railway locomotives and rolling stock 303 Manufacture of aircraft and spacecraft and related machinery. 351 Production, transmission and distribution of electricity 352 Production of gas; distribution of gaseous fuels through the network.
ON-GOING OR ABANDONED INNOVATION ACTIVITIES
Innovation activities include the purchase of machinery, equipment, software and licenses; engineering and development work, training, marketing and R&D when undertaken specifically to develop and/or implement a product, process, marketing or organizational innovation.
INNOVATION ACTIVITIES AND EXPENDITURE
R&D The same activities as above, but purchased by your company and carried out by other companies (including other companies within your group) or by public or private research organisations. Purchase of advanced machinery, equipment and computer hardware or software to produce new or significantly improved goods, services, production processes or delivery methods. Purchase or licensing of patents and non-patented inventions, know-how and other types of knowledge from other companies or organizations.
Training Internal or external training for your personnel aimed directly at the development and/or introduction of innovations. Activities for market preparation and introduction of new or significantly improved goods and services, including market research and advertising launch. Activities related to the development and implementation of the new marketing method, including the acquisition of other external knowledge and other capital goods specifically related to marketing activities.
Activities related to the development and implementation of new organizational methods, including the acquisition of other external knowledge and other capital goods that are specifically related to organizational activities.
OBJECTIVES AND EFFECTS OF INNOVATION
Improved flexibility of production or services Increased capacity for production or services Lower labor costs per unit produced or delivered Reduction of materials and energy per unit produced or delivered.
GOVERNMENT SUPPORT FOR INNOVATION
Has your company had any collaboration agreements on innovation activities with other companies or institutions during 2012-2014. YES Please indicate by ticking the type of organization and location of your business partner.
FUNDING
INNOVATION CO-OPERATION
PATENT & OTHER PROTECTION METHODS SECTION 10: SOURCES OF INFORMATION FOR INNOVATION
Proprietary patent/industrial design turnover percentage of total turnover as stated in the question.
HAMPERING FACTORS
MARDI Malaysian Agricultural Research and Development Institute MASTIC Malaysian Science and Technology Information Center MDEC Malaysia Digital Economy Corporation. MSIC Malaysia Standard Industrial Classification MTDC Malaysian Technology Development Corporation MylPO Intellectual Property Corporation of Malaysia. Companies Commission of Malaysia) STI Science, Technology and Innovation TalentCorp Talent Corporation Malaysia Berhad TAF Technology Acquisition Fund.