1
CHAPTER 1 INTRODUCTION
1.1. Background of Study
Monitor water level using transmitter or radar is commonly known but it is different when it comes to wireless sensor. This is because wireless sensor is not a common device use for monitor water level. This is something new especially for those who work in industrial field. Nowadays, some company also in the process of doing experiment to use wireless sensor to monitor water level which will be implemented at the plant. The reason why the wireless sensor is use for monitoring water level will be discussed in detail in discussion part.
1.2. Problem Statement
Today the most common ways used to monitor water level especially at the plant (which are the main target) are differential pressure (DP) transmitter, gauge glasses or radar. But by using this method there are several problems that occur mainly from maintenance aspect. To do maintenance of course it needs a lot of money. Because of this reason we try to overcome the problem by using wireless sensor to lower the maintenance cost. Since the wireless sensor chosen is ZigBee, it has low power consumption. It means that the battery life is longer than the usual sensor like DP transmitter. It is because ZigBee battery life can last until 5 years compared to DP transmitter which can only last about two years. So, with this advantage of ZigBee, the work for maintenance can be reduced.
2 1.3. Objectives
There are five objectives for this project which are:
1. Develop level sensor circuit.
2. Study on interface of ZigBee receiver to PC.
3. Study on GUI on PC for data collection and monitoring.
4. Configure program for wireless transmitter and receiver based on ZigBee devices.
5. Develop a prototype of the system
1.4. Scope of Study
The scope of the project covers the type of water level circuit that will be used and the programming for wireless transmitter and receiver based on ZigBee devices. It also covers on interface of ZigBee receiver to PC. Then the PC will display the data using GUI (Graphical User Interface). Finally the prototype of the wireless sensor for monitoring water level will be developed. To get better understanding about this project, the figure below shows the block diagram for water level monitoring using wireless sensor.
Figure 1: Block Diagram for Water Level Monitoring Using Wireless Sensor
3
CHAPTER 2
LITERATURE REVIEW
2.1. Overview of Wireless Communication
The ability to communicate with people on the move has evolved remarkably since Guglielmo Marconi first demonstrated radio’s ability to provide continuous contact with ships sailing the English Channel in 1897 [1]. Beginning from that time, throughout the world new wireless communication methods and services have been widely adopted by people. Mostly during the past ten years, the radio communications industry has grown by orders of magnitude, fuelled by improvements in RF circuit fabrication and digital switching techniques.
The rapid growth has led to the development of new wireless systems, services and consumer electronics products such as to replace copper wires and cables. For example, wireless networks have been increasingly used as a replacement for wires within homes, buildings and office settings through the deployment of wireless local area networks (WLAN). Besides, there are many applications of wireless communication, such as telecommunication system, intercoms and security systems.
4 2.2. Wireless Sensor Technology
2.2.1. Communication Protocol
Basically there are four communication protocols used with wireless sensor network. The protocols are IEEE 802.15.4/ZigBee, Wireless Interface to Sensors and Actuators (WISA), wirelessHART and ISA100.
Wireless Interface for Sensors and Actuators (WISA) is developed by ABB and the concept is striving for wireless factory automation. The concept of the WISA system provides in addition to wireless communication also a wireless magnetic powering system. The wireless communication and the wireless power supply are named WISA-COM respective WISA-POWER. The WISA-concept was first applied to Wireless Proximity Switches (WPS), which were presented for the first time during 2002 at the Hanover Fair. Because the technology is generic it is not restricted to proximity switches but can be applied to other products as well. [2]
WirelessHART (WiHART) which is developed by the HART Communications Foundation (HCF) is a wireless network implementation of the HART communications protocol standard. WiHART uses the same message and command structures as wired, 4-20 mA HART devices which are widely used in industrial applications. It is specifically designed to leverage wireless standards and provide robust and reliable wireless communications in a tough industrial environment. [3]
For this project, ZigBee is chosen for the wireless sensor network. A key component of the ZigBee protocol is the ability to support mesh networking. In a mesh network, nodes are interconnected with other nodes so that multiple pathways connect each node. Connections between nodes are dynamically updated and optimized through sophisticated, built-in mesh routing table.
5
Mesh networks are decentralized in nature; each node is capable of self- discovery on the network. Also, as nodes leave the network, the mesh topology allows the nodes to reconfigure routing paths based on the new network structure.
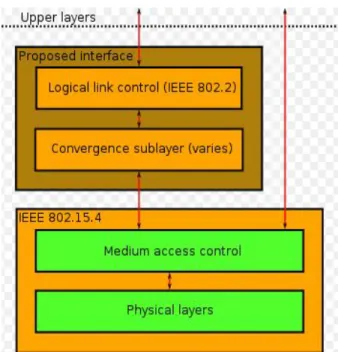
The characteristics of mesh topology and ad-hoc routing provide greater stability in changing conditions or failure at single nodes [4]. Below is the figure of IEEE
802.15.4 protocol stack.
Figure 2: IEEE 802.15.4 Protocol Stack
6
The reason for chosen ZigBee is because it carries all benefits of IEEE 802.15.4 (see Appendix A). Besides, it also provides low duty cycle. It means that it has long battery life which is about five years. Since it has low time delay, it can transmit and receive data faster. Listed below is the other reason why ZigBee is chosen for this project:
a) Carries all the benefits of the 802.15.4 b) Low duty cycle (provides long battery life) c) Low latency
d) Support for multiple network topologies (static, dynamic, star and mesh) e) Up to 65 000 nodes on a network
f) 128-bit AES encryption ( provides secure connection between devices) g) Link quality indication
h) Clear channel assessment
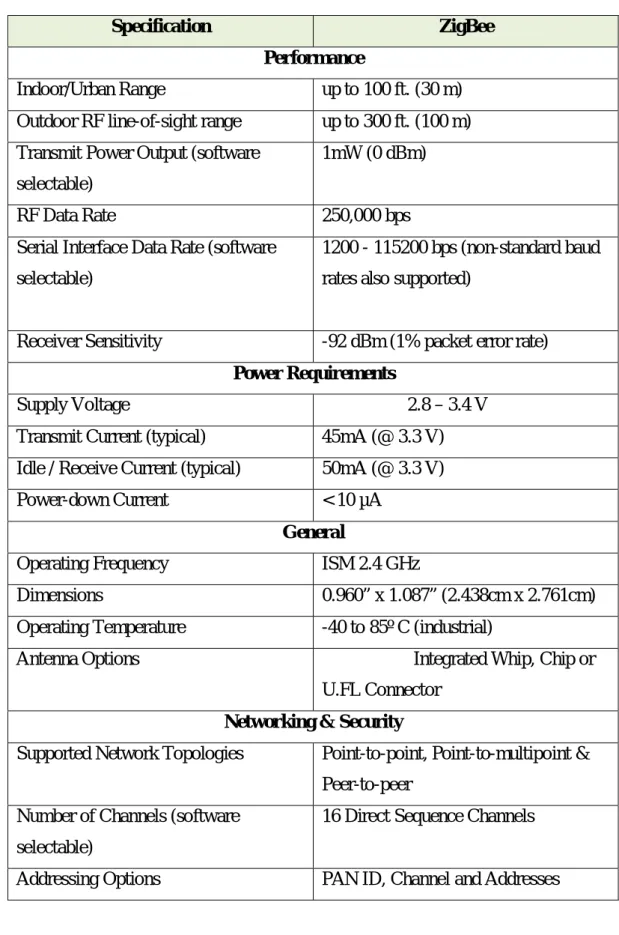
In addition, there are several specifications for ZigBee which are related to this project. The range of indoor or urban of ZigBee can up until 100 ft or 30 m while the outdoor line-of-sight range can up until 300ft or 100m.
Tables below show the other specification for ZigBee and the pin assignment for ZigBee module.
7
Table 1: Specification of ZigBee
Specification ZigBee
Performance
Indoor/Urban Range up to 100 ft. (30 m) Outdoor RF line-of-sight range up to 300 ft. (100 m) Transmit Power Output (software
selectable)
1mW (0 dBm)
RF Data Rate 250,000 bps
Serial Interface Data Rate (software selectable)
1200 - 115200 bps (non-standard baud rates also supported)
Receiver Sensitivity -92 dBm (1% packet error rate) Power Requirements
Supply Voltage 2.8 – 3.4 V
Transmit Current (typical) 45mA (@ 3.3 V) Idle / Receive Current (typical) 50mA (@ 3.3 V)
Power-down Current < 10 µA
General
Operating Frequency ISM 2.4 GHz
Dimensions 0.960” x 1.087” (2.438cm x 2.761cm)
Operating Temperature -40 to 85º C (industrial)
Antenna Options Integrated Whip, Chip or
U.FL Connector Networking & Security
Supported Network Topologies Point-to-point, Point-to-multipoint &
Peer-to-peer Number of Channels (software
selectable)
16 Direct Sequence Channels Addressing Options PAN ID, Channel and Addresses
8
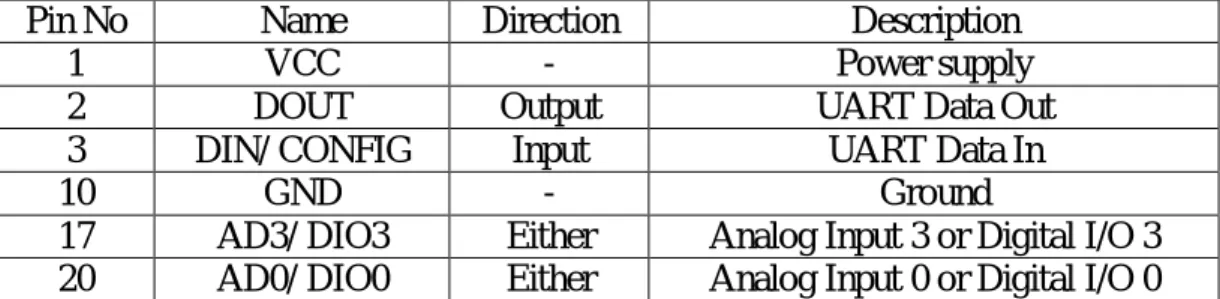
Table 2: ZigBee's Pin Assignment
Pin No Name Direction Description
1 VCC - Power supply
2 DOUT Output UART Data Out
3 DIN/ CONFIG Input UART Data In
10 GND - Ground
17 AD3/ DIO3 Either Analog Input 3 or Digital I/O 3 20 AD0/ DIO0 Either Analog Input 0 or Digital I/O 0
For this project, the minimum connections that will be used are pin 1, pin 2, pin 3 and pin 10. But pin 17 and pin 20 also needed to connect with ZigBee RF module as input and output pins. See Appendix B for other pin assignment.
9 2.3. Water Level Sensor
After some researches about the water level sensor circuit, there are some circuit that might be selected for the project.
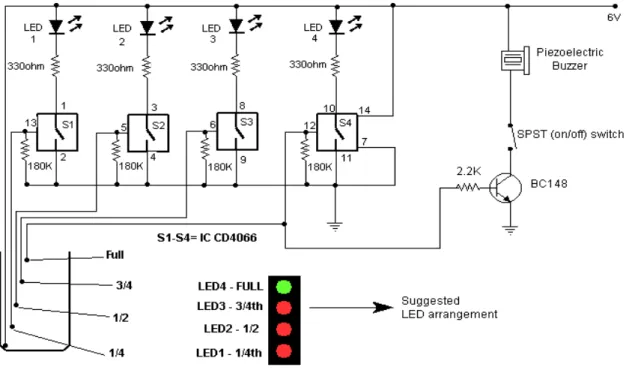
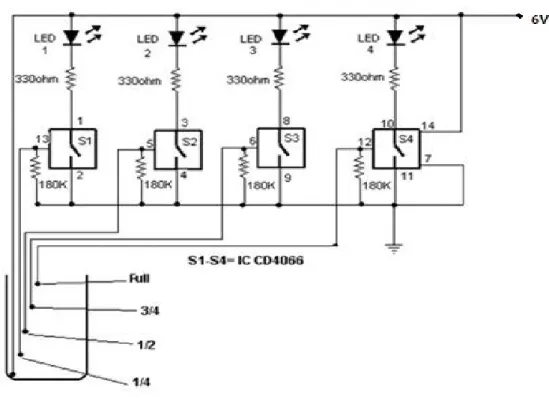
Figure 3: Water Level Indicator with Alarm
The above circuit not only indicates the amount of water present in the overhead tank but also gives an alarm when the tank is full. The circuit uses the widely available CD4066, bilateral switch CMOS IC to indicate the water level through LEDs. When the water is empty the wires in the tank are open circuited and the 180K resistors pulls the switch low hence opening the switch and LEDs are OFF. As the water starts filling up, first the wire in the tank connected to S1 and the supply are shorted by water. This closes the switch S1 and turns the LED1 ON. As the water continues to fill up the tank, the LEDs 2, 3 and 4 lights up gradually. The number of levels of indication can be increased to 8 if 2 CD4066 ICs are used in a similar fashion. When the water is full, the base of the transistor BC148 is pulled high by the water and this saturates the transistor, turning the buzzer ON. The SPST switch has to be opened to turn the buzzer OFF. [5]
10
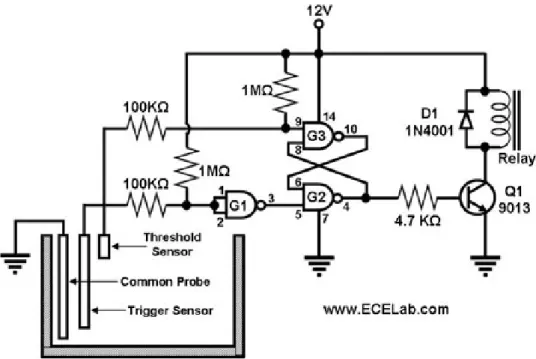
Figure 4: Schematic Diagram for a Water Level Sensor Circuit Figure above shows another circuit for water level. The circuit is for sensing the water level in a tank and turning on or off a water pump accordingly. The main component of the circuit is the CD-4011 Quad NAND gate, three gates of which are used as shown in Figure 1 (gates G1, G2, and G3). G1 is configured as an inverter (both inputs are shorted), while G2 and G3 form an RS flip-flop. The level sensors are just copper or stainless steel wires.
When there is no water in the tank, the trigger sensor is floating and the inputs to G1 are pulled 'high' by their pull-up resistor, causing the output of G1 to be 'low'. This, in turn, causes the output of G2 to be high, turning on Q1 which energizes the relay that power up the water pump. At this point, both of G3's inputs are high, so its output is low.
The water in the tank rises until it reaches the trigger sensor, which 'grounds' G1's inputs, causing G1's output to go 'high'. This does not affect the output of G2, though, since G2's other input (coming from G3) is still 'low'. Thus, at this point, the water pump keeps on filling the tank with water.
11
When the water level reaches the threshold sensor, G3's pin 9 input is pulled 'low', causing the output of G3 to go 'high'. This means that both of G2's inputs are now 'high', causing G2's output to go 'low'. This turns off Q1, de- energizing the relay and shutting off the water pump.
When the water level goes below the trigger sensor, G1's inputs are pulled 'high' again, causing G1's output to go 'low'. This turns on the water pump and the cycle starts all over again [6].
12 2.4. Water Level Monitoring
This system which is designed by Fresscale Semiconductor is mainly about the washing machine. Since currently many washing machine use mechanical sensor for water level sensor for water level detection, they decide to design something difference. Their design will allow the user to evaluate a pressure sensor for both water level sensing to replace a mechanical switch and for water flow measurement. Their system will continuously monitors level and flow of the water using the temperature compensated pressure sensor in low cost design.
Figure 5: Water Level Reference Design Featuring a Pressure Sensor
Hydrostatic pressure which is being measured is the pressure at the bottom of a column of fluid which caused by the weight of the fluid and the pressure of the air above the fluid. Therefore, this hydrostatic pressure depends on the air pressure, the density of the fluid and the height of the column of fluid.
13
P = Pa + ρg∆h
Where P=pressure Pa= pressure
ρ=mass density of fluid
g=9.8066m/s2
h=height of fluid column
To calculate the water height, the measured pressure can be used assuming the atmospheric pressure is already compensated for by the selection of the pressure sensor being gauge.
∆h = P/ρg
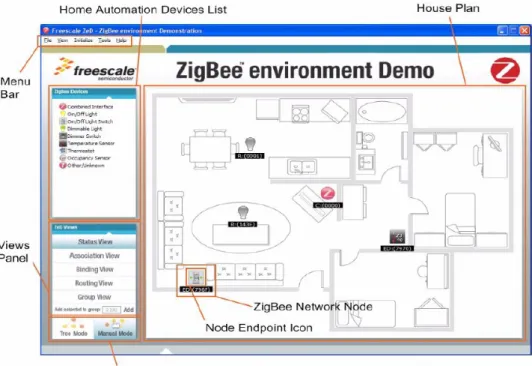
14 2.5. ZeD Software
This software will allows user to set up and also monitor ZigBee devices in a ZigBee network. The features of this software are as follows:
An intuitive and easy-to-go graphical user interface
Provides a practical and easy to follow way to try out examples that demonstrate ZigBee functionality
Real time visualization of the status of the devices in the network
Multi-tabbed windows that show both general and profile-specific information
Figure below show the example of ZeD main window component.
Figure 6: ZeD Main Window Component
15
CHAPTER 3 METHODOLOGY
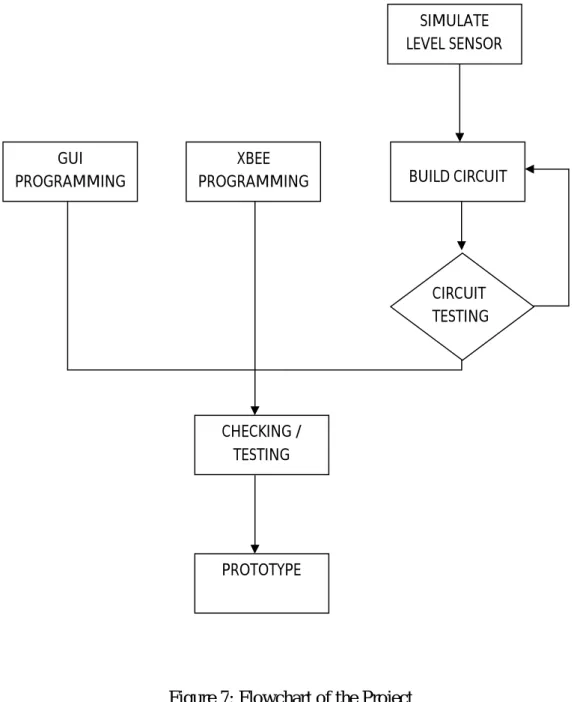
3.1. Procedure Identification
In order to come out with complete prototype, there are several steps that need to be taken. First of all, the suitable water level circuit need to be configured out. Then, the circuit need to be build and tested. If it is not working, some checking needs to be done. After the circuit is successfully working, the ZigBee need to be configure whether it can transmit and receive as expected. The GUI need to be completed in order to have better view of the monitoring system.
Figure below shows the methodology in order to complete this project.
16 PROTOTYPE CHECKING / TESTING GUI
PROGRAMMING
XBEE
PROGRAMMING BUILD CIRCUIT
SIMULATE LEVEL SENSOR
CIRCUIT TESTING
Figure 7: Flowchart of the Project
17 3.2. Tools & Equipment Used
The tools that used throughout this project are:
1. Solder 2. Multimeter 3. Power supply 4. Wire stripper
The software that used to complete this project are:
1. ftdi 2. xctu
18
CHAPTER 4
RESULT AND DISCUSSION
4.1. Result
4.1.1. Water Level
After some discussion with project supervisor, the water level circuit diagram has been modified as shown in figure 8. Since the circuit has been modified, there is no buzzer and transistor compared to the original circuit as shown in figure 3. The circuit use the basic of conductivity to operate. The operation of the modified circuit is still the same with the previous. When there is no water in the tank, no LED will be on. When the water is at the quarter level, the red LED will be on. Orange and red LEDs will be on at half of water level.
When the water level reaches ¾ of the tank, three LEDs will light up which are red, orange and yellow. All LEDs will light up when the level of the water in the tank is full. Since the buzzer has been removed, there will be no sound at full tank.
19
Figure 8: The Modified Circuit Diagram
The table below summarized the condition of water level and LED(s) indication.
Table 3: Water Level Indication
WATER LEVEL LED(s) ON
Empty tank -
¼ tank red
½ tank Red, yellow
¾ tank Red, yellow, orange
Full tank Red, yellow, orange, green
20
Figures 9, 10, 11, 12 and 13 show the actual result with LED(s) indicator.
Figure 10: Water Level Circuit When Tank Is ¼ Figure 9: Water Level Circuit When Tank Is Empty
21
Figure 11: Water Level Circuit When Tank Is Half
Figure 12: Water Level Circuit When Tank Is 3/4
22
Figure 13: Water Level Circuit When Tank Is Full
23 4.1.2. X-CTU
Before the water level circuit can be connected to ZigBee, ZigBee needs to be configured by using X-CTU by connecting ZigBee module with ZigBee regulator to the computer.
Figure 14: X-CTU Windows
Figure 15: ZigBee Module with ZigBee Regulator Connected To PC
24
Figure 16: X-CTU Window Detect ZigBee
Node discovery or detection is a critical step in setting up a ZigBee network. Since the coordinator is responsible for starting a network, it must perform a series of scans to discover the level of RF activity on different channels (energy scan), and to discover any nearby operating PANs (PAN scan).
When a coordinator starts up, it performs an energy scan on the 16 RF channels to detect energy levels on each channel. Channels with excessive detected energy levels are removed from its list of potential channels to start on.
Subsequently, the coordinator scans the remaining quiet channels for existing PANs by sending a broadcast, one-hop beacon request. Any nearby coordinators and routers will respond to the beacon request by sending a beacon frame that contains information about the PAN and the PAN ID back to the coordinator.
Once the coordinator has completed all the scans, it starts a PAN to allow other end devices to join. [7]
25
Figure 17: Node Discovery with One End Device Detected
Figure 18, 19, 20, 21 shows the corresponding xctu window when node discovery is detected with different level of water.
Figure 18: Node Discover When Tank Is Empty command
data
26
Figure 19: Node Discover When Tank Is ¼
Figure 20: Node Discover When Tank Is Half
27
Figure 21: Node Discover When Tank Is ¾
Figure 22: Node Discover When Tank Is Full
28
ZigBee are also tested to make sure that it can transmit and receive data correctly. By typing ‘transmitter testing’ at transmitter (blue font colour), the receiver receive data correctly (fed font colour)
Figure 23: Transmitter Transmit Data
Figure 24: Receiver Receive Data
29
Since the maximum input low voltage for ZigBee is 0.35*VCC and the minimum input high voltage is 0.7*VCC, we calculate for the VIL max and VIH min
and get
VIL max = 1.155 V VIH min = 2.310 V Where VCC= 3.3 V
Some measurement is done to get the output value from the LEDs. The output voltage of the LEDs is 1.7 V which means it still in the range of the input for ZigBee. Since it still in the input ZigBee’s range, the outputs from the LEDs are connected directly to the input pin ZigBee. The negative parts of the LEDs are connected to the input pins of the ZigBee as shown in the figures below.
Figure 25: Connection between Water Level Circuit with ZigBee Transmitter
30 4.2. Discussion
There are several reasons why ZigBee is chosen instead of other wireless standard. It has range between 10 to 100 meters which satisfies the requirement of this project which need the range about 100 meters. It also has low complexity which can make the work easier. It means that it has low device and application impact. The most important part is ZigBee has low power consumption compared to other wireless standard. The table below shows the comparison between the ZigBee and other wireless standard.
Table 4: Comparison between ZigBee and other Wireless Standard
Wireless Standard
ZigBee 802.11 (Wi-Fi) Bluetooth UWB (Ultra Wide Band) IEEE Standard 802.15.4 802.11 a/b/g 802.15.1 802.15.3 Data Rate 20, 40, and 250
Kbits/s
11 & 54 Mbits/sec
1 Mbits/s 100-500 Mbits/s
Range 10-100 meters 50-100 meters 10 meters <10 meters Networking
Topology
Ad-hoc, peer to peer, star, or mesh
Point to hub Ad-hoc, very small networks
Point to point
Operating Frequency
868 MHz (Europe) 900-928 MHz (NA), 2.4 GHz
(worldwide)
2.4 and 5 GHz 2.4 GHz 3.1-10.6 GHz
Complexity Low High High Medium
Power Consumption (Battery option and life)
Very low (low power is a design
goal)
High Medium Low
Security 128 AES plus application layer
security
64 and 128 bit encyption
Other Information
Devices can join an existing network in
under 30ms
Device connection requires 3-5
seconds
Device connection requires up to 10
seconds
Typical Applications
Industrial control and monitoring, sensor networks,
building automation, home
control and automation, toys,
games
Wireless LAN connectivity,
broadband Internet access
Wireless connectivity between devices
such as phones, PDA, laptops,
headsets
Streaming video, home entertainment
applications
31
As the digital signal transmitted, the signal is expected to remain strong even at huge distance. Since ZigBee module specify up to 120m in transmission range, the digital signal remains isolatable for at least 100m. Although data are able to be transmitted for a 100m distance, the sensitivity of receiver actually may change. As the distance between transmitter and sensor increase, the sensitivity of the receiver is decreased.
4.2.1. Problem Encountered
Since X-CTU is software for ZigBee, it is hard to understand the transmission data. Since the data received is in hexadecimal, it is quite difficult to translate in order to make it easy for everyone to understand the data sent. So in order to display the data well, another software might need to be used so that the data can be read or understand by readers easily.
32 CHAPTER 5
CONCLUSION AND RECOMMENDATIONS
5.1. Conclusion
In conclusion to this project, the system is about data transmission from water level circuit through wireless so that it can be monitored at computer. The data is taken from water level sensor as input to the transmitter. Transmitter will transmit the data to receiver. Receiver receives the data and display data.
5.2. Recommendations
Although ZigBee has many advantages, it is still a new technology and has not been fully developed. A great amount of time was spent reading the materials and trying to understand the theory and applications.
Hence, there were some delays in completing the project.
Since the data displayed from X-CTU is in hexadecimal, it is recommended to try using Visual Basic to get better result displayed.
33
REFERENCES
[1] Theodore S. Rappaport, Wireless Communications – Principles and Practice, 2nd Ed. United States of America: Prentice Hall, 2002]
[2] http://users.tkk.fi/virranko/sensor_networks/vikstrom2.pdf [3] http://www.stg.com/wireless/FAQ_WiHART.html
[4] http://en.wikipedia.org/wiki/IEEE_802.15.4-2006 [5] http://www.electronic-circuits-
diagrams.com/alarmsimages/alarmsckt6.shtml
[6] http://www.ecelab.com/circuit-water-level-sensor.htm
[7] http://sst.unisim.edu.sg:8080/dspace/bitstream/123456789/104/1/08_
Poh_Chee_Cheong.pdf
[8] http://ieeexplore.ieee.org/stamp/stamp.jsp?tp=&arnumber=5066 800&isnumber=5066711
[9] http://ieeexplore.ieee.org/stamp/stamp.jsp?tp=&arnumber=5066 622&isnumber=5066609
[10] http://ieeexplore.ieee.org/stamp/stamp.jsp?tp=&arnumber=4964 92&isnum ber=10699
[11] http://ssdl.stanford.edu/ssdl/images/stories/AA236/0708A/Lab/Rov er/Parts/xb eeproproductmanual.pdf
[12] http://www.digi.com/technology/rf-articles/wireless-zigbee.jsp
34
APPENDICES
35
APPENDIX A
IEEE 802.15 TG4 FEATURES
Data rates of 250 kbps, 40 kbps, and 20 kbps.
Two addressing modes; 16-bit short and 64-bit IEEE addressing.
Support for critical latency devices, such as joysticks.
CSMA-CA channel access.
Automatic network establishment by the coordinator.
Fully handshaked protocol for transfer reliability.
Power management to ensure low power consumption.
16 channels in the 2.4GHz ISM band, 10 channels in the 915MHz I and one channel in the 868MHz band.
36
APPENDIX B ZigBee's Pin Assignment