Human Settlements Development Grant HSDG Integrated City Development Grant ICDG Integrated Development Plan IDP IDZ Industrial Development Zone. MSDF Metropolitan Spatial Development Framework MTREF Medium Term Revenue and Expenditure Framework NDPG Neighborhood Development Partnership Grant PDAs Previously deprived areas. PRASA Passenger Rail Authority of the Republic of South Africa PTIG Public Transport Infrastructure Grant RSDF Regional Spatial Development Framework SDBIP Services Delivery Budget Implementation Plan SDF Spatial Development Framework.
INTRODUCTION
STRATEGIC REVIEW OF THE BUILT ENVIRONMENT .......... Error! Bookmark not
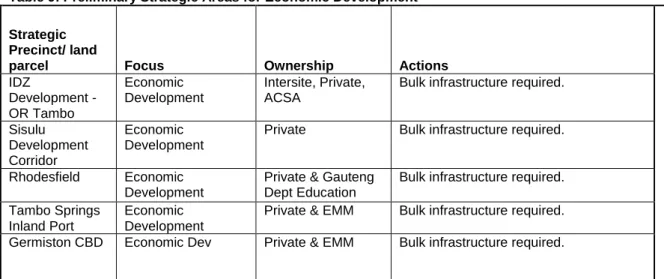
Trends and Demand for Economic Infrastructure
The Strategic Roadmap was used as a basis for the drafting of the RSDF Region A as well as the Aerotropolis Planning and Land Use Guidelines (PLUG). The OR Tambo Industrial Development Zone (NOS) is one of the most effective tools to promote industrial development. To date, the Gauteng IDZ is working on the development of the Jewelery Manufacturing Zone (JMP) as Phase One of the IDZ located at the OR Tambo International Airport.
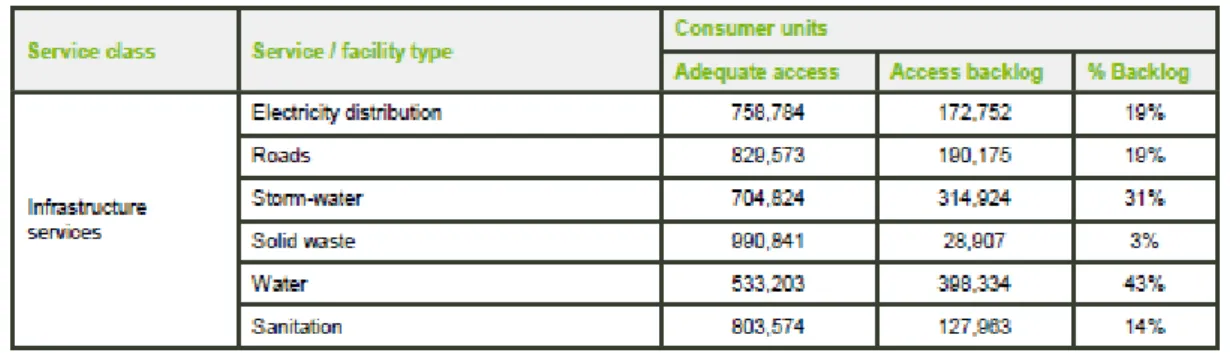
Trends and Demand for Basic Infrastructure
All of the above should be modeled in the master plan of the Water and Sanitation Department. Overall, about 6% of the portfolio is in poor or very bad condition – figures vary by sector from 3% to 14%, with operational buildings in the worst condition. K86 to connect Daveyton to OR Tambo International Airport and unlock the development potential of the area north of the N12.
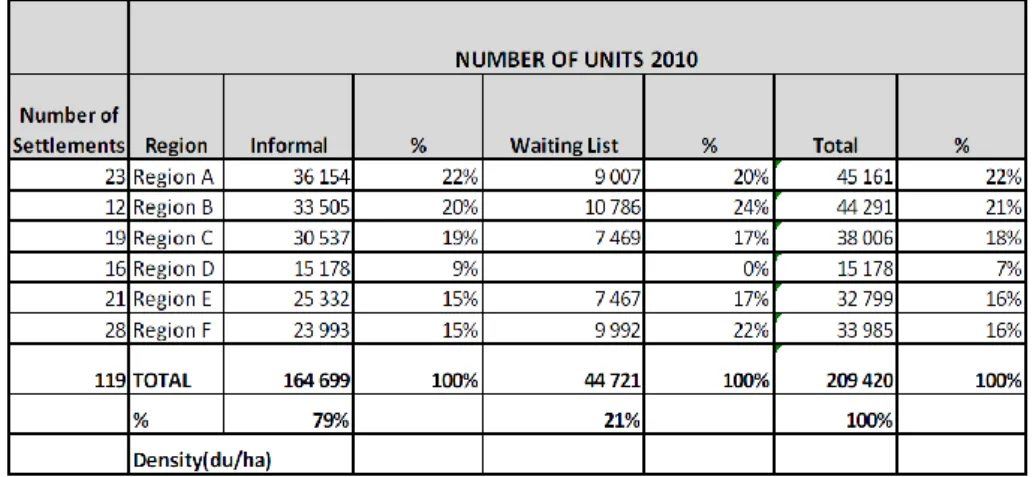
Trends and Demand for Residential Infrastructure
The upgrading or construction of the above-mentioned Class 1 and Class 2 roads are important mobility routes. The development planned by the EMM will have to be in line with the development of the above authorities. Social Housing: The City operates a social housing program through the Ekurhuleni Development Company (EDC), a municipally owned social housing institution responsible for implementing the program.
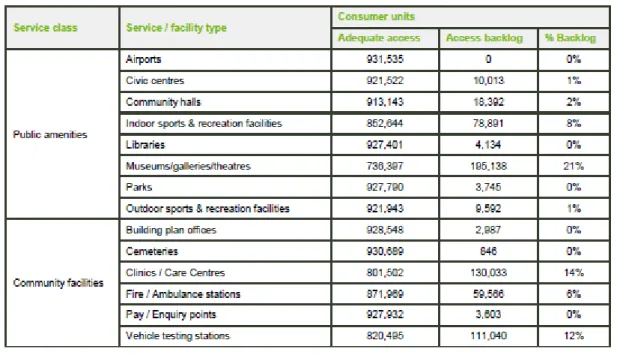
Trends and Demand for Community and Social Infrastructure
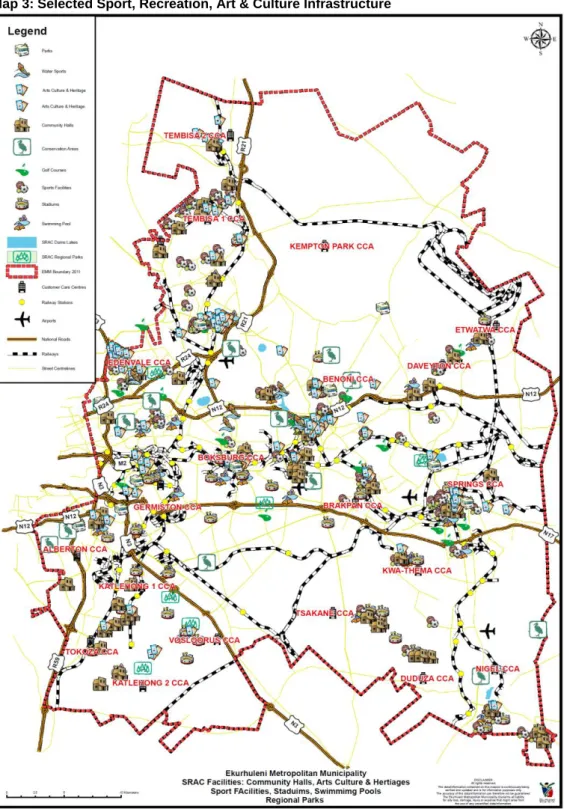
Map 2 is included in response to a comment from the National Settlement Department, indicating the location of existing and proposed social infrastructure at 'primary and secondary levels'. 7Source: ADDRESS BY THE EXECUTIVE MAYOR OF THE CITY OF EKURHULENI, CLR MONDLI GUNGUBELE, ON THE STATE OF THE CITY, GIVEN AT THE MEETINGS OF THE CITY OF GERMISTON, 19 MARCH 2013. In response to a comment from the National Department of Human Settlements, Map 3 is included to indicate the location of the existing and proposed sports, recreational, artistic and cultural infrastructures at 'primary and secondary level'.
Trends and Demand for Transportation
Heavy industrial development should be encouraged in the region to revitalize the economic development of the area. It should be emphasized that the development of the filling should not be done to the detriment of the environment. The priority of these projects was based on the development objectives of the Department of Human Settlements Ekurhuleni.
Implementation of the corridor in the CIF is indicated according to the IRPTN phases as described by the Ekurhuleni Public Transport Department. Where possible, these projects should be linked to the implementation of the IRPTN and the priority income generating areas. Where possible, the prioritization of the poverty eradication areas must be linked to the implementation of the IRPTN.
For additional information on the demarcation of the Aerotropolis core, see the Aerotropolis Space Planning and Use Guidelines. Tembisa has been identified as an urban cluster in terms of the urban network strategy. Ekurhuleni is in the process of specifically costing the MSDF proposals, particularly in relation to the capital investment framework.
EMM's revised Growth and Development Strategy (25 year horizon) – the level of services to be delivered to be reviewed;.
Trends and Demand for Sustainable Development
Impact of Sector Trends and Demands on Spatial Form
STRATEGIES AND PROGRAMMES ............................ Error! Bookmark not defined
The Spatial Development Strategy of the Municipality
This is the north-western region and it includes the area which was part of the Khayalami Metro. This is the central eastern region, mainly between the N17 and N12 in the north, east of the Benoni CBD. The strategy will be to consolidate the area as part of the development in the economic centre.
The Wadeville and Alrode industrial estates remain the backbone of the region's economy and should be sustainable. The different function of Tembisa in terms of the 'central place' model, compared to other PDAs, should be noted. It also forms part of the Tembisa – OR Tambo International Airport component of the Ekurhuleni North-South Corridor.
This includes the area northeast of OR Tambo International Airport up to and including the Mayfield area north of Daveyton. In terms of the CIF, the identified expansion areas have been considered in relation to the Aerotropolis core, housing projects and the proposed IRPTN routes. IRPTN Corridor: The IRPTN road phase to be developed should receive more funding during each CIF phase.
The prioritization of IRPTN stations therefore follows the deployment time frame proposed for IRPTN main routes.
Identification of Urban Network, Integration Zones and Hubs
Tembisa's current role in the provincial context is to serve as a transit area for people who have often migrated from other parts of the country to seek employment opportunities in Gauteng. Tambo International Airport is used by most of the world's leading airlines and serves most of the African continent, an Aerotropolis concept run by EMM. A third of the accommodation in the city can be considered rental accommodation, located in the courtyards of typical RDP type properties for people on low incomes.
The town offers very little in terms of employment opportunities and many of the residents work in the industrial areas located within the Aerotropolis Core or use the public transport system to travel to employment opportunities in other areas of Gauteng. The Tembisa urban network plan consists of the Economic Core Triangle which includes the Aerotropolis Core (O.R. Tambo International Airport, the CBD of Kempton Park, the strategic suburb of Bonaero Park as well as other industrial areas such as Spartan and Jetpark). The Ehlanzeni or Leralla Node as it is formally called is one of the emerging corridor nodes that will benefit from the Urban Network Plan which integrates road and rail corridor infrastructure.
Other sources of funding and partnerships may be made with PRASA's property development subsidiary Intersite in relation to the creation of secondary hubs in and around railway stations. The upgrade of K60 which runs through Tembisa from east to west would provide an ideal catalyst for development within the area. The main catalytic project for the Tembisa node is the Aerotropolis Project which would see the intensification of the aircraft industry as well as the logistics industry in and around the O.R.
The scheme has already undergone public participation phase and the projected implementation of the scheme will be during the first half of 2015.
OUTCOMES AND OUTPUTS
Anticipated Outcomes and Outputs of Municipal Investment in the Built
INSTITUTIONAL AND FINANCIAL ARRANGEMENTS ........... Error! Bookmark not
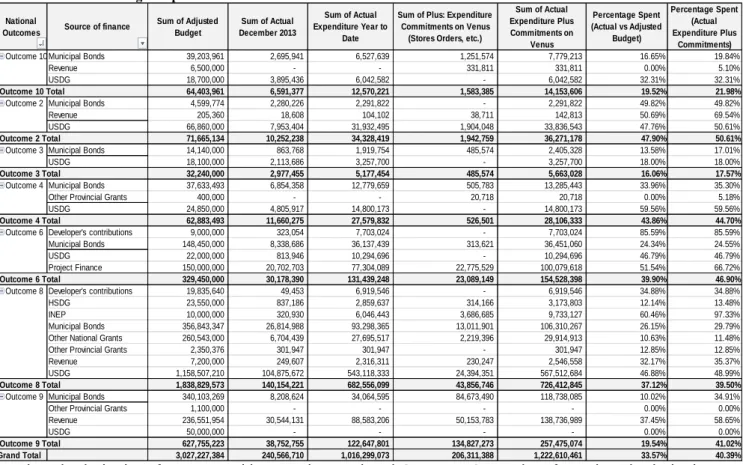
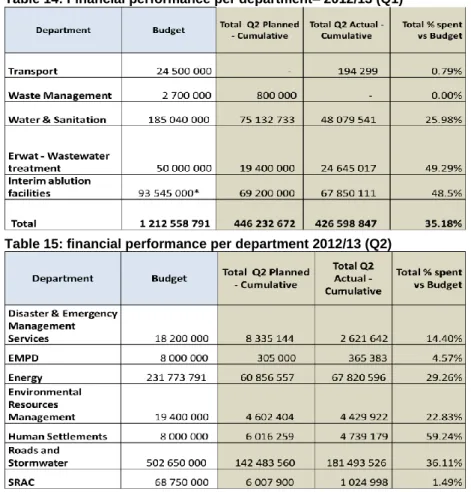
A summary of financial allocations in the MTREF to support spatial
The Metro is now busy drawing up a long-term funding strategy to ensure that the balance between internal and external funding is optimal, while also aiming to increase the capital budget to ensure both stimulation of the local economy as well as eradication of backlogs and such. create sustainable human settlements. In long-term financial planning, cost increases are thus one of the many uncertain factors that necessitate the use of assumptions. The increased asset value resulting from the depreciation of the GRAP 17 assets will be phased in for rate setting purposes and more cash will be generated in a progressive manner over the coming years.
As a result of lower than budgeted collection levels, the balance of the cash is being absorbed by the increased contribution to bad debt provisions, but with more conservative bad debt provision budgeting coupled with more aggressive collection activities, this will not be the case in the future. The current debt book must be repaid from this cash in terms of the repayment terms and the balance is then available for use. Continued Use of Debt Financing for Capital Infrastructure: The current long-term debt of the EMM is well within industry norms, in fact it is much lower than its peers.
The funds received from the sale of the rights to collect the outstanding accounts receivable book must be placed in the general reserve as the first contribution to the reserve account. Priority areas include the rodent strategy, alternative chemical toilets – the cost-effectiveness of chemical toilets to be reviewed (a possible alternative could be the provision of flushing blocks), antiretroviral drugs and special events linked to economic development. The maps show that the majority of the USDG funded projects are located in the formally disadvantaged areas of the EMM as in the example of Kathorus (map 23), Clayville, Thembisa, Daveyton, Etwatwa and Kwatsaduza.
The concentration of the USDG capital projects within these formally underserved areas is indicative of initiatives to promote an increase in the level of and access to services and opportunities aimed at improving the urban form and benefiting the underprivileged.
Application of Grant Allocations, including
Existing tools such as the MSDF are often outdated by the time the document is approved and ready to be used by other departments. The pace of development trends is rapid and in order to adequately monitor these changes, a unique system must be developed in which these trends can be identified early enough to allow stringent mitigation measures to be taken. With the call from the national government to refrain from using consultants for work that can be done in-house, manipulative data must be available.
Most of the data required by these indicators are either not available in the required format or no specific data measurement boundaries have yet been established, as is the case with all data related to integration areas. Other difficulties include the interweaving of public and private financial data held by financial institutions as well as data related to the investments of public entities within certain projects located in the Metro. Capacity and data capture systems within multiple departments is another key issue that needs to be addressed.
Much of the Metros data can be stored in this particular database and extracted in the required format as needed. To proceed to phases after phase 1), no material irregularities in financial management or supply chain management in spatial transformation projects in integration zones reported by the AG (Y/N). B2.2 Percentage change over decade of the share of household income spent on transport costs for urban passengers.
B2.9 Percentage change in total kilometers of dedicated walkways and cycle paths in relation to.