PORT LOmS HARBOUR AND ITS ECONOMIC LINKAGES TO THE MAURlTIAN ECONOMY
A dissertation presented to:
The Graduate School of Business
University ofNatal
Inpartial fulfillment of the
Requirements for the degree of
MASTER OF BUSINESS ADMINISTRATION UNIVERSITY OF NATAL
by
ZAHEER MOHAMUDBUCUS
17thApril 2002
Acknowledgements
I would like tothankProfessor Trevor Jones who was my supervisor and mentor during the C01.ll'se ofthisstudy. I also want to thank Mr Lam LoongInfrom the Ma1.ll'itius Ports Authority for his time and effort and also for directing me towards the proper S01.ll'ces of information. All the persons who I interviewedandcontacted individually to gatherdata, I am also grateful to them.
A specialthanksgoestomy parents andallmy friends who helped me in one way or the other in completingthisdissertation.
Chapter I
1.0 Introduction 1
Chapter 11
2.0 Development ofPort Louis Harbour 6
2.1 The set up ofthe different terminals 6
2.2 The New Container Terminal 8
2.3 The other Terminals 10
ChapterUl
3.0 Port traffic performance at Port Louis 12
3.1 Total cargo handled at Port Louis 12
3.2 Types of cargo handled at Port Louis 14
3.2.1 Bulk Cargo 14
3.2.2 Unitized and break bulk cargo 15
3.2.3 Bagged cargo 16
3.2.4 Fish cargo 16
3.2.5 Roll-on / Roll-off and other cargo 16
3.2.6 Container cargo 16
3.3 Imports and exports at Port Louis 19
3.3.1 Imports at Port Louis 20
3.3.2 Exports at Port Louis... 23
3.4 The container traffic... 25
3.5 The vessel traffic... 28
Chapter IV
4.0 The port's activities... 32
4.1 Directly port related activities... 33
4.1.1 Mauritius Ports Authority... 35
4.1.2 The Clearing and Forwarding Industry 37
4.1.3 State Trading Corporation 39
4,1.4 The Bunkering Industry , 42
4.1.5 The Ships Agencies .- 45
4.1.6 The Cargo Handling Corporation Limited 49
4.1.7 Ship repair yards 52
4.1.8 The container freight station 54
4.1.9 Other port related activities. ... ... ... ... 54 4.2 Anoverview ofthe directly port related industries 55
4.3 Indirectly port related economic activities 58
Chapter V
5.0 The effects ofa changing port traffic base on local economy 61
5.1 The problem statement 61
5.2 Research objectives 61
5.3 The methodology used 62
5.4 Impact of changes in container traffic 64
5.5 Impact of changes in transshipment traffic 69
Chapter VI
6.0 Conclusion... 76
7.0 List of Tables 79
8.0 List ofFigures 80
9.0 ListofPersons contacted in this study 81
10.0 Bibliography 82
Chapter I
1.0 Introduction
Situated half-way between Africa and India, at about 1000km from the Eastern coast of Madagascar, lies the Republic of Mauritius, a 1865 square km island of volcanic origin.
The island is graced by some 330km of sandy beaches and protected by one of the longest uninterrupted coral barriers of the world.
With a population of 1,2 million inhabitants, Mauritius has known a sustained growth during the last decade. Since 1979, the country has successfully entered into a phase of major industrial development, putting it at the level ofnewly industrialized countries. The government is committed to a free economy and has created the necessary environment conducive to the growth of the national economy without hindering social justice. The country has embarked on a multi-fold strategy based on the diversification of its production, value added exports, on the improvement of productivity and the protection of the environment.
Being politically stable, the country has achieved social harmony with an almost full level of employment. Itbenefited from an educated workforce which can adapt easily to new production systems. The partnerships between the public and the private sectors, coupled with a package of incentives, have created an environment leading to sustainable development. (MPA,Port Louis equipped to meet challenges of new millennium, 1998)
Port Louis is the capital and only harbour of the island. It is located on the northwest coast of the island, covering an area of 45 square km and is protected by a chain of mountains.Itstands out as the central point of the administrative and economic affairs of the country. Port Louis Harbour is strategically situated in the centre ofthe Indian Ocean, on the shipping routes linking the African, Asian and Australian continents. The Port is of vital importance to the national economy with close to 95% of imports and exports transiting through it and is willing to position itself as the hub of the Indian Ocean between Europe, Africa and Asia.
The infrastructure and port servIces are continuously being improved to meet the challenges of an expanding economy. Striving to make Port Louis even more efficient and competitive, the Mauritius Ports Authority has invested heavily in training programs aimed at all levels of employees from the manual worker to top management. All port stakeholders work closely to pool together their resources and thus create the necessary impetus and synergy to convert Port Louis into a transshipment hub.
This synergy will enable the optimal use of a multi-skilled and flexible workforce and lead to enhanced productivity and longer working hours. This new port dynamism is backed by a modem telecommunications network, a diversified range ofsupport services and an emerging freeport. This technological evolution will benefit directly the port users such as the shipping lines, their agents, the freight forwarders, the ship chandlers, the fuel suppliers and other providers of ancillary services to vessels.
Traffic in the port is fast growing. The Ports Authority has invested heavily to upgrade and provide new infrastructure to meet growing demand needs. Traffic growth exceeding 10% per annum is expected during the forthcoming years (port News, Dec 2000).
The purpose of this study is to do an exercise on the level of economic activity which is generated by the major players of the port ancillary industries. This study will analyse the impact of port activity at two levels. The fIrst level will examine total employment and revenue generated by all major directly related-port economic actors in 2000. The second will be more specmc and will look at the spending patterns generated by two hypothetical port callers: a container vessel working 300 TEUs at a single call in the port; and a transshipment vessel working 100 TEUs ata single call in the port.
Chapter I of this paper will look at the history ofPort Louis, how Port Louis became the harbour of Mauritius, how it has developed itself, what are the facilities that it offers to the port community and finally what are the future plans for the port?Itwill describe the setting up of the Mauritius Port Authority(MPA), its functions and its future role for the country.
Chapter IT will look at the different port terminals which exist at the port. Each one of them will be elaborated but more emphasis will be laid on the New Container Terminal, Terminal ill. The latter is expected to revolutionise the port activities and change the picture ofPort Louis in the eyes of other countries. The other terminals will be presented together with the category of products which they handled.
Chapter ID will look at the traffic performance at the port over the last years. The different types of cargoes which are handled at the port are enumerated. The change in the volume of cargo will be presented and the volume of imports and exports will be shown. Different types of cargo. which constitute the major components of imports and exports, will be displayed. Thereafter the container traffic will be presented together with its growth over the years. Vessel traffic will also be shown.
Chapter IV will address the fIrst major area of analysis of the study. It will attempt to quantify the influence of the activities of the port on the local mauritian economy for the year 2000. It will present all the directly port-related activities while splitting them into the vessel-related activities and cargo-related activities. Then a thorough analysis ofeach port player will be elaborated together with their level of interest with the port activities.
Their number of employment will be displayed and their accompanied wage bill. This will thus show the number of people who obtained employment through the port existence and their subsequent injection in the local economy.
Chapter V will address the second major area of analysis of the study. It will be more specifIc as it will look at the level of economic activity generated by a containerized vessel working 300 TEUs in the port. The problem statement, research objectives, and methodology used for this section will be presented. The different port players which will be affected by the call of a container vessel will be stated. Then the expenditure/cost/revenue accruing to each one ofthese port players will be calculated and
tabulated. The result will show the injection to the local economy by the working of a 300 TEUs containerized vessel at the port. A similar exercise will be simulated for a hypothetical container vessel handling only transshipment cargo.
Chapter VI will be the conclusion of the dissertation. The results of the findings will be presented and its usefulness to the port authorities will be mentioned. The areas for further research will be stated. The list of tables and figures and bibliography will be followed.
There was not much past literature which could be consulted for this study. This is because no similar studies were done previously in Mauritius. The closest study was one done by Teeloku L in 1984, in his paper entitled "The repercussions of port development on our national economy". This paper was concerned with the decrease in turnaround time, decrease in port detention surcharges, and other decrease in vessels dues when more investment is done in the port. A broad conceptual framework to assess the impact ofport activities on their local host economies has, however, been presented by Morison &
Jensen in their work on the port of Brisbane, and by Jones in his work on the port of Durban. The approach adopted in this paper follows that developed by Jones in his 1997 study entitled "The port of Durban and the Durban Metropolitan Economy". Other limitations faced in this study were the unwillingness ofthe private companies to release data. The smaller companies argue that the market they face is very limited and they were very reticent to give out private information.
Chapter 11
2.0 Development of Port Louis Harbour.
This chapter will look at the developments which took place at Port Louis harbour over the years. The different stages in which the different terminals were set up will be explained. Particular emphasis will be laid on the New Container Terminal or Terminal 3.
The latter is expected to give a new shape to the Port Louis harbour and to make it equal to other modem ports of the region. The other terminals will also be looked into.
2.1 The set up of the different terminals
Port Louis was selected for the development of the only port of the island because of its sheltered area. The port was a lighterage port without any deep-water berths. The first deepwater quay (Quay D) was constructed in 1929 and was capable of accommodating ships of up to 9m draught. A second deep-water quay (Quay 1) was set up to handle mainly fertilizerwasconstructed in 1971. The port was characterized by labour-intensive cargo operations particularly on sugar, which was the main export of Mauritius. This situation was causing difficulties to administer mainly due to labour disputes. The operation was very slow and ships at times had to wait up to three months in the port before being serviced. (Gobhurdhun S, 1996,8)
Modem port facilities were clearly needed by the mid-1970s and the World Bank came forward to finance the construction of three quays with necessary back-up space. The facilities comprised three alongside berths with water depth of 10. Srn, capable of accommodating 15,000 DWT vessels, and an open storage area/container park. The
projectwascompleted in 1979/80. During the same period a completely separate marine facility for the loading of sugarwasconceived and completed in 1981. The facility has a loading capacity of 1400 tons per hour and a storage capacity of 350,000 tons of sugar.
These facilities put an end to the conventional system of loading sugar employing labour and lighters and projected a new image of the Port Louis Harbour among shipping lines.
Port detention charges, demurrage charges, undue waiting time for berths, which were the stigma attached to Port Louis Harbour of 1970, became a thing of the past. The Bulk Sugar Terminal was set up. (MPA,Port Handbook, 2000)
The Mauritius Marine Authority (MMA) also acquired a fleet of cargo-handling equipment, such as forklifts, tractor, trailers, yard gantry cranes, prime movers, mobile cranes and marine crafts such as tugs, pilot launch and so on. In 1985, the existing container park was expanded to about 7.0 hectares in order to cater for up to 100,000 TEUs. In 1983 the Authority awarded the contract for the reconstruction of QuayA,D andE.
The MMA also invested in dredging and reclamation projects whereby about 125 hectares of land were reclaimed in the port area; Mer Rouge and Les Salines. A new access channelwascreated at Mer Rouge. The main access channel was dredged in 1971 to 12.2 metres and its turning basin was enlarged in 1991 to 350 metres in diameter at a cost ofMR 90 million.In 1990 a second access channel has been dredged at the English Channel having a published depth of 12.5 metres. (MPA,Port Handbook, 2000)
2.2 The New Container Terminal.
The main objective ofthe New Container Terminal project at Mer Rouge is to support the Government's policy for sustainable long-term growth through improvements in the efficiency and competitiveness of port services, in an environmentally sound manner. To this end, implementation of this project would increase port productivity, efficiency and capacity to meet the ever-increasing demand for port users at competitive rates through extension of facilities and mechanization of cargo handling activities.
Following analysis of the various development options ofa dedicated container terminal, itwas decided that the construction of a New Container Terminal at Mer Rouge would definitely meet the objectives ofthe Authority and would likely be the most cost effective alternative. The viability of this proposal has been confirmed on the basis of a wave- analysis study of the English Channel using all available weather data for the area.
Furthermore, it should be noted that the Mer Rouge site, which was reclaimed in 1990 under a dredging and reclamation contract, allowed for construction works to proceed without causing any disruption whatsoever to port operations and leave the civil works contractor a clear site to complete the work in the minimum time possible.
In addition, availability of adequate space allows for extensions to meet any future requirements in terms of berthing space and/or storage areas. With the transfer of container operations to Mer Rouge, the existing deep-water berths and associated storage
facilities will be available immediately for other purposes as a result of reduction in berth occupancy.
The project is estimated to cost about MR 1.2 billion and external sources would be needed for financing. With the above project, the handling rate of container will increase significantly. Itis expected that container cranes may reach up to 30 container lifts per hour. The average will be 25 container lifts per hour compared to 15 before the introduction of the NCT.Itis anticipated that the service time ofa vessel will be reduced by 50 per centiftwo quay cranes are used to service a ship. The vessel turnaround time will be quicker and efficiency will be higher.
The New Container Terminal consists of a 560 metre quay with three post-panamax rail mounted quay cranes. There will be three berths: two berths are to be used to accommodate container vessels and one berth will handle petroleum tankers. All the berths will be equipped with bunker lines, water and telephone facilities. There will be a container park of 13 hectares which can handle a container traffic of 300 000 TEUs.
Modem fire fighting equipment has also been installed.
Over the years the Mauritius Port Authority has thus set up various terminals. These have been erected as the level of economic activity increases and as additional facilities were felt to be required in the port area. The latest ofthe port's terminal is The New Container Terminal which is situated at Terminal ill A detailed breakdown of the different terminals that are in operation are listed in the following table.
2.3 The Other Terminals
TERMINAL I Dredged
Quay Length (m) Depth(m) Type of cargo
Passenger, General Cargo,
A 210 12.2 rice, etc
Black oil, wheat, molasses, edible oil, general cargo, Passengers and inter
D 170 12.2
island trade
E 135 9 Passenger, Inter island
Troll Fanfaron No. 1 150 5.5 Fish
Troll Fanfaron No. 2 165 7 Fish
TERMINAL 11
Bulk, Fertilizer, Coal, White oil, Liquid Ammonia, Tallow& General
No. 1 123 12.2
cargo
No. 2 180 12.2 General cargo Containers
No. 3 185 12.2 General Cargo Containers
No. 4 185 12.2 Containers, LPG& Bitumen
TERMINAL III
Quay Length (m) Dredged depth m Type of cargo
NCT 560 13.1 Containers and petroleum Products
(Source:MPA, Port Handbook, 2000)
The available covered storage facilities are at the disposal of industries which want to hire them. Some are privately owned and the Mauritius Port Authority owns some.
Covered Storage/Building facilities
Leased to les Moulin de la Concorde for Queens Warehouse
storage ofFlour.
Shed A To be used for the transit storage of rice ShedE Storage ofInter Island Cargo Traffic
Shed 2& 3 Storage of General Cargo
Shed 1 Shelter for Equipment and general cargo
Stores buildings Used as Stores forMPA
Workshop Building Use as Workshop and Fire Station (Source:Gobhurdhun S,1996, 20)
The above chapter has looked at the different terminals which exist at Port Louis harbour.
Particular emphasis was put on the NCT. The latter is expected to bring in positive returns to investment in the very near future. The other terminals which are in place at Port Louis have also been looked into. The next chapter will look at the overall traffic performance which takes place in Port Louis. The volume of cargo handled will be considered in terms of total harbour tonnage. The number of containers as well as the number of vessels calling at Port Louis will also be looked into.
Chapter III
3.0 Port traffic performance at Port Louis
The previous chapterhas looked at the different terminals which exist at Port Louis.Itcan be seen that there have been massive improvements to and investment in the port's equipment, so that nowadays even large Panarnax vessels can berth at Port Louis. The following chapter will look at port traffic performance in terms of the volume of cargo handled at the port. Total harbour traffic will be examined and broken down into imports and exports. The number of containers as well as the number of vessels calling at Port Louis will also be looked into.
3.1 Total cargo handled at Port Louis
The traffic base at Port Louis has increased steadily over the years. Port Louis being the only harbour in Mauritius implies that all goods, irrespective of type, transited through the port. Data for period prior to 1987 were not available and whatever data which could be found prior to 1987, did not reflect a true and realistic picture of the port traffic.
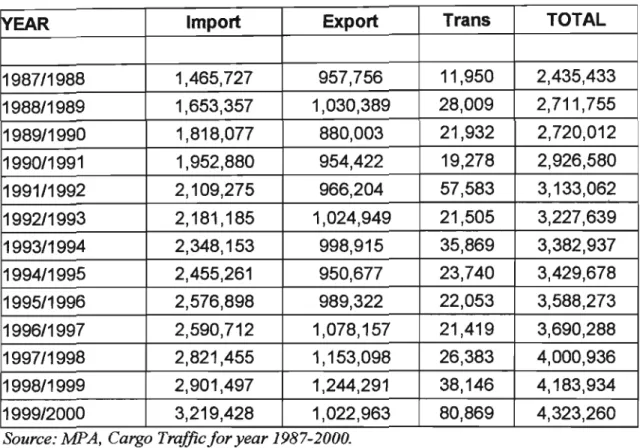
Therefore in this study the figures prior to 1987 were not analysed. Nevertheless the relevant figures for the financial years 1987 to 2000, shows that over the thirteen-year period, the volume of cargo handled at the port has almost doubled. In 1987 there were almost 2.5 million harbour tons of goods handled and in year 2000 the figure has gone up to almost 4.5 million harbour tons. This represents an increase of 2 million harbour tons of cargo over 13 years. The figures for the volume of cargo handled at Port Louis are shown in the Table 3.1 below. The data has been obtained from the courtesy of the Mauritius Ports Authority, in particular, Mr Philipe Lam LoongIn(Traffic Manager)
Table 3.1 Volume of cargo handled
rtEAR Import Export Trans TOTAL
1987/1988 1,465,727 957,756 11,950 2,435,433
1988/1989 1,653,357 1,030,389 28,009 2,711,755
1989/1990 1,818,077 880,003 21,932 2,720,012
1990/1991 1,952,880 954,422 19,278 2,926,580
1991/1992 2,109,275 966,204 57,583 3,133,062
1992/1993 2,181,185 1,024,949 21,505 3,227,639
1993/1994 2,348,153 998,915 35,869 3,382,937
1994/1995 2,455,261 950,677 23,740 3,429,678
1995/1996 2,576,898 989,322 22,053 3,588,273
1996/1997 2,590,712 1,078,157 21,419 3,690,288
1997/1998 2,821,455 1,153,098 26,383 4,000,936
1998/1999 2,901,497 1,244,291 38,146 4,183,934
1999/2000 3,219,428 1,022,963 80,869 4,323,260
Source: MPA, Cargo Traffic for year 1987-2000.
The figures in the above table represent the total volume of all cargo (import, export and transshipment) handled at the port. These include bagged cargo, bulk cargo, general cargo containerized cargo, inter-island cargo and fish. Itmust again be recalled that Port Louis is the only harbour in Mauritius and 98 to 99 percent of national imports and exports are done through the port. Port Louis is not like the other ports of the world where it can specialise itself in a certain category of commodities and not handle other goods at all.
Port Louis could thus be regarded as a 'combi-port' as it deals in all type of cargo. The different types of cargo which are handled at the port can be broken down into different categories.
3.2 Types of cargoes handled at Port Louis
• The Bulk Cargo
• Unitized and Break Bulk Cargo
• Bagged Cargo
• Fish
• Roll-on, Roll-off and other cargo
• Containers.
(Goburdhun S, 1996,22) 3.2.1 Bulk Cargo
Bulk products mainly consist of the following commodities.
Import Export
Bitumen Fertilizer
Soya Bean Meal Sugar
Wheat Molasses
Maize Ships' Bunkers bypipeline
Fertilizer Ships' Bunkers by barge
Coal Wheat
Liquid Ammonia Acid oil and Black Oil
Edible Oil Tallow Caustic soda
Cement
Petroleum White Oil Black Oil
Products Liquid Petroleum Gas
Sugar is loaded on ships by a mechanical shiploader which is connected to the storage shed by a conveyor belt. Cement is pumped by on board pumps to the cement silos. Wheat is discharged by a mechanical unloader and transported to wheat silos by conveyors.
Petroleum is landed using pipelines to storage tanks. Some of these imports are later exported as ships' bunkers via barge and pipeline. The respective importing or exporting companies undertake these operations. However fertilizer, maize and coal are unloaded by ships' grabs and nets, using the stevedoring labour of the Cargo Handling Corporation.
Therefore the loading and offioading of dry bulk cargoes are not completely mechanized andinfact is the area where most labour is employed.
3.2.2 Unitized and break bulk cargo.
The cargomix is predominantly pallets, bags, bales, timber, steel products and paper. The vessels are usually berth at Quays 2 and 3; ships' gear is used for the loading and discharge operation. Forklifts move the cargo to and from open storage area. At the open storage area, forklift or mobile cranes are used to lift the cargo form the trailer and for receiving and delivery of cargo to/from trucks.
3.2.3 BaggedCargO
At present only rice is imported in bags in large consignments. The rice handling is still an antiquated manual system. The ships are handled at midstream so the barges are towed to the granary where the port labour unloads the bags on elevators which transport the bags to the third floor of the granary. From there, it is distributed to other floors. This system is very costly as is so labour intensive, taking about 18·20 days to unload a shipload of 12,000 tons.
3.2.4 Fish Cargo
Fish is handled at the fishing port. Fish for the local market is discharged into trucks by ship gear or mobile cranes and fish for transshipment is unloaded into the Froid des Mascareignes cold storage.
3.2.5 Roll-on / Roll-off and other cargo.
Only cars and other vehicles are unloaded from car carriers by the Roll-onIRoll-off system and the vehicles are driven to import holding areas.
3.2.6 Container cargo.
Previously all container vessels were mainly berthed at Quays 3 and 4. At times Quay 1 and 2 and Quay A were also used depending on the requirement and availability of quays.
The majority of the container vessels calling at Port Louis were equipped with their own ships' gear and they were used to handle the containers. However with the introduction of the New Container Terminal (NCT) and with all its modern equipment, ships which do not
have their own gears can also be accommodated. The few gearless vessels are currently handled by rubber-tyred mobile cranes, supplied by the agents of the shipping lines. The limited reach and height of the mobile cranes were previously ill-suited for this work.
Because of this problem, some ships occasionally had to be turned around to have access to all containers. Presently more than 96% of the containers transiting via Port Louis are handled at the NeT. The containers are unloaded on tractor-trailers which transport the containers to the container park where the unloading and stacking is carried out by heavy forklift. (port News, 2000)
Figure 3.1 shows the volume of cargo handled at Port Louis. The figures include the imports, exports and transshipment cargoes transiting through Port Louis. The composition of the different products which are included in each category has been explained above. Therefore this means that in the bulk cargo, petroleumisalso included.
A rough estimate of the breakdown shows that petroleum white oil and black oil makes up of almost one-third of the volume of the Bulk Cargo. With regards to the total volume of cargo for year 2000, out of the 4.5 million tons of cargo stated, therewastherefore almost one million tons of petroleum products handled.
It must also be noted that there has been a rather significant increase in the volume of transshipment cargo handled in the June financial year 1999/2000.Itis with no doubt that the contribution of the Freeport authorities as well as the promotion of Mauritius as a transshipment status has helped to reach that volume of cargo handled.
Figure 3.1
Volume of cargo handled at Port Louis, 2000, tons
5000000 4500000 4000000 3500000 3000000 fnC 2500000
...
0 2000000 1500000 1000000 500000 0Source: MPA, Cargo Traffic/or year 1987-2000
Figure 3.1 graphically represents the figures from Table 3.1. A deeper examination of the figures can be done inorder to find out which commodity represents the biggest share of cargo traded at Port Louis. The statistics from the Mauritius Port Authority are analyzed and displayedinFigure 3.2. It can thus be seen that Bulk Cargo makes up of more than 60 per cent of the cargo handled. This figure reflects the trendinthe past years as well.
Figure 3.2
Major components of Port Louis traffic, 2000 (°k total cargo:total traffic)
BULK CARGO 64%
Source: MPA, Cargo Traffic, 2000
BAGGED CARGO 1%
GENERAL CARGO 3%
CONTAINERIZED 30%
INTER ISLAND 0.3%
FISH 2%
The above graph clearly shows that bulk cargo and containerized cargo represents the major share of the traffic at the port. The inter-island trade represents the imports and exports which are done with mainly the islands of Rodrigues and Agalega. The major product categories are dried and saltedfISh, coconut and other seafoods. The total volume of inter-island trade is practically negligible.
3.3 Imports and exports at Port Louis.
The next part of the analysis would be to fmd out the trend in the volume of imports and exports at Port Louis. It would be interesting to find out over the years how the imports of cargo has dominated the exports of cargo. The data was obtained from the Mauritius Port Authority and represented in Figure 3.3. It can thus be see that Imports has always exceeded Exports over the last five years shown. In year 2000, the volume of imports was
more than 3 times the volume of exports. The reason behind this high volume of imports is that most of the basic raw materials which Mauritius uses, are imported. Petroleum and cement on their own represent close to 50% of imported tonnage, that is, close to 1.5 million tons of products. On the other hand 700,000 tons of cargo (containerised cargo and sugar) is equivalent to 70% of the exports of Mauritius. Hence it can be said the main share of exports of Mauritius are much smaller than the imports. The next section will analyse the composition of imported goods at Port Louis.
Figure3.3
Imports/Exports at Port Louis, 2000 (tons)
3500000 3000000 2500000 2000000 tons 1500000 1000000 500000
o
13exports liimports
1995 1996 1997 1998 1999 2000 year
Source: Cargo Traffic/or year 1995-2000 3.3.1 Imports at Port Louis.
Following the breakdown in the volume of imports and exports at Port Louis, this section will attempt to find out the commodities which make up the biggest share of imports. At flfst glance it can be said that bulk cargo represented the biggest share of cargo handled at the port. Thus it could as well be concluded that bulk cargo will also be the main
component of the imports at Port Louis. However deeper analysis needs to be done so as to find out the individual products. The data has been obtained from the courtesy of the Mauritius Port Authority and has been examined. The results of the analysis are displayed in Figure 3.4 below.
Figure3.4
Major components of Port Louis imports, 2000
(0/0
imports:total imports)BAGGED CARGO 2%
PETROLEUM 29%
CEMENT 20%
Source MPA, Cargo Traffic for year 1999-2000
BULK CARGO excl petrol and cement
19%
GENERAL CARGO 5%
CONTAINERIZED 25%
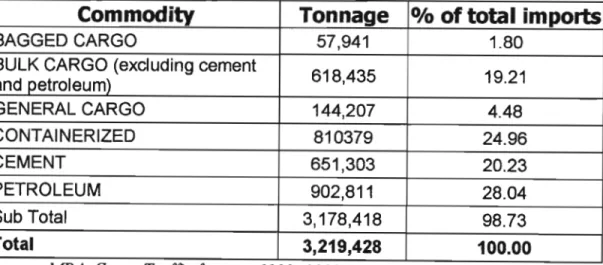
Figure 3.4 shows the major categories of imports which the port handled in the fInancial year 1999/2000. Petroleum, Cement and Containerized cargo makes up of almost 75% of the imports of Mauritius transiting via Port Louis. Petroleum imports are controlled by the State Trading Corporation, who buys them on account of all the oil companies in Mauritius. Some of these petroleum imports are subsequently exported in the form of bunkers supplied to vessels. The bunkering companies have to place their orders to STC who then makes the fuel available to them Bunker fuel is stored in the tanks of the bunker suppliers. For the fInancial year ending 2000 more than 902,000 tons of petroleum
products were imported at Port Louis. This represents more than 28% of cargo imports.
The other big category of imports is cement. In 2000, 651,303 tons of cement were imported at Port Louis representing 20% of imports. Cement is not produced in Mauritius hence the economy relies exclusively on imports. The need for a cement silo has lead the authorities to work on a project to create such a silo.
Containerized goods also represent also a major share in the total volume of cargo imported. For the financial year ended June 2000, 810,379 tons of containerized cargo was imported in Mauritius representing almost 25% of total cargo imports. The bulk of the containerized commodities are capital goods and equipment for the production of fmished goods in the textile factories or other industries. Foodstuffs are mostly imported in containerized form and also consists a major share of the total imports. The New Container Terminal has come to fill in the gap which was feh in the container industry.
Nowadays there is enough space to handle containers up to year 2020 where the figure for the number ofTEUs is expected to reach 300,000 mark.
Table 3.2 Total Imports handled at Port Louis (1999/2000).
Commodity Tonnage
0/0of total imports
BAGGED CARGO 57,941 1.80
BULK CARGO (exduding cement
618,435 19.21
~md petroleum)
GENERAL CARGO 144,207 4.48
CONTAINERIZED 810379 24.96
CEMENT 651,303 20.23
PETROLEUM 902,811 28.04
Sub Total 3,178,418 98.73
rrotal 3,219,428 100.00
Source: MPA, Cargo Trafficforyear 1999- 2000
3.3.2 Exports at Port Louis.
The same exercise as carried out above is repeated for exports transiting through Port Louis. Table 3.2 represents the main exports per product category handled at Port Louis for year ending June 2000. Containerized cargo consists mainly of the products from the Export Processing Zone. A discussion with the management of the textile industries revealed that about 90% of their products are exported in containers by ships to their countries of destination. The remaining 1
°
per cent of exports are done by airfreight but this is done only in times of urgent orders. Containerised cargo represents close to 38 per cent of exports equalling 380,000 tons.The other major export products intonnage terms which Mauritius deals in, is sugar. In the year ending June 2000 the total sugar volume was 313,200 tons. The authorities see this figure as a relatively low output. In fact in that particular year Mauritius faced a severe drought which is the reason for the low harvest and hence low exports of sugar.
The usual sugar tonnages export inprevious years amounts to over 500,000 tons yearly.
There has been steady increase in the volume of sugar exported in the past years. The reason given was the research undertakes by the Mauritius Sugar Industry Research Institute which has been undertaking experiments so that the sugar content in the cane can be increased. This resulted in less sugar cane planted but more raw sugar harvested.
However because of the droughtin the financial year 1999/2000 therehas been a drastic fall in the volume of sugar harvested. Nevertheless sugar still consisted of more that 30 per cent of the volume of cargo shipped. The estimates for the year 2000/2001 seem to be
very promising. Some sources are expecting to export almost 600,000 tons of sugar in this current year.
Table 3.3 Total exports handled at Port Louis (1999/2000)
Commodity Tonnage
0/0total exports
CONTAINERISED 384,414 37.58%
SUGAR 313,200 30.62%
BUNKERS 158,406 15.49%
INTER ISLAND 39,429 3.85%
MOLASSES 93,617 9.15%
Sub total 989,066 96.69%
lTotal 1,022,963 100.00%
Source: MPA Cargo Traffic, 1999-2000
The other big export in tonnage terms is bunker fuel to vessels calling at the port.
However the marine fuel oil and marine gasoline oil have tobe imported and then re-sold to the vessels. Thus the profit earned on this product represents the value added on the commodity. The products are landed from tanker vessels, stored and then reloaded onto other bunker callers. Hence the bunkering business differs from sugar which is planted and processed locally. Nevertheless it must notbeassumed that the high tonnage of sugar isassociated with a high income for the islands. Sugarisa low value item
Figure 3.5
Major components of Port Louis exports, 2000 (% exports:total exports)
MOLASSES 9%
BUNKER 16%
SUGAR 32%
Source MPA, Cargo Traffic 1999-2000
CONTAINERIZED 39%
Figure 3.5 shows the major components of exports transiting via Port Louis. It can thus be seen that containerised cargo has the biggest slice of the pie followed by sugar, bunkers, molasses and inter-island cargo. The above four categories represents close to 97 per cent as shown in Table 3.2 above.
3.4 The container traffic.
When Mauritius joined in the world trade in the late 1970s the container revolution had already started and was quickly expanding to all parts of the world. Therewas significant export by the Export Processing Zone in the textile industries and these were done through containers loaded at the port. By the end of the 1980's, there were more than 42,000 containers which were handled at the port. Ten years afterwards, in1997, this figure has almost trebled to reach more than 125,000. There was another boost in the number of containers handled at the port after the opening of the New Container Terminal in January 1999. During the Financial Year 1999/2000 there were more than 150,000
containers recorded by the port statistics. The increase in the container traffic is expected to have a double-digit increase over the next years to come.
However it must be noted that there is also a net increase in the number of transshipment containers handled in the port. In year ending June 1999 there was just over 2000 transshipment containers and in year 2000 this figure has gone up to over 6000. The reason for this major increaseis the marketing activities undertaken by the MPA in order to exploit Mauritius as a transshipment port and the promotion of Mauritius as having the characteristics of a hub status. Although the authorities are not overwhelmed with the present figures and the actual performance of the transshipment activities at the port, it nevertheless represents a net contribution to the port activities. The NeT has a capacity to handle more than 300,000 containers and the authorities are confident that they will be able to cope with traffic for the next twenty years.
The movement in the container traffic isshown in the Figure 3.6 below. Itcan be seen that there isa big discrepancy between the number of empty and laden containers. The number of laden containers is twice the number of empty containers. The figures from the port statistics reveal that there were more than 800,000 tons of commodities which were imported in containers. On the other hand there were only 400,000 tons of goods which were exported in containers. Thus this means that while while 800,000 tons of containerized goods are coming in the country only 400,000 tons are going out. There is hence an imbalance between the volume of containerized cargo which is imported and exported. It is this imbalance which helps to explain the discrepancy between the number
of laden and empty containers. The imports are done in the laden containers. Once the laden are in the island only half of them can be filled up with our exports. The remaining half of the containers must leave the island empty.
The trade authorities have brought forward another reason for the imbalance between the number of laden and empty containers. They advanced that the market for our exports does not correspond to the destination of the vessels. There is a significant amount of containers which come from the Far East, Singapore, Malaysia, Indonesia and India. The bulk of our exports in containers are the EPZ and textile products and our markets for these goods are in the Europe and more recently, the United States. The Far East does not represent a market for our exports in containers. Thus vessels going back to the Far East have to pick up empty boxes from Mauritius because although we import a significant amount of products from them, we do not have significant products to sell to them The empty containers however belong to them and they must be returned to them Thus if there is no export to these destinations then the containers must leave empty. This also explains the imbalance in trade between the laden and empty containers. The graph below shows the number of laden containers, empty containers and the total sum of the number of containers handled at Port Louis harbour.
Figure3.6
Containers handled at Port louis, (1986-2000) (TEU's)
160,000 140,000 120,000 100,000 TEU's 80,000 60,000 40,000 20,000
~m~.::~
W!; ::;
..
:i~J ..
",.:,
86/87 88/89 90/91 92/93 94/95 96/97 98/99
YEAR
18
laden elll>ty OtotalI
Source: MPA Container Traffic 1987- 2000
3.5 Vessel traffic
Vessel traffic in Mauritian waters has experienced a significant growth over the past years.
In 1/986 statistics from the port authority reveals that there were 1314 vessels which visited Port Louis for the year. This figure has increased significantly to reach a peak of 1,823 in the year ended 1998. The following years faced a fall in the number of vessels
such that there were 1,819 vessels in year ending 1999 and 1,791 vessels calling at Port Louis in year ending June 2000.
Over the years Port Louis, like most of the ports of the world, has experienced a change on the tyPe of vessels calling at the port. Thus some categories of vessels, particularly conventional break.bulk cargo vessels have given way to containerised vessels. Fishing vessels as well have experienced major increase in the number calling at Port Louis. There were 606 vessels which called at Port Louis for fishing purposes. The port authorities advanced that the transshipment facilities offered by the cold stor~ge Le Froid des Mascareignes hashelped to attract more fIshing vessels. The vessels can take advantage of the transshipment facilities at the cold storage to easily embark and disembark their cargo.
They also have less congestion and hence faster turnaround time. They save on demurrage and other port charges which make it more profItable for them.
With regards to fully containerized vessels, it can be noted that there has been a fall in the number of vessels calling at Port Louis. The container vessels registered a drop of 24%
from 486 vessels in 1998/1999 to 369 vessels in 1999/2000. However despite that there were fewer containerized vessels calling at the port, the average number of TEUs per call has increased. In 1998/1999 the average number of TEU per call was 279 while in 1999/2000 the average number ofTEU per call increased to 356 implying at the same time that the number of containers being handled at the port has increased. This means that fewer vessels are bringing more containers to Port Louis. Thus it can be gathered that the size of the vessels calling at Port Louis has increased. In fact this occurred as a
consequence of the setting up of the New Container Terminal. With its deeper waters, larger turning basins, deeper access channel and the onshore gantry cranes, the NCT has set place for any kind of vessels to call at the port. Previously only those vessels which had their own cranes on board could berth at Port Louis but now with the new gantry cranes set up at the NCT, any kind of vessels can call at the port. The ship operators on their side fmd it more profitable to use bigger vessels on certain routes because of the advantages of economies of scale. (Port News, Dec 2000).
The other reason put forward for the fall in the nwnber of vessels calling at Port Louis, is the restructuring of the some shipping lines among certain vessels. The vessels operators have entered into a cargo sharing agreement as the case between 'P&O Nedlloyd and Mitsui', and CMNCGM'. These kinds of agreement are meant to improve the efficiency and profitability of certain vessels and consequently lead to the reductioninthe nwnber of port calls. Figure 3.7 below depicts the movement in the nwnber of vessels calling at Port Louis.
Figure3.7
Number of vessels per category which visited Port Louis (1987-2000)
800 600 400 2000 1800 1600 1400 1200
Number 1000 of
vessels
o
+",=..Lr--~"""'"""+"""""""""87188 89190 91192 93194
Year
95196 97198 99100
FishEl Total excluding fish oTotal
I
Source: MPA, Vessel Traffic 1987- 2000
Chapter 3 has looked at the overall traffic performance in the port arenas. Itwas found in all sectors whetherit is in the total harbour tons, vessels arrivals or container movements, have shown a net increase over the past years. The total volume of cargo handledhasbeen examined and the different components which make up the imports and exports commodities have been analysed. The discrepancy between the number of empty and laden containers has been explained. Chapter 4 will now look at the number of people who are employed in the port's direct and indirect activities. The total wage bill will be estimated to see the level of injection in the local economy.
Chapter IV
4.0 The port's activities
The previous section has looked at the port traffic performance over the years.Itwasthus shown that in all sectors of port activities, the figures for imports, exports, containers and vessels have shown a net increase. The objective of this section is to look at the different players involved in the different port activities. These players could either be directly or indirectly related to the functions of the port. This section represents the first part of a quantitative analysis undertaken in this study. By the end of this chapter, it will be possible to identifY the total contribution made to the national economy by the different port players with their subsequent multiplied effects.
In an island like Mauritius where more than 98% of imports and exports are effected through Port Louis, it would be difficult to enumerate all the players. Nevertheless an attempt will be made to look at the major players and their roles. Consequently, the level of economic activity generated by these players will be considered. For the purpose of this study, their contribution to the economic activities ofMauritius would be in terms of the number of jobs they have created and the associated wage bill for the employees involved. Thus the wage bill would represent an injection in the Mauritian economy. The exercise will essentially be a piece of static analysis, as a single time slice (based on 2000 port activity levels) will be used. The figures for the total number of employees and their total wage bill were obtained through interviews with the respective companies' personnel divisions, and from the "Registrar of companies" bureau at the Ministry of Commerce in Port Louis.
4.1 Directly port-related activities.
Before the different port players are looked at, a good starting point would be to list all the activities which can happen when a vessel call at a port. The questions which are asked are: when ships are serviced or when cargo is handled in the port of Port Louis, where and in what numbers are people employed, where is revenue generated and in what pursuits, and where are the costs incurred? (Jones, 1997)
These areas can perhaps best be illustrated schematically by setting out some of the principal chains of ship-related and cargo related functions.
Vessel-related activities
Mauritius Port Authority Marine services
Offshore services
Bunkering services Ships agency
Ship chandlers
Ship repairs
Pilotage Tugs
Dredging services Port construction Berthing services Lighthouses Towage
Launch services Pipeline and barge Port husbandry Crew support Security
Deck and engine spares Victualling
Dry-dock repairs
Shipowners and operators
Other state departments
Cargo-related economic activities
Mauritius Port Authority Cargo services
Stevedoring Ships Agency
Clearing and forwarding agents
Terminal operators
Containers
Road Haulage
Pipeline services
Painting and cleaning Diving services
Owners and representatives Charter operators
Shipbrokers
Ministry of Trade and Shipping
Cargo infrastructure Bulk appliances
Breakbulk cargo handling Container tenninal
Container cartage Combi tenninals
Cargo Handling Corporation Limited Freight canvassing
Freight services Documentation Custom clearances Warehousing Financial services Transport
Bulk
Liquid-bulk handling Combi tenninals
Licensed container depots Container parks
Container logistics Container repair Warehousing Regional transport Oil majors
State Trading Corporation
Customs and Excise Documentation Inspection
(Adapted from Jones T, 1997)
The above schema is by no means a complete list of all the cargo and vessel related activities. A host of activities have been omitted. For example,taxiservices and informal sector activities such as the services of call girls have been left out. Also a number ofthe cargo related activities could be overlapping the vessel related. The two sets of activities are not readily separable. A detailed coverage of each of these activities would be too tedious, hence only the biggest players will be considered. These include the Mauritius Port Authority, Cargo Handling Corporation Limited, State Trading Corporation, the Bunkering industries, Clearing and Forwarding industries, Ships agencies, other Port Operators, Ship Repair industry, Container Parks. Then a brief description of the indirectly industries will be mentioned. Lastly a table drawing up the number of people employed and their wage bill will be shown.
4.1.1 Mauritius Ports Authority.
During the 1980's and 1990's, Mauritius showed that given the right economic policies, easy access to world markets and a dynamic workforce, it could transfonn itself quickly from a purely monocrop export and tourism based economy, to a model for many developing nations. Over the past 20 years the country's gross domestic product has grown significantly to rank Mauritius among the most affluent in sub-Saharan Africa on a per capita basis. This, in turn, has placed huge strains on the island's existing infrastructure, which has been obliged to keep pace with soaring economic growth.
Inthe case of the harbour at Port Louis, this has led the government to support a major investment programme designed to bring the harbour up to world-class standards, culminating in 1998 with the opening of a 26-hectare container terminal at a cost ofUS$
80 million. The new container terminal as a number of other major infrastructural developments are seen as the future for Port Louis as the government seeks to transform the harbour from purely national to international status. (MPA,Port Handbook, 2000)
In line with the multi million dollar investments and prior to the opening of the new terminal has come the reorganization of the Mauritius Marine Authority(MMA)into the Mauritius Port Authority (MPA) and the introduction of new practices at the Cargo Handling Corporation Limited (CHCL), which is now a fully-fledged operator.
For many years the port authority had a vision of the future for Port Louis as a modem regional cargo-handling hub. This dream is now close to reality with all the necessary equipment and facilities in place. Government has always placed Port Louis harbour as a key element in its long term plans for the economic development ofthe country. Not only is Port Louis seen as a separate foreign exchange earner, but it is also important to tl)e development of other sectors of the economy such as sugar, textiles and tourism and cruise shipping as well.
Furthermore, the harbour facilities have formed an integral part of the nation's free trade zone development, which has taken shape alongside the port's new container terminal.
The MPA, CHCL and the Mauritius Freeport Authority are jointly involved in marketing these integrated facilities. Alongside the port's higher profile has come a redefinition of the MPA's functions from an operator with multi - faceted functions to that ofa regulator and landlord with a commercial approach. The port offers concessions to the private sector and is required to achieve a fair return on investment. MPA has become commercial in other ways. During 1999 the MPA undertook a wide ranging tariff study aimed at making harbour changes more competitive, flexible and volume related. This has resulted, for example, in special discounts on dues for transshipment traffic.
The MPA also reduced its own workforce by around 25% last year and undertook a review of all working hours. A third shift for pilotage and other marine services is being implemented. At the same time, new equipment including three gantry cranes and four new tugs have been purchased by the MPA, while the CHCL has taken delivery of new reach stackers and other cargo-handling gear.
The MPA employs about 370 people representing a wage bill of MR 110 million annually. The MPA is not the biggest in terms of number of people employed. This is because of the new role of the MPA has led to several function being left to the CHCL.
Nevertheless MPA is the highest in terms of wage bill because a certain number of CHCL staffs are stevedores with a low average income. (MPA,Port Handbook, 2000)
4.1.2 The Clearing and Forwarding Industry.
The clearing and forwarding industry lies at the very heart of both the seafreight and airfreight markets. They are intimately integrated into all the activities at the port since they represent the interests of both the cargo owner and the carrier. They are very much involved in the preparation of Bills of Entry in cases of imports, managing with customs and making sure that the documentation is completed done in the proper way and time.
They sort out any verification if required. Some Clearing and Forwarding houses undertake payment of customs duties and later claim these back from the consignees of the cargo. Some also operate their own container depots/parks where containers are stored until collected by their respective owners; some run their own bonded warehousing; some extend their activities into the road haulage industry; and some conduct logistic tracking of cargo as well. (Interview with Daniel Ng, Cargo Express)
In Mauritius the major part of the clearing and forwarding industries are grouped into an association called the Association Professionelle des Transitaires (Professional Association of Freight Forwarders). There are 25 members of that association. The association now groups the biggest C&F companies in Mauritius namely Cargo Express from the Rogers group and Somatrans from the ffiL group. Previously it was only these two companies which dominated the market but after the 1980's when Mauritius entered into its new phase of development the number of C&F companies increased. These two big companies have their own container parks and road haulage companies.
The bulk of the revenues of the C&F industry come in the form of charges to the respective parties. They are remunerated for their expertise in the preparation of the bills and other documentations, transport of the containers, storage and their other services.
The introduction of e-commerce and the Internet and other electronic forms of communication has decreased the number of personnel involved in the C&F industry.
Nevertheless it still represents a rather big employer in the shipping arena. There are approximately 80 companies representing 800 people in the whole C&F industry which generate an approximate wage bill of about MR 65 million annually.
4.1.3 State Trading Corporation.
The State Trading Corporationwas set up in1982. Its objectives include the negotiations for the purchase of goods, the engagement in the manufacture or processing of goods and ensuring their marketing and to export goods amongst others. In laying down the rules governing the functioning ofthe State Trading Corporation, the Government ofMauritius has been guided by the willingness to give flexibility, maximum efficiency and reasonable autonomy to the Corporation while ensuring that it remains accountable to the Government and the National Assembly. The corporation's status undoubtedly gives greater flexibility than a government department. With the appointment of a Board of Directors, comprising representatives from both the public and private sector, with extensive powers to administer the Corporation, a high degree of autonomy, which is so vital to a commercial concern, is ensured. This relative autonomy and the presence of experienced businessmen on the Board contribute to greater efficiency. Finally, by giving certain powers to the Minister responsible for Trade and Shipping, and by subjecting the
Corporation to the Statutory Bodies (Accounts and Audit) Act, the Government has ensured that the Corporation would remain accountable to it.
Given the strategic role of imported petroleum products in the Mauritian economy and their impact on the balance oftrade, the Government decided in 1983 that there should be some public intervention in this sector. The Corporation was instructed by Government to take over from the existing importers, the importation of25% of the country's domestic market requirements. The good performance of the Corporation, especially in terms of prices obtained with resulting substantial savings in foreign exchange prompted the Government to increase the STC's share of the domestic market to 50% in 1984.
Subsequently, the Corporation was asked to take over the importation of all petroleum products, including those destined to international trade (bunker and aviation fuel) and it has since 1985 been importing these products to meet the total requirements of the country. Petroleum products comprise around 95 000 tons of gasoline, 300 000 tons of gasoil, 250 000 tons ofdual-purpose kerosene and 150000 tons offuel oil to make a total importation of some 800 000 tons of petroleum products. These products are then delivered to the four retailing petroleum companies: Shell, Caltex, Total and Esso.
With regard to the cement trade, the Mauritius Portland Cement Co ltd had the monopoly to import and distribute cement in Mauritius since 1957. The Government felt that it would be in the interest of the country to have more than one importer and in 1984 the STC was entrusted with the additional responsibility of importing 25% of the domestic requirements.In1985 STC's share was increased to 50% and it has remained like this up
to now. However the other 50% has been shared between two companies namely Kolos Ltd and Mauritius Portland Cement Ltd. The 50% ofthe importation which STC does for the local market represents 300 000 tons a year. The STC buys the cement in bulk and resells in bulk to the other two companies. The latter bags the cement for retail sale to the public. (Interview with Mrs Domaingue, STC)
The corporation handles some 80 000 tons of wheat flour a year representing 50% of the local market. The other 50% is handled by the Les Moulin de la Concordes ltd. Flour is imported in bags of 50 kg but they are containerized. STC is the sole importer (some 50 000 tons a year) of subsidized non-luxury rice from India, China and Pakistan. The Corporation is also involved in the importation of luxury rice (some 10 000 tons a year) where it does not have a monopoly. Rice on its part is imported in bags of 50kgs as well as in loose bulk form. It makes the oflloading of rice very labour intensive. STC also purchasesJ,200 tons a year ofsugar from the Mauritius Sugar Syndicate, which is sold in small amounts in Rodrigues. (STC, Reports and Accounts, 1999)
The turnover of STC is in the region of MR 9 billion annually. The four main products, which STC deals in, are petroleum, flour, rice and cement. The STC does not cover any storage cost with regards to the petroleum products because as soon as they arrive, they are delivered to the four local petroleum companies. Flour and rice are stored in Shed A and Shed 1. The latter are rented from .the MPA and an annual rental fee of MR 8m is paid to the MPA Cement follows the same process as the petroleum products and they are directly delivered to the two companies Kolos Ltd and Mauritius Portland Cement
Ltd. STC faces a cargo handling fee ofMR 8.2 million and port fees ofMR12 million annually for its activities at the port. There are 300 people employed by the STC who deals with the importation and exportation of goods via the port. The wage bill for these employees represents approximately MR45 million. (STC, Reports and Accounts, 1999)
4.1.4 The Bunkering industry.
Lacking indigenous oil supplies, or even a refinery of its own, Mauritius is clearly disadvantaged in the world bunker market. Nevertheless these unfavourable circumstances are more than compensated for by the island's strategic position in the Indian Ocean and by excellent service provided by local suppliers.
The total annual volume of bunker fuel supplied to vessels making calls at Port Louis amounts to some 200,000 metric tons. Of this approximately 140,000 metric tons is Marine Gas Oil (MOO) - often lifted by fishing vessels - with the balance accounted for by sales ofMarine Fuel Oil (MFO) used by other vessels.
The market is regulated in such a way that all four suppliers must buy their oil from the State Trading Corporation, which receives bulk fuel supplies by tanker from the Arabian Gulf every 20 days or so. Shell, the market leader with a 65 per cent share of the market, supplies vessels using a 530-ton barge as well as ex-wharf The other three suppliers _ Esso, Caltex and Total- are restricted to facilities at the fish quay and deliver only MOO, mostly to Taiwanese fishing vessels. This makes the market for the fishing vessels very competitive. (Interview with Mrs Michelle Wong Min, Shell)
Shell uses its barge (L 'ami Constant) to supply vessels making bunker calls off Port Louis. The barge can supply any vessel within a two miles limit off the perimeter of the port. There is a additional cost of US$ 7 per metric ton, which the barge supplies to vessels. The barge has brought a lot of advantages to the bunker industry in Mauritius.
There are certain vessels which are in a hurry to get to their next port call and they do not want to get inside the port areas in case they get congested. Hence they call for the service of the barge. Vessels urgently in need of bunkers may also call upon the barge to provide bunkers before they come alongside. Shell has thus the facility to reach such kind of vessels even if they are off the quay. However they must still remain in the parameter of 2 miles from the port area. The use of the barge has make it possible to reach any type of vessels which visits our waters. The company also has the license to use the pipeline facilities at QuayA,D, E and Quay 1,2,3.
The four companies involved in the bunkering industry have to incur a licence fee payable to the .MPA for the use and operation of the port facilities. Thus each time a tanker calls in the port and they have to oflload the tanker they have to pay a fee ofMR 15,000 per tanker. This fee is usually set in the price charged by the STC. On the other hand when a vessel calls in the port for bunkers, the port authorities charge a fee ofUS$
1,48 per tons offuel supplied. This fee, termed a 'pipeline dues' represents a fee for the rental of the pipeline facilities at the port. (Interview with Mrs Bunwharee,.MPA)
Approximately 800,000 metric tons of petroleum products are pumped through the pipelines of the port annually. This figure includes all MGO and MFO and other petroleum products imported by Mauritius. Out of this figure some 200,000 metric tons are sold as bunkers to vessels calling at Port Louis. The MPA has generated almost MR 45 million for the year 2000 from pipeline dues.
The purpose of this study is look at the industries which are directly related to the activities of the port. Thus in this regard, only the 200,000 metric tons of bunkers supplied to the vessels calling at Port Louis will be looked at. These 200,000 metric tons are shared among the four bunkering companies mentioned above where Shell has the biggest slice of the pie. Interviews with these companies made it quite clear that they have a particular section of their company which deals with the bunkering of vessels.
Their functions relate mainly to the oflloading of tankers, supply of bunker fuel to vessels, administration and operations. However given the volume of operations, the number of people employed in these activities is very limited. The bunkering department of there four industries provides employment for 45 people with a wage bill of MR 9 million annually.
Mauritius finds itself in a strategic position where several vessels serving the South Indian Ocean route stop at Port Louis to make provision for bunkers. The other ports of the region, namely the port of Reunion and the ports of Madagascar are not great competitors with regards to Mauritius. Their prices are higher than local prices. Thus the next decent bunker call would be Durban on the west side route or Australia in the east
side routes or Colombo in the north. Thus there is a significant distance from Mauritius to the next feasible ports of call, which makes the island an attractive of bunker port. Also there are significant numbers of fishing vessels that fish in our waters and because of the price competitiveness and the lack of congestion, consider Port Louis to be their only obvious source of bunkers and stores.
4.1.5 The Ships Agencies
The principal task of the clearing and forwarding agents is to represent the interests ofthe family of cargo owners. Similar tasks are faced by the ships agencies which represent the interests of shipowners. Ships agents' functions include basic ships husbandry (seeing to the welfare of vessels and their crews), interfacing with the port authorities, maritime safety and the procurement and safe handling of cargoes. Ships agents are thus concerned with every aspect of the operations of the port.
In Mauritius the ship agents are grouped under the association called ''Association Professionelle des Agents Maritimes". Once again the two big ship agents in Mauritius are grouped under the Rogers Group and the Ireland Blyth (IBL) Group. Between the two of them they represents almost 10shipping lines. The ffiL group is divided into three companies in its shipping cluster namely, Blyth Brothers& Co Ltd, Adam& Co Ltd and Ireland Fraser& Co Ltd. The Rogers shipping cluster is represented by two companies namely Rogers Shipping & Co Ltd and Scott & Co Ltd. These two groups are the oldest ship agents in Mauritius. Then there are other ship agents like Maersk (Mauritius) Ltd, Union Shipping from the ABC Group representing the Ahrenkiel Line Service, Happy
World Shipping representing Pacific International Line and the IKS group. There are close to 42 shipping agents in Mauritius representing many different carrying lines. A list of the main ship agents and the lines that they represent are shown below.
A ents lines
hrenkiel Liner Services
Shi
Mitsui Pure Car Carrier
Source: MFA, Shipping connections, Jan 2000
Nedllo d Lines Mitsui aSK Line Mediterranean Shi Kline
Hoe h U land Auto Liners
Delmas
Pacific International Line
Un· 10
Statistics for the year 2000 shows that the vessels represented by the group Rogers and ffiL have the highest tonnage in the port traffic. Rogers handled 27,916 TEUs that is 28,85% and ffiL had 40,43% or 37,813 TEUs. ffiL is the first ship agency in Mauritius which has obtained the ISO 9002 certificate. This shows that the operations of the ship agencies in Mauritius have attained a rather high level in the world market. In Mauritius