isprsannals II 3 W2 49 2013
Teks penuh
Gambar
Dokumen terkait
The proposed algorithm for building extraction in airborne LiDAR data can be divided into three key steps: Filtering, scan line segmentation, object based classification.. 2.1
Tracking comparison between the proposed method (top) and KLT (bottom) shows a significant tracking improvement on this aerial dataset, especially along image borders where the
KEY WORDS: Traffic sign detection, Sliding window, Object Detection, Frequency
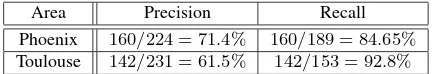
To restrict the search range for image patch based classification from all possible pixel positions (e.g. 21MPix) to a small number of probable candidates (50,000), we first apply
The actual data model implies that interior components of a building have only one (geometrically exact) representation, and that the building ’s interior can only be represented
Lower-level sensor measurements task are prone to errors due to noise and faulty (Iyer et al., 2008) sensors. Incorrect results can be obtained as the upper level Gram Matrix relies
The offset range in position, seen with Sinus is slightly smaller, but shows positive biases for x and y as well. One can find an alternating pattern for the lateral position
Within this paper, we focus solely on modelling the LOD of a 3D city model as an extra geometric dimension—in so far as it can be used to store all topological relationships
