Directory UMM :Data Elmu:jurnal:A:Aquacultural Engineering:Vol22.Issue3.Jun2000:
Teks penuh
Gambar

Dokumen terkait
In this case, Slutsky (1915) and Hicks and Allen (1934) showed that the good with increasing marginal utility will be normal and all other goods will be inferior, while Hicks and
Although the sign and size bias tests of Engle and Ng performed reasonably well, the BDS test was virtually unable to detect asymmetries which were present in the data.. These
Drawing from numerous and di- verse sources, Fernando Santos-Granero and Frederica Barclay create a comprehensive analysis of the history, ecology, anthropology, and sociol- ogy of
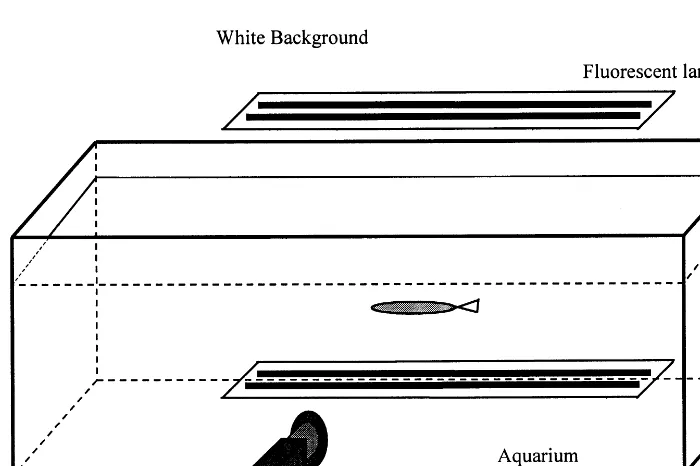
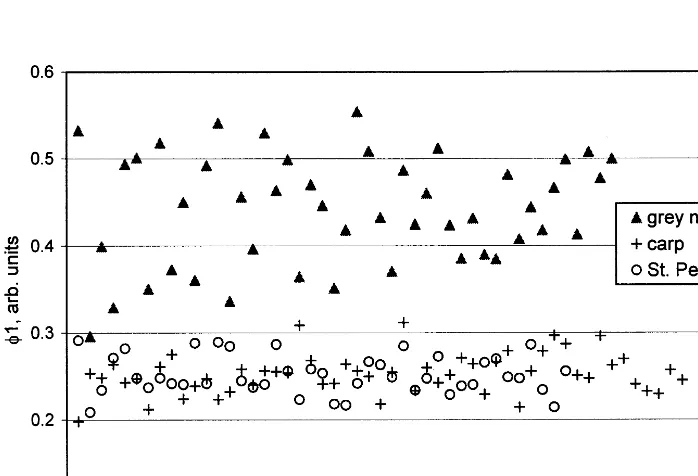
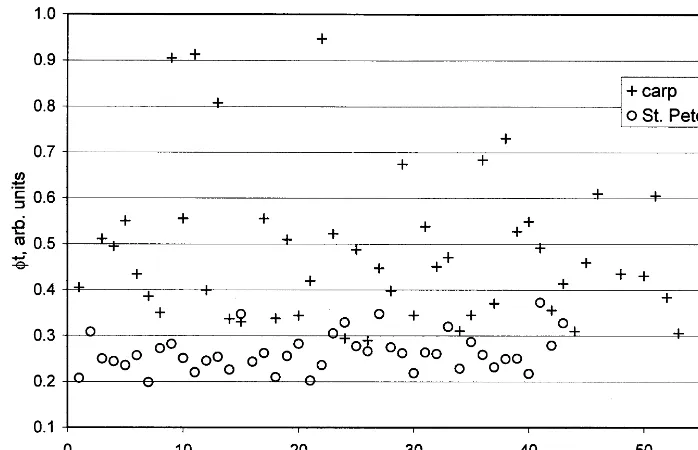
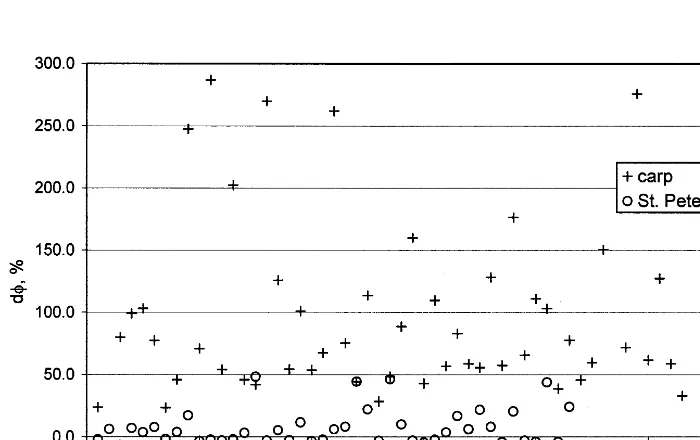
A 4-month study was conducted to determine the influence of daylength on growth, hetero- geneity, gonad development, sexual steroid and thyroid levels, and N and P budgets in
difference between delivered and wasted feed. Apparent digestibilities and pancreatic enzyme activities along the intestinal tract were determined from analyses of chyme from
As a general trend, pigment content and its evolution over the growth period were found to be similar between the cultures grown under control and high DIC conditions for each alga,
one centrally positioned high solids concentration outlet and one corner located low solids concentration primary outlet; and (2) a stationary bowed screen for solid removal from
along with soil properties from 34 major (base and benchmark) soils; (2) to internally check by calculating average corn and soybean yields using the model generated coecients and
