REAL TIME CLASSIFICATION AND LOCALIZATION OF HERB’S LEAVES USING YOLO.
BY
Md Shoreef Uddin ID: 161-15-6891
AND Abdullah ID: 161-15-7424
This Report Presented in Partial Fulfillment of the Requirements for the Degree of Bachelor of Science in Computer Science and Engineering
Supervised By
Md. Jueal Mia
Senior Lecturer Department of CSE
Daffodil International University Co-Supervised By
Shah Md. Tanvir Siddiquee
Assistant Professor Department of CSE
Daffodil International University
DAFFODIL INTERNATIONAL UNIVERSITY
DHAKA, BANGLADESH JULY 2020
APPROVAL
This Project/internship titled “Real time Classification And Localization of Herb's Leaves Using YOLO”, submitted by Md Shoreef Uddin, ID No: 161-15-6891 and Abdullah, ID No: 161-15-7424 to the Department of Computer Science and Engineering, Daffodil International University has been accepted as satisfactory for the partial fulfillment of the requirements for the degree of B.Sc. in Computer Science and Engineering and approved as to its style and contents. The presentation has been held on 9th July 2020.
BOARD OF EXAMINERS
Dr. Syed Akhter Hossain Chairman
Professor and Head
Department of Computer Science and Engineering Faculty of Science & Information Technology Daffodil International University
Md. Sadekur Rahman Internal Examiner
Assistant Professor
Department of Computer Science and Engineering Faculty of Science & Information Technology Daffodil International University
Saiful Islam Internal Examiner
Senior Lecturer
Department of Computer Science and Engineering Faculty of Science & Information Technology Daffodil International University
Dr. Md. Motaharul Islam External Examiner
Professor
Department of Computer Science and Engineering United International University
DECLARATION
We hereby declare that, this project has been done by us under the supervision of Md.
Jueal Mia, Senior Lecturer, Department of CSE Daffodil International University.
We also declare that neither this project nor any part of this project has been submitted elsewhere for award of any degree or diploma.
Supervised by:
Md. Jueal Mia Senior Lecturer Department of CSE
Daffodil International University Co- Supervised by:
Shah Md. Tanvir Siddiquee Assistant Professor
Department of Computer Science & Engineering Daffodil International University
Submitted by:
Md Shoreef Uddin ID: -161-15-6891 Department of CSE
Daffodil International University
Abdullah
ID: -161-15-7424 Department of CSE
ACKNOWLEDGEMENT
First, we express our heartiest thanks and gratefulness to almighty God for His divine blessing makes us possible to complete the final year project/internship successfully.
We really grateful and wish our profound our indebtedness to Md. Jueal Mia, Senior Lecturer, Department of CSE, Daffodil International University, Dhaka. Deep Knowledge & keen interest of our supervisor in the field of Machine Learning to carry out this project. His endless patience, scholarly guidance, continual encouragement, constant and energetic supervision, constructive criticism, valuable advice, reading many inferior drafts and correcting them at all stage have made it possible to complete this project.
We would like to express our heartiest gratitude to Md Jueal Mia, Shah Md. Tanvir Siddiquee, and Dr. Syed Akhter Hossain, Head, Department of CSE, for his kind help to finish our project and also to other faculty member and the staff of CSE department of Daffodil International University.
We would like to thank our entire course mate in Daffodil International University, who took part in this discuss while completing the course work.
Finally, we must acknowledge with due respect the constant support and patients of our parents.
ABSTRACT
Day by day the usage of Artificial Intelligence makes our life easier and comfortable.
Machines are started to learn as like human. Complex Problems can be solved easily by Artificial Intelligence. A machine can only do computing. By using the computing technique a machine can detect or classify objects. Getting higher accuracy and reducing prediction times are always the biggest challenges for image classification.
Herbs have played a major parts in medical science for thousands year. Herbs have the ability to combat with diseases. People have less amount of knowledge about herbs as a result it becomes an issue to recognize them. Using poisonous plant as medication might increase the risk of life in serious way. In this paper we will discuss about how to classify and localize five types of herbs. Those five types of herbs are Mehdi, Betel, Mint, Basil and Aloe Vera. We will build a Neural Network model and train the model to classify the herbs. In Future we can implement the trained model into a mobile application which will help user to learn about herbal remedies. Therefore, we are proposing a novel approach for classifying herbs and also localizing the individual herb by using artificial intelligence.
TABLE OF CONTENTS
CONTENTS PAGE
Approval I
Board of Examiners I Declaration II
Acknowledgement III Abstract IV
Table of Contents V
List of Figures VII
List of Tables VIII
CHAPTER
Chapter 1: Introduction 1-4
1.1 Introduction 1
1.2 Motivation 1
1.3 Rationale of the Study 2
1.4 Research Question 2
1.5 Expected Output 3
1.6 Report Layout 3
Chapter 2: Background 5-7
2.1 Introduction 5
2.2 Related Works 5
2.3 Research Summary 6
2.4 Scope of the Problem 6
2.5 Challenges 7
Chapter 3: Research Methodology 8-21
3.1 Introduction 8
3.2 Research Subject and Instrumentation 9
3.3 Data Collection and Processing 10
3.4 Selecting Anchor Box 13
3.5 Model Architecture 18
3.6 Loss Function 20
Chapter 4: Experimental Results and Discussion 22-25
4.1 Introduction 22
4.2 Experimental Results 22
4.3 Real Time classification and Detection 24
4.4 Summary 25
Chapter 5: Summary, Conclusion, Recommendation and Implication For Future Research 26-27
5.1 Summary of the Study 26
5.2 Conclusions 26
5.3 Recommendations 27
5.4 Implication for Further Study 27
References 28
Plagiarism Report 29-34
LIST OF FIGURES
FIGURES PAGE NO
Figure 3.1.1: Work flow of proposed system. 8
Figure 3.3.1: Training data set. 10
Figure 3.3.2: Annotating images and the XML file. 11
Figure 3.3.3: Cluster of normalized data. 12
Figure 3.4.1: Intersection over union. 13
Figure 3.4.2: K mean clustering. 15
Figure 3.4.3: Elbow Curve. 15
Figure 3.4.4: Selected anchor boxes. 16
Figure 3.4.5: Input Output Encoding. 17
Figure 3.5.1: Tiny YOLO Model Architecture. 18
Figure 3.6.1: Loss Function of YOLO 20
Figure 4.2.1: Bounding box and Class value. 22
Figure 4.3.1: Localization Error. 24
Fig: 4.4.1 Confusion Matrix. 25
LIST OF TABLES
TABLES PAGE NO
TABLE 3.5: Tiny YOLO model information. 19
TABLE 4.4: Precision and Recall Values 25
CHAPTER 1 INTRODUCTION
1.1 Introduction
The field of image classification have seen a rapid development in the recent years due to the evolution of artificial intelligence. Early object detectors are based on handcrafted features. Data scientist need to extract features from images manually then feed the extracted information to a neural network for training. Which is time consuming and still need human interaction.
The main objective is to identify each herb and also show an anchor box around the object. Two popular approaches for doing object detection that are anchor based are Faster-RCNN (Faster Region Convolutional Neural Network) and YOLO [1] (You Only Look Once). We use YOLO for this project. YOLO is single shot object method based detector capable of real-time object detection, obtaining 45 FPS on a GPU. In this method image classification and localization happen at the same time. Which is faster but less accurate than Faster Region Convolutional Neural Network. By using YOLO we can detect object in images, in video streams and also in real time. YOLO is first introduce in 2015 by Redmon et al [2].YOLO has got few updates in recent years which are known as YOLO9000, YOLO v3 and YOLO v4.
1.2 Motivation
In this modern era we are completely relay on Allopathic medicine for treatment. There is no doubt herbal medicine also have the ability of healing. Herbal medicine is available in the nature and cheaper than Allopathic medicine. The reasons for not using herbal medicine are most of the people don’t know much about herbs and don’t able to identify the herbs. Our motive is to develop a system to identify the herb, so that a description about the herb can be provided to the user.
1.3 Rationale of the Study
The main objective of our work is to detect five selective herbs from the video stream of an android device camera in real time. This falls into the category of image classification in Computer vision. The problem is that detection is not as simple of a task as image classification. It not only requires to recognize the object in an image but also detect the location of the object in a given image. In addition to that problem the classification cannot work if a given image contains more than one object. The YOLO algorithm is a smart approach for detecting and recognizing any particular object or a class of objects in real time with an optimal accuracy rate. YOLO is a very clever object detecting algorithm which is combined with a convolution neural network to detect and classify the object or class of objects in real time. YOLO is extremely fast algorithm because of the benefits of how the algorithm is structured. As the algorithm uses just a single convolution neural network to predict multiple bounding boxes and class probabilities for those boxes simultaneously, the processing time needed for the whole process is significantly lower than any other object detecting algorithm which is an absolute necessity for real time object detecting. YOLO algorithm not only just trains on the whole image to improve the accuracy of classification of the objects but also directly optimizes the whole detection performance of the algorithm for the detection of objects in real time. YOLO algorithm is capable of learning to generalize the representation of the intended object from training so when the acquired model from training is tested on a neutral image it is able to outperform other top detection methods.
1.4 Research Questions
How can we identify herbs?
What approach should we take to select anchor box?
What type of training data should be used so that it could give better results that can be correlated with real time?
What is the way to annotate training images?
How efficient is the YOLO architecture for training and predicting?
How much of training dose it needs?
1.5 Expected Output
The main purpose of this work is to create a real-time object detection system which can easily detect herbs using the camera. For our particular system we have tried to detect Mehdi leaf, Betel Leaf, Mint, Basil and Aloe Vera furthermore recognize the individual herb in real-time. The YOLO algorithm first divides the input image of the herbs into an S×S grid and then tries to detect an object and after the detection of the object which in our case are the particular herbs is then recognized by using CNN. Our proposed system should be able to complete the whole procedure in real-time with optimal accuracy and recognize the particular herb from the cameras image input. With sufficient training the system should be able to generate a model that could give us accurate detection of the herbs every time. After the completion of the training the system that we generate we will gather the experience and use it so that we are able to create a more enrich system that is able to detect and recognize all the herbs known to mankind. The system could then become a valuable asset for various sectors which include education and scientific work. The system could be used for detecting the most rare and important herbs which are very scarcely ever found and preserve them for future. These rare herbs are used for making very important medicines and also used in various treatment methods that is a direct cure for many life-threatening diseases. This could bring about a revolution in the botanical field and herbal medicines.
1.6 Report Layout
We have ornamented the whole paper with five chapters. Each chapter has been explained appropriately for the particular implementation and extended description to make the concept easier in term of understanding. The first chapter reflects the information about the motivation behind the study and also draws a picture about the rationale of the Study to portrait the expected outcome. In the second chapter we have explained about the background of our study and describe some of similar researches.
We have tried to explain some problems of previous study and the challenges we faced to solve those problems. After the second chapter the third chapter has been made with the elaborate methodology of our work. We have tried to explain everything from the scratch. We have explained about the pre-processing of training data, model
architecture and loss function. Then the statistical analogy for the research and also the re-equipment for the work. In the fourth chapter we have described about the outcome of our study. A deference between our current result and expected result was reflected in the fourth chapter. Finally at the end we have described an overall short but descriptive summary of our research work and drawn a final conclusion. The implication for future studies has been described with accurate and rightful explanation to exploit the findings of the research work and technique for further usability.
CHAPTER 2 BACKGROUND
2.1 Introduction
Herbs are an essential part of our ecosystem. Medical science has a long history of using plants or herbs as source of medicine. Herbal medicines are used as alternative of allopathic medicine. The classification of herbs by the help of computer vision can solve so many problems as well as save times in the sector of medical science. That can also be used for spreading knowledge about herbal medicine among the people who have less perception about herbal remedies. A lot of approaches was made in last few years for classifying herbs by the help of computer vision. It is quite impossible to teach a machine to mimic or predict exactly the same way a human can. As a result gaining higher accuracy, reducing predicting time and selecting bounding box around the predicted herb are always challenges for image classification and object localization.
2.2 Related Works
The breakthrough of computer vision happened recently in 2012. A lot of image classification method and object localization method were developed in recent years.
Z. Husin, A.Y.M. Shakaff and A.H.A. Aziz they proposed a system [3] where they developed an embedded portable device for herb leaves recognition using image processing techniques and neural network algorithm. At first they captured the herb images with fixed resolution then they converted the images into gray scale images.
From the gray scale images they determined threshold and converted the threshold into binary image outcome. Then they applied various edge detection techniques such as Sobel, Prewitt, Roberts and Canny respectively on binary image outcome. At the end they extracted features and fed it to a neural network for training. Then they used the trained model for prediction.
Another good approach was proposed for recognition of Ayurvedic Medicinal Plants from Leaves by Amala Sabu, Sreekumar K and Rahul R Nair [4]. There proposed system contains four stages Image acquisition, Image pre-processing, Feature Extraction and Classification. In the feature extraction stage they extracted speed up robust feature (SURF) and Histogram of Oriented Gradients (HoG) feature. Then they combined feature vector and performed the simplest supervised classification algorithm
‘KNearest Neighbor’ for classifying the leaves.
2.3 Research Summary
This work features Yolo framework which contains convolution neural network to classify five types of herb. As the work is dedicated to detect herbs from the real time.
We needed a process that not only is fast in its working principle but also needed to be very accurate detecting the herb from the continuous video stream. The YOLO algorithm enabled us to leverage its fast processing and optimal accuracy in detecting the objects from the video. Exploiting the advantages that YOLO algorithm provides an optimum result were generated which was far better than of what other methods or processes had to offer and also the video from the android camera was an optimal input for the YOLO algorithm to work on.
2.4 Scope of the Problem
In the previous works the main focus was only on classifying herbs. Less work was based on object localization. One of major drawback was the involvement of human for feature extraction which was also a time consuming task. The time duration for predicting was also high so that the previous works could not be useable in real life time. Our proposed system can classify herbs and also can localize the object by creating a bounding box around the object in real life time.
2.5 Challenges
This research deals with thousands of images of herb. This images requires pre- processing before feeding them into a Neural Network for training. To sum it up a strong hardware based computational system is required for this research. Our computer was able to keep up with the hardware but barely. As a result each iteration took a huge amount of time while training. The biggest challenge for us was to learn deep learning [5] and YOLO because we were completely new in this sector as we did not have any prior knowledge about it. We started from the scratch and spent a lot of time by solving our own questions which were keep generating on our mind as we started learning. We focused extremely on studying rather than implementing. That is why it proved to be extremely difficult for us to make any alteration in our implementation.
CHAPTER 3
RESEARCH METHODOLOGY
3.1 Introduction
The main purpose of object detection and classification is to be fast, accurate and also able to detect several of objects. The evolution of neural networks make the detection framework faster and accurate. We propose a joint training method which allows to train object detectors for doing detection and classification at the same time.
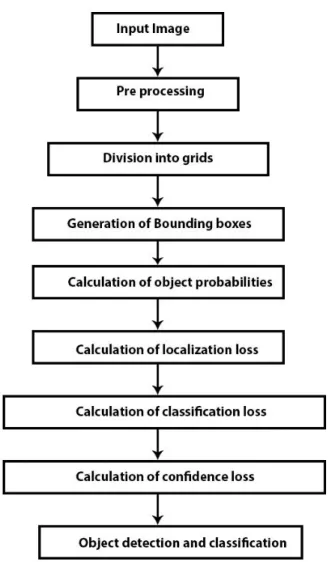
Figure 3.1.1: Work flow of proposed system.
Fig 3 shows the work flow diagram of our proposed system. Our system follows a certain flow method to classify objects and localize them quickly. Firstly, we need to pre-process the input images and divide the input images into grid cells. Secondly it derives the class probabilities and calculates the class specific confidence scores. At the end the confidence score is compared with a specific threshold value. If the score is less than the threshold value than it is considered that no object is found.
3.2 Research Subject and Instrumentation
The goal of our project is to create a model that can classify five types of herbs. To reach in our goal we have to go through in many steps such as collecting data, preprocessing data, Selecting anchor boxes, creating the model architecture. The analysis of those steps are elaborately described from the scratch in Yumi's blog [6].
Instrumentation
Python
Tensorflow
Keras
Numpy
Microsoft’s Visual Object Tagging Tool( VOTT)
3.3 Data Collection and processing
It is essential for Artificial Intelligence to provide better training data for getting higher accuracy. We have collected different herb’s images from internet .We have also captured the herb’s image from different angle and also on different background by using smartphone camera. Collected images require preprocessing before feeding them to a Neural Network model.
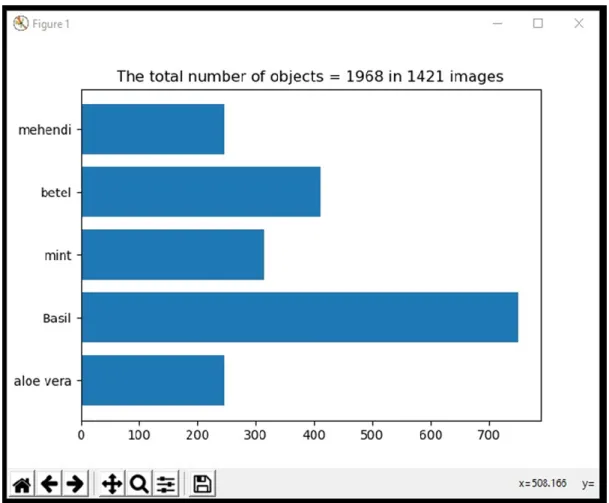
Figure 3.3.1: Training data set.
Figure: 3.3.1 is the visual representation of our training data. There are total 1968 objects and total 1421 images of five species of herb. Some pictures contains more than one object so that the object number is higher than the image number.
Annotate Images
In order to detect object such as herb we need to feed our model labeled data. According to those labeled data we will train our model. We use Microsoft’s Visual Object Tagging Tool (VoTT) to label images. We basically select an anchor box around the object manually. That Anchor box provides the x min, y min, x max and y max values.
we save the values correlated with the object name in an xml file. The xml file also contains the actual height and width of the images.
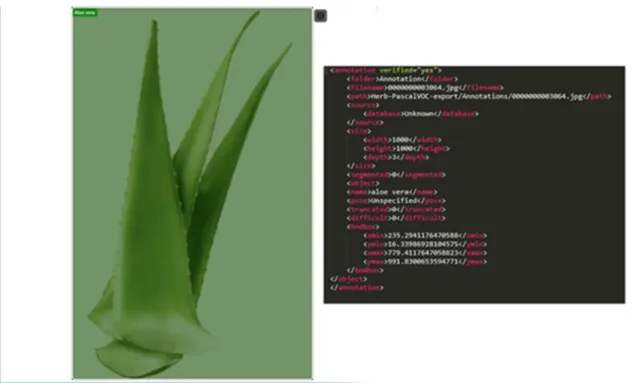
Figure 3.3.2: Annotating images and the XML file.
From the fig 3.3.2 we can see that the bounding box around the object Aloe vera which is labeled manually. The xml file of that Aloe Vera image contains the object name, actual height, width, xmin, ymin, xmax and ymax postion of the anchor box.
Normalizing Images
To run the k mean clustering first we need to normalize the value of the training data.
We need to convert the height and width between zero to grid height and grid width.
Normalized Width = xmax – xmin/Actual Width Normalized Height = ymax- ymin/Actual Height
We calculate the normalized width by subtracting xmin value of the bounding box from the xmax value then divide the value by actual width of the image. Similarly we calculate the normalized width. We perform the calculation for every images in our training data set.
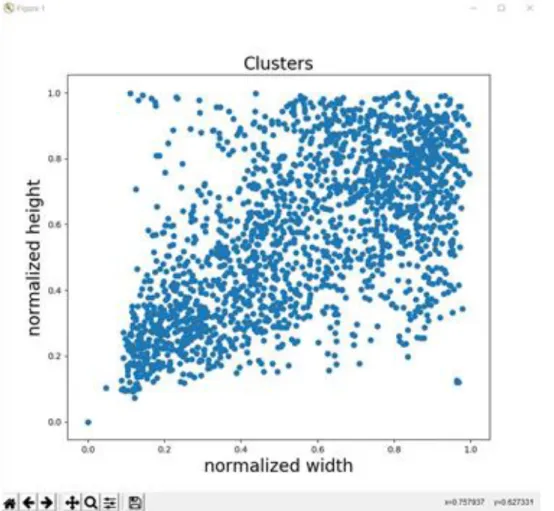
Figure 3.3.3: Cluster of normalized data.
Fig 3.3.3 is the visual representation of the normalized data. It is hard to see if there is any clearly separated clusters so that it will be difficult if we select the cluster manually.
We applied k mean clustering for k =10 on the training data to select suitable anchor
3.4 Selecting Anchor Boxes
In YOLO the images are divided into S x S grid cells. In our case we divided the images into 13 x 13 grid cells. Each grid cell is responsible for detecting the amount of anchor box that we provide while training. The selection of size and quantity of Anchor box are so important. Using larger number of anchor box will make the model complex.
Similarly selecting smaller number of anchor box lead to localization error. Instead of picking the priors by hand we can apply K mean clustering on the training dataset to get better result.
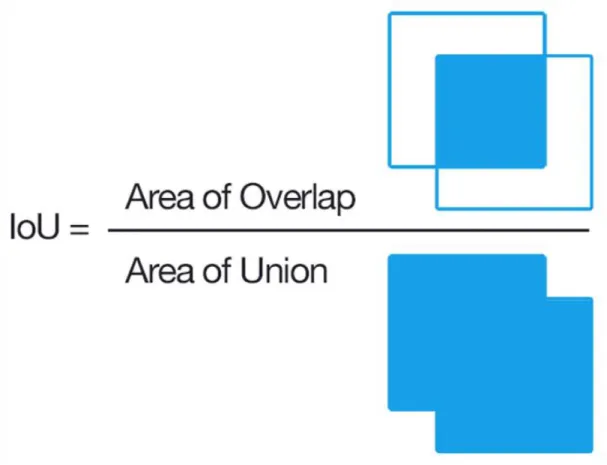
Intersection over Union (IOU)
Intersection over union return the similarities between two subsets on the range 0 to 1.
IOU>0.5 is considered to provide better result for clustering.
Figure 3.4.1: Intersection over union.
Fig 3.4.1 is the graphical representation of IOU. The IOU can be defined for two boxes, Box = (w1,h1), centroid=(w2,h2) as follows
IOU(box, centroid) = Intersection size(box, centroid) / Union size (box, centroid) Where,
Intersection Size(box, centroid) = min (w1,w2) X min (h1,h2)
Union Size (box, centroid) = (w1h1+w2h2) – min(h1,h2) x min (h1,h2)
K Mean Clustering
To perform K mean clustering first we need to find distance between box and centroid.
If we use standard Euclidean distances, larger box will provide bigger error than the smaller one. To solve this problem we use another distance matric which provide better IOU value and also not related with size of anchor box. The distance matric is
d(box,centroid)= 1-IOU(box,centroid)
First we select Centroid box randomly from training data set where centroid box number is equal to K. Then we calculate the distance d(box,centroid) of each box with each cluster centroid. Assign the box to the nearest cluster center of distance then we update the center point until the cluster center has a small amount of changes. At the end we calculate the mean IOU value for each cluster.
To update the center point we use:
Where
W= Width of box H= Height of box
N= Total number of boxes in each (i) cluster
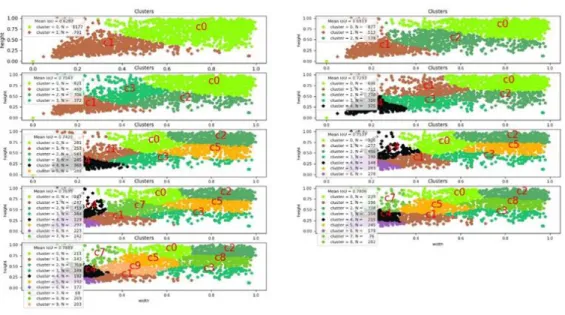
Figure 3.4.2: K mean clustering.
Fig 3.4.2 is the visual representation of K mean clustering where k’s range is two to ten. It also shows the mean IOU value of each cluster on the left side. For training we cannot use ten anchor boxes because it will increase the total parameter of output layer as a result it will also increase the complexity of the model.
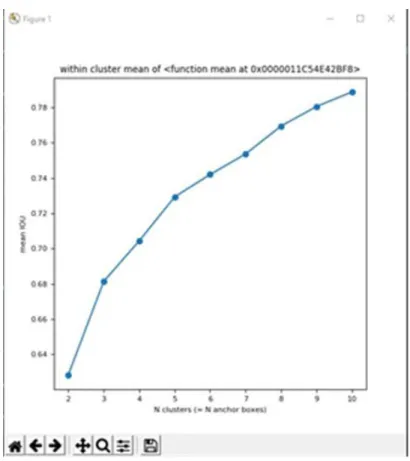
Figure 3.4.3: Elbow Curve.
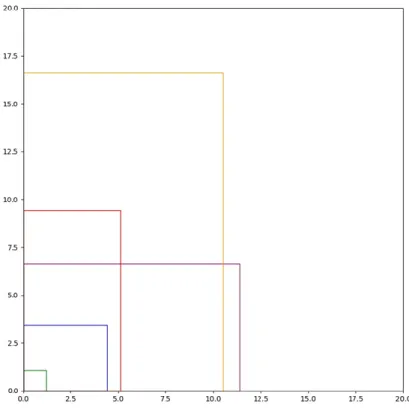
We need to make a decision on how many anchor boxes should we use. Fig: 3.4.3 is known as Elbow Curve where mean IOU of N cluster is plotted. The idea is that the true number of clusters is captured when the increase in the mean IOU slope is substantially large. We decided to use five Anchor boxes for the training. Fig: 3.4.4 shows the selected anchor boxes which we used to train our model.
Figure 3.4.4: Selected anchor boxes.
Input and Output Encoding
Yolo network can operate on 416 x 416 x 3 images as input. So it is necessary to shrink down the input images into 416 x 416 x 3. The convolutional layers in YOLO network down sample the image in the factor of 32. If we use a 416 x 416 x 3 as input image we will get an output feature map of 13 x 13. Each output grid cell is responsible for detecting an object. The reason for using 416 x 416 x 3 image as input to get a single cell in the center. It is useful to have a single cell instead of four or more in the center because large object tend to occupy the center of the image.
Figure 3.4.5: Input Output Encoding
In the output layer there are 5 components for each bounding box. Those are Center points of bounding box (Xi,Yi),height and width of bounding box(Hi,Wi) and Confidence. From the fig 3.4.5 we can see that we shrink the image into 416x416x3 and also divided the image into 13x 13 grid cells. Then we find out the best anchor box for each object from given candidate anchor boxes by the help of IOU. After finding the suitable anchor box for each object in each image then we calculate the center, height and weight of each bounding box, then convert those units into grid scale units.
Xi = 1/2(Xmin+Xmax) /32 Yi = 1/2(Ymin+Ymax) / 32 Hi = (Ymax-Ymin)/416 Wi = (Xmax-Xmin)/416
As a result the box dimensions and center are normalized to [0, 1]. The confidence define as Pr(Object) * IOU(pred, truth) . If no object exists in that cell, the confidence score is zero. Otherwise the confidence score is the intersection over union (IOU) between the predicted box and the ground truth.
3.5 Model Architecture
We use tiny YOLO architecture for training our dataset. Tiny YOLO architecture is smaller and less complicated then YOLO architecture. As a result tiny YOLO architecture return less accuracy then YOLO architecture. Convolutional neural network [8] layers are particularly well-suited for image recognition and feature extraction.
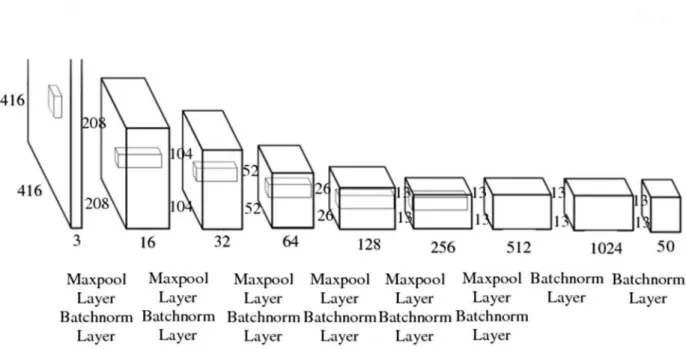
Figure 3.5.1: Tiny YOLO Model Architecture.
Yolo use single network for both classification and localization. From the fig 3.5.1 we can see that our model has 9 convolution layer and each convolution layer is assign with a maxpool layer and Batch norm layer. The model use Leaky Rectified Linear Unit as an activation Function. We use tesorflow [9] to create the model.
TABLE 3.5: Tiny YOLO model information.
Layer Description
Filter padding Stride Activation function
Output
Input - - - - (416 , 416,3)
Conv 3x3 1 1 Leaky Relu (416 , 416,16)
Maxpooling 2x2 0 2 - (208, 208,16)
Conv 3x3 1 1 Leaky Relu (208,208,32)
Maxpooling 2x2 0 2 - (104, 104,32)
Conv 3x3 1 1 Leaky Relu (104,104,64)
Maxpooling 2x2 0 2 - (52, 52,64)
Conv 3x3 1 1 Leaky Relu (52,52,128)
Maxpooling 2x2 0 2 - (26,26,128)
Conv 3x3 1 1 Leaky Relu (26,26,256)
Maxpooling 2x2 0 2 - (13,13,256)
Conv 3x3 1 1 Leaky Relu (13,13,512)
Maxpooling 2x2 0 1 - (13,13,512)
Conv 3x3 1 1 Leaky Relu (13,13,1024)
Maxpooling 2x2 1 1 - (13,13,1024)
Conv 1x1 0 1 Linear (13,13,50)
From the table 3.5 we can see that the output layer size is 13x13x50. Here 13 represent the grid number. Eachgrid cell is responsible to predict 5 bounding as well as class probabilities. The bounding box prediction has 5 components center_x, center_y, w, h and confidence. For the S x S grid cells with B bounding boxes and C classes the output layer will be
S x S x (B * (5+C))
13 x 13 x ( 5* (5+5)) [5 bounding boxes , 5 classes 13x13 grid cells]
13 x 13 x 50
3.6 Loss Function
The loss function of YOLO can be divided into three parts.
Classification loss
Localization loss
Confidence loss
Figure 3.6.1: Loss Function of YOLO
Fig 3.6.1 is the total loss function of YOLO where, S is the grid cell number.
B is the total bounding box number.
Xi , Yi are the center point of the bounding box.
Wi, Hi are the height and weight of the bounding box.
Ci, is the confidence score which indicates there is any object present or not.
Pi(C) indicates the classification loss.
Classification Loss
The classification loss at each cell is the squared error of the class conditional probabilities only for if there is any object otherwise the classification loss is Zero.
Localization Loss
The localization loss found the errors in the predicted boundary box. For the bounding box center points the losses are mean squared errors and for the height and width the losses are square root errors.
Confidence Loss
The confidence loss is the mean squared errors associated with the confidence score for each bounding box predictor.
CHAPTER 4
EXPERIMENTAL RESULTS AND DISCUSSION
4.1 Introduction
The idea of YOLO is to make a Convolutional neural network to predict a (13, 13, 50) tensor. In the training process we trained our model up to 500 epochs and average loss was found to be 0.92 for the batch size of 16.The average loss can be reduced by increasing the iteration in testing which will also increase the accuracy. Our aim is to get higher value of mean average precision and less localization error.
4.2 Experimental Results
Yolo framework divides each image into SxS grid cells. In our case the value of S is 13.Then both image classification and object localization are applied on each grid cell.
After that all the grid cells are checked and labeled to see if there is any objects in the cell. The grid cells that does not contain object is labeled as zero. Each grid cell predicts five bounding boxes. The label consists ten values.
The fig 4.2.1 shows two labeled values for one bounding box. The upper grid cell does not contain any object as a result the value of p is zero and the other values are not matter of concern .On the other hand the lower grid cell contains object so this time the value of p is one. X, Y are the center of bounding box and the w, h are the height and width of bounding box. The predicted class is assigned with 1 and other class assigned with zero. From the fig 4.2.1 we can see that almost 70 grid cells contain the betel leaf and we also said that each grid cell provides five bounding boxes. For this case almost 350 bounding boxes are generated. We have to select one appropriate bounding box for the betel leaf object by the help of Non-Max suppression. The first step is to eliminate the boxes which have lower probability. Probability scores can be calculated by multiplying P by the individual class probabilities C. Non-max suppression uses the concept intersection over union which takes two bounding boxes as input and calculates the ratio of the intersection and union of the two boxes.
Having defined the Intersection over union, non-max suppression works as follows:
Repeat Until no boxes to process:
• Select the box with highest probability of detection.
• Remove all the boxes with a high IOU with the selected box.
• Mark the selected box as “processed”
This filtration return only one bounding box for one object. It also helps to detect multiple objects in a picture.
4.3 Real Time Classification & Detection
Real life Classification and detection is one of our most desired goal. We monitored the result by feeding our model a video that contains herb images. Although the result was not optimistic, it did not disappoint either. We got a frame rate of 5-6 fps because of low computation power. Sadly the objects on the video could not detected as we expected. The herbs only could be detected when the position of camera and the amount of light and color matches the training data set. Another problem we faced is localization error.
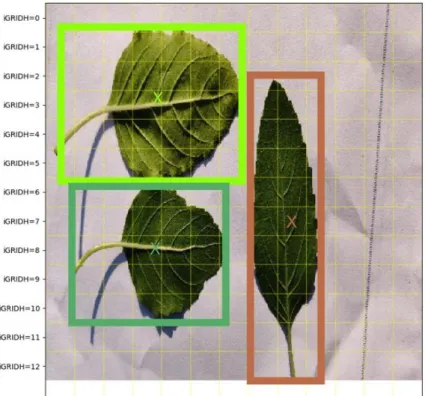
Figure 4.3.1: Localization Error.
Fig 4.3.1 shows the localization error. We can see from the figure that our trained model detected the object accurately but the position of bounding box is placed wrongly. The bounding box doesn’t cover the whole object. The reasons for getting localization error are selecting less number of anchor box and weak neural network model
4.4 Summary
The accuracy obtained on the test dataset is the primary evaluation metric for classification in our paper. Precision, Recall and overall Accuracy of the model are calculated by the help of confusion matrix. Figure 4.4.1 shows the confusion matrix where rows represent actual result on the other hand column represents the predicted result.
Fig: 4.4.1 Confusion Matrix
The accuracy obtained by methodology proposed in this paper was found to be 82.70%.
Precision, Recall, for each action class is presented in Table 4.4.
TABLE 4.4: Precision and Recall Values
Sr No Label precision Recall
1 Mehdi 70% 77.77%
2 Betel 88.89% 80%
3 Mint 81.81% 69.23%
4 Basil 85.71% 92.30%
5 Aloe Vera 87.5% 100%
Mean 82.78% 83.86%
CHAPTER 5
SUMMARY, CONCLUSION, RECOMMENDATION AND IMPLICATION FOR FUTURE RESEARCH
5.1 Summary of the Study
The field of computer vision is growing vastly. The progress in the computer vision sector in the recent years have been remarkable the least to say. Our approach in this research paper has resulted a positive output, though it is not a perfect model that could be applied to in real life. A lot of training data and training required to make the model usable. Developing the Neural Network architecture, sufficient training can be the appropriate solution for achieving higher accuracy.
5.2 Conclusions
The journey wasn’t easy and simple for us. We had faced so many challenges for bringing the possible positive result. Both of us had no prior knowledge about deep learning as well as YOLO. We spent most of our time by practicing the basic of deep learning. We learned how to use Tensorflow to implement the algorithm combined with neural network. Another major challenge for us was the computer hardware. The complexity of our model was quite complicated which required higher computational power to train. We spent significant amount of time trying to train the model as a result we didn’t have much time to reconstruct the model and increase the training data set. It is the matter of sorrow the final results do not match our expectations to the fullest but we did learn a lot in the process.
5.3 Recommendation
As we mentioned earlier we are completely new to this sector. In the beginning we had so many questions in our mind. We were confused about the methodology and research goal. After a tremendous amount of hard work and studying about deep learning and YOLO, we are at a point where we see the possibility to reach our research goal. To get a possible positive result for our research we went through a numerous number of challenges both in our study and implementation of our research work. A huge amount of guidance was needed to lead us towards to our research goal. Throughout our research, our supervisor Md Jueal Mia sir and our co-supervisor Shah Md. Tanvir Siddique sir have been massively supportive towards reaching our goal and guiding us through it.
5.4 Implication for Further Study
The main goal of computer vision is to teach machines to see and understand the world around as human can. A picture holds a large number of information which are used to classify the object in that picture. Classifying herbs can bring a tremendous amount contribution towards medical science. As much as we have seen the development in the field of computer vision with the introduction of deep learning, there are huge amount of problems that is yet to be solved to really achieve a higher accuracy for prediction.
There have been a significant amount of development in the field of Neural Network and deep learning with the introduction of technologies like Numpy, Tensorflow, Keras etc. The final outcome that we achieved can be improved by making some little tweaks in the model and increasing the training data. Then the trained model can be used to solve real life problem and also can be used to develop mobile application.
REFERENCES
[1] YOLO:Real Time Object Detection - Pjreddie, available at
https://pjreddie.com/darknet/yolov2/, last accessed on 07-05-2020 at 12:00 PM.
[2] Joseph Redmon and et al,“You Only Look Once: Unified, Real-Time Object Detection”, arXiv:1506.02640v5, May, 2016.
[3] Z. Husin and et al, " Embedded portable device for herb leaves recognition using image processing techniques and neural network algorithm", Elsevier, vol. 89, pp.18- 19,July 2012.
[4] Amala Sabu and et al,“Recognition of Ayurvedic Medicinal Plants from Leaves: A Computer Vision Approach,” ICIIP, vol. 518, pp. 574-578, Dec. 2017.
[5] Deep learning - Wikipedia. , available at https://en.wikipedia.org/wiki/Deep_learning, last accessed on 07-05-2020 at 12:00 PM.
[6] Object Detection using YOLOv2 - Yumi's Blog , available at
https://fairyonice.github.io/Part_1_Object_Detection_with_Yolo_for_VOC_2014_data _anchor_box_clustering.html, last accessed on 07-05-2020 at 12:00 PM.
[7] A Comprehensive Guide to Convolutional Neural Networks — the ELI5 way. , available at https://towardsdatascience.com/a-comprehensive-guide-to-convolutional-neural- networks-the-eli5-way-3bd2b1164a53, last accessed on 07-05-2020 at 12:00 PM..
[8] TensorFlow Core, available at https://www.tensorflow.org/tutorials, last accessed on 07-05-2020 at 12:00 PM.