DOI: 10.12928/TELKOMNIKA.v12i1.1168 6
A Review on Favourable Maximum Power Point
Tracking Systems in Solar Energy Application
Awang Jusoh*1, Tole Sutikno2, Tan Kar Guan3, Saad Mekhilef4 1,3
Department of Electrical Power, Faculty of Electrical Engineering, Universiti Teknologi Malaysia 81310 Skudai, Johor, Malaysia
2
Department of Electrical Engineering, Faculty of Industrial Technology, Universitas Ahmad Dahlan, Yogyakarta 55164, Indonesia
4
Department of Electrical Engineering, Faculty of Engineering Building, University of Malaya 50603 Kuala Lumpur, Malaysia
*Corresponding author, e-mail: [email protected]
Abstract
This paper reviews different types of maximum power point tracking (MPPT) techniques for solar photovoltaic (PV) application. Since the PV output power is known affected by sun radiation and temperature, it is necessary to search for an effective method for extracting maximum amount of power from PV cell/modules. In this study, a total of seven control algorithms were selected, comprising the most popular methods among the established techniques. A comparison in terms of convergence speed, complexity, as well as the basic concept of each method had been carried out for future reference. Based on the accessible simulation results, modified Perturb and Observe (P&O) method had shown its effectiveness for obtaining actual maximum power point while solving major drawbacks of the conventional P&O. This paper also discusses typical solar MPPT system, including the pros and cons of each part of the system.
Keywords: maximum power point tracking, perturb and observe algorithm, solar energy, solar photovoltaic
Nomenclatures
MPPT Maximum Power Point Tracking MPP Maximum Power Point STD Standard Test Condition PV Photovoltaic
P&O Perturbation and Observation HC Hill Climbing
INC Incremental Conductance RCC Ripple Correlation Control Iph Light generated current (A) IRS Diode saturation current q Electron charge = 1.6 x 10⁻¹⁹ C Eg Band gap energy (1.12eV for
polycrystalline)
A Ideality factor (1.3 for polycrystalline) Rs Internal series resistance (ohm) Rsh Shunt resistance (ohm) Isc Short circuit current (A)
λ Solar radiation (kW/m2)
Ki Cell’s short circuit temperature coefficient D Duty Cycle
Voc Open Circuit Voltage (V)
1. Introduction
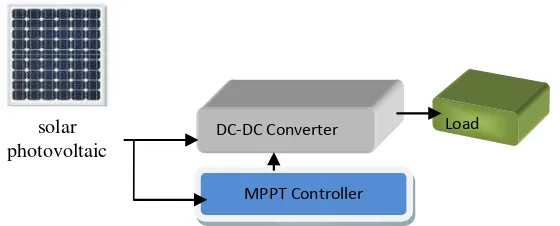
depicts the basic block diagram of the solar system with the aid of Maximum Power Point Tracking (MPPT) algorithm.
Figure 1. Block diagram of PV system with MPPT
The main weaknesses of the solar generation system are that the installation cost is notably high due to expensive photovoltaic manufacturing process and the energy conversion efficiency is relatively low [6,7]. Thus, MPPT algorithm is crucial in order to track the optimum operating point or maximum peak power that can be extracted from the PV array. There are a lot of published literatures and papers related to solar MPPT techniques. Reference [8] reviewed 19 distinct MPPT algorithms and proposed a comparison between two methods. Similarly, V. Salas [9] reviewed the state of art MPPT algorithms and successfully divided the MPPT methods into indirect and direct methods. Reference [10] had carried out some comparisons between conventional P&O, Incremental Conductance (INC), hill climbing and modified P&O method, and concluded that modified P&O technique can provide more dynamic response than the other three techniques. Studies made by [11-14] about adaptive or optimization of P&O method also have been proposed, since it is relatively easy to understand if compared with other artificial techniques, for example fuzzy logic control and neural network. Research papers made by [15-18] about other MPPT algorithms had been reviewed as well. The comparison table is included in this paper for further discussion. Since there is a trend of solar MPPT research in the past decade as proven by [8], a new and improved MPPT techniques need to be reviewed and gathered. In this manuscript, optimal choice on PV cell modelling and DC-DC converter selection is briefly recommended for future reference on solar MPPT. To author’s knowledge, there is an imperfect peer-reviewed literature on solar MPPT techniques. This paper aims to present a revision on the fundamental concept of each MPPT algorithm.
2. Overview on Solar PV and DC/DC Converter
Solar photovoltaic (PV) cell is made up of semiconductor or silicon diode which operates according to photoelectric effect. Photoelectric effect can be defined as the phenomenon in which electromagnetic radiation is converted into electrical energy. Solar PV cell mainly consists of two layers of semiconductor materials, which are separated by a p-n junction. When the electron and proton in the materials absorb enough solar energy level, band gap energy will be surmounted and the electron will move freely across the p-n junction. The direction of the electron’s movement is fixed due to the existence of electric field between two metallic contacts. By connecting the metallic conductor at the top and bottom of a load, the flow of electron will energize the external load in terms of current and voltage [19]. Basically, there are three types of semiconductor materials, which are mono-crystalline silicon, poly-crystalline silicon and amorphous silicon, which are common for commercial use. Ideally, manufacturing cost and cell efficiency are the primary considerations for judgement purposes when choosing semiconductor materials. Among all types of materials, mono-crystalline is the most reliable one since it is constructed using pure melted silicon with desirable compound and physical properties. However, due to difficulty in manufacturing process, mono-crystalline costs slightly higher than other materials. In order to overcome this problem, poly-crystalline and amorphous
DC‐DC Converter
MPPT Controller
Load solar
silicon have been proposed to replace mono-crystalline. Even though the efficiency of the mentioned materials is not as high as efficiency of mono-crystalline cell, their low fabrication cost with acceptable efficiency is ideal for commercial use [20].
In typical solar MPPT system, switching DC-DC converter is the mandatory element for tuning the PV output power towards its maximum peak level, by changing the duty cycle, D. Among the DC-DC converters, Buck converter and Boost converter are the most popular circuit, which are widely used in solar MPPT system because they are inexpensive and relatively simple compared to the Buck-boost and Cuk converter. For MPPT application, Boost converter is more favourable than Buck converter because most of the solar PV array output voltage would be lower than the required voltage at external load. Moreover, in Buck converter, the switching component is placed at the input side and series with input voltage, which will discontinue the current flow within the system. This will definitely result in energy losses during the power generation process. Hence, Boost converter provides greater benefit in terms of cost saving and higher efficiency. [21-25] provides detailed research on the selection of DC-DC converter in MPPT system.
3. Photovoltaic Cell Modelling
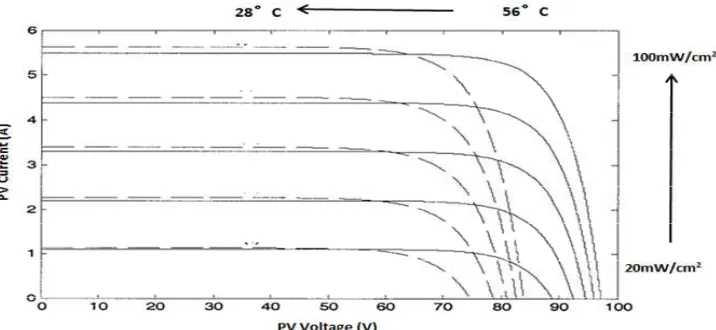
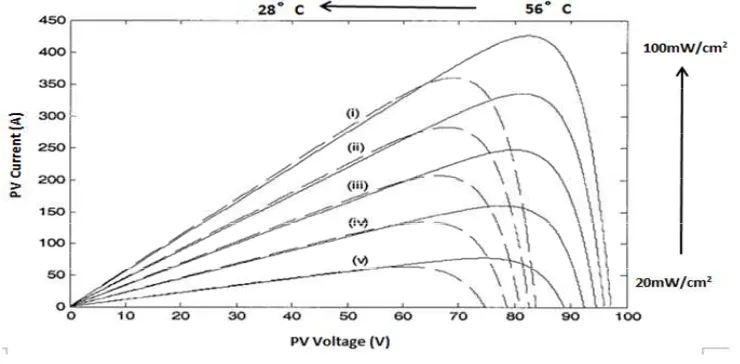
Figure 2 and 3 show the output characteristic of a particular solar cell at different cell temperature and solar insolation, denoted as I-V and P-V curves. The figures show that the nonlinear characteristic of PV cell is greatly influenced by sun irradiation and temperature. Maximum peak operating points (Pmpp, Impp and Vmpp) are the desired parameters that need to be tracked all the time by using MPPT system.
Figure 2 depicts the relationship between sun irradiation and temperature towards I-V curves. It can be concluded that sun irradiation has significant impacts on PV current. Thus, as the sun irradiation decreases, the PV photo current decreases considerably, and hence, maximum PV module power will be reduced since P=IV.
Figure 2. I-V Curves of Different Temperature and Sun Irradiation
Figure 3 describes the effect of cell temperature and irradiance towards P-V curves. In contrast to the influence of sun irradiance, the cell temperature significantly affects the PV voltage. The temperature is inversely proportional to the PV voltage, at which the increment of temperature will eventually reduce the level of PV output voltage, as well as the maximum power point.
equation is too complicated to be implemented. For the simplified model, it neglects the existence of shunt resistance due to the insensitivity of shunt resistance towards PV efficiency, making the mathematical equation more feasible. Still, the single diode model provides a good balance between simplicity and accuracy. Reference [26] proposed detailed analysis and equations in order to determine the value of each component.
Figure 3. P-V Curves of Different Temperature and Sun Irradiation
Figure 4. Single Diode Model Figure 5. Double Diode Model
The characteristic equations of single diode model are mentioned below:
Ipv = Iph – Is[e(q(Vpv + IRS)/kTcA) – 1] – (Vpv + IRS) / Rsh (1)
Iph = [Isc + Ki (Tc – Tref)]λ (2)
Is = IRS(Tc / Tref)3. e[qEg(1/Tref – 1/Tc)/kA] (3)
IRS = Isc / [e(qVoc / NskATc) – 1] (4)
Usually, the data sheet of PV module or array provides some of the parameters such as open circuit voltage, short circuit current, temperature coefficient and others with respect to the Standard Test Condition (STD), which require 1000W/m2 irradiation and 25 degree Celsius of temperature.
4. Solar MPPT Techniques
4.1. Perturb and Observe (P&O)/Hill Climbing (HC)
Among all MPPT systems, Perturbation and Observation (P&O) and Hill Climbing (HC) methods are the most popular techniques to find the true MPP [11,13, 28-30]. The major benefits of these techniques include relatively simple and easy to understand compared to artificial techniques, realizable in practical application, able to be used even without prior knowledge on PV cell’s characteristics, and it can adapt well in microcontroller or Digital Signal Processing system. In some references, P&O is also referred as Hill Climbing method because it uses the same concept in perturbing MPP. In fact, the only difference between them is the output control variable, in which P&O produces the change from the reference voltage to the power converter while HC produces the change from the duty cycle. The performance and comparison between these two methods had been carried out by [15], who concluded that the transient response of P&O is better than HC. The comparison between P&O with other methods also had been carried out by [31-35].
Figure 7. Operation Principle of P&O in P-V Curve
Principally, the operation of P&O or hill climbing technique is fully based on the perturbation or shifting of solar PV operation point according to the sign of the last increment of PV power. In Figure 7, it clearly shows that perturbation to the right is necessary when the operating the point at the left hand side and vice versa. For example, if there is an increment of power, the following perturbation needs to be kept in the same direction. Otherwise, reverse perturbation direction should be conducted if there is a decrease in output power [29].
Therefore, perturbation and observation processes need to keep going all the time because the efficiency relies on the data sampling frequency. Regarding the aforementioned statement, two critical weaknesses of the P&O method are revealed. Firstly, the system oscillating around the MPP will cause loss of energy. Secondly, it will not be able to track the maximum point during fast changing of weather condition. In order to reduce the oscillation at the power peak, small step size of reference voltage or duty cycle needs to be chosen precisely. However, in the meantime, it consequently slows down the transient response of the system, or more commonly known as convergence speed. The trade-off between these two factors has always become a dilemma to system designers. Reference [8] studied the problem of P&O during rapid variation of the surrounding condition, whereby the system’s operating point will keep moving in the wrong direction if the irradiation is varied only within the sampling period. Two types of control variables, which are reference voltage and direct duty cycle control had been analysed by [28], who also made comparison in terms of stability, performance and efficiency.
concept, the size of each step automatically changes based on the position of the operating point. If the operating point is located far from the MPP, larger step size will be used and the size gradually decreases when it gets nearer to the peak point. Finally, the step size will reduce near to zero at the MPP, so that the fixed point can be obtained without oscillation, fast dynamic response is guaranteed while at the same time. The flow chart in Figure 8 illustrates the basic concept of variable step size. ∆M as mentioned in Figure 8 is varied continuously in each perturbation process. In the study made by [38], fuzzy logic control method had been adapted into P&O by dividing P-V curve into three parts, which are large, medium and small region, in order to determine the change of step size in each category. Similarly, sliding mode control had been used in studies by [18,39] due to its simplicity and robustness. Sliding mode control mainly deals with the state feedback control scheme that functions as a tool for compensating the output error by providing suitable level of control signal. From the control signal, the phase angle can be adjusted to vary the triggering sequence in PWM generator. Furthermore, the simulation and comparison carried out in the study by [32] have proven the promising performance of modified P&O over fixed step size HC/P&O.
Figure 8. Example of flow chart of variable step size P&O
Different kinds of adaptive control methods have been proposed, either in terms of duty cycle [11, 40,41] or reference voltage [13,20]. In order to ensure appropriate changes in step size at different locations, different types of control equation have been suggested. For example, perturbation size can be obtained through reference voltage with exponential function, as shown in Equation (5) and (6), and the improvement in efficiency has been proven through simulation and experiment in studies by [13]. Other than that, in studies by [37,40], optimum reference current was used as the control variable instead of reference voltage.
∆V = f (Vm – V) + ∆Vmin (5)
According to [11,42], the optimized P&O method utilizes the duty cycle perturbation function, as shown in (7), in which sampling period Ta needs to be carefully identified so that the system can cope with the rapid variation of weather condition.
d((k + 1)Ta) = d(kTa) + (d(kTa) – d((k – 1)Ta)) (7)
In the study by [12], modified hill climbing method had been proposed and the step size of duty cycle can be determined through the ratio of power variation with respect to the change of duty cycle as in (8):
d(k + 1) = d(k) + α(∆P(k) / ∆D(k)) (8)
Reference [10] proposed the voltage hold optimization of P&O method; an additional stage of decision to determine the changes of irradiance level, where the output PV voltage will be put on hold until the variation stops to prevent wrong tracking direction. When getting near to the MPP, the step size will be gradually decrease by dividing the old step size with a fixed constant value. Furthermore, as reported by [8,28] three points weight of P&O method and two stage algorithm are another options to avoid failing during rapid variation of irradiation.
Besides variable step size, instantaneous sampling and peak current control methods that rely on the change in reference current had been proposed by [36,43], for use to find a trade-off between the weaknesses of P&O system.
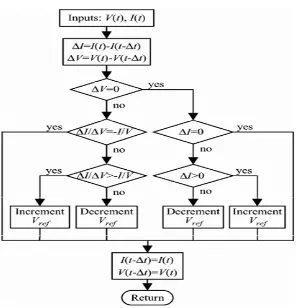
4.2. Incremental Conductance (INC)
Incremental Conductance (INC) method utilizes the fundamental concept of hill climbing, in which the slope of P-V curve will be zero at the MPP, positive at the left side and negative at the right side of the curve, as shown in Figure 7. From this concept, the relationship between current and voltage can be derived by using Equation (9) below:
dP/dV = d(I*V)/dV = I + V*(dI/dV) (9)
When MPP is reached, the slope dP/dV = 0. Then, the state would be as in (10);
dI/dV = -I/V (10)
The maximum power point can be determined by comparing the instantaneous conductance with the incremental conductance according to Equation (10).
The MPP is attained when both conductance are found equal. The flow chart as illustrated in Figure 9 depicts the procedure to track the MPP by using reference voltage, and in theory, the MPP will maintain constant without oscillation until the current changes. The change of current indicates the change in irradiation level. This method is therefore capable to track the MPP during rapid variation of sun irradiation.
Figure 9. Example of flow chart of INC
4.3. Fuzzy Logic Control (FLC)
Artificial controlling method has been widely applied in solar MPPT application nowadays, and fuzzy logic control is the most popular method among them. The trend of this method is mainly due to the invention of microcontroller, in which complicated coding and algorithm can be easily programmed and implemented. Low cost microcontrollers, such as Atmega8 and digital signal processor or FPGA have been proven functional in the concept of fuzzy logic control, as reported by [8,45,46].
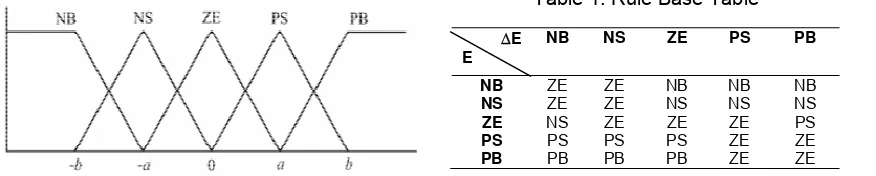
Fuzzy logic control is mainly comprised of three stages, which are fuzzification, fuzzy rule base table and defuzzification. In the fuzzification stage, the main purpose is to transform the numerical variables into linguistic fuzzy set notation. By using membership function as illustrated in Figure 10, the level or the range of each linguistic label can be determined. The accuracy of fuzzy logic is greatly influenced by the number of membership function, where with greater number of membership functions, the higher the controller accuracy will get. Normally, the range of membership functions is between 5 to 7 [8, 16,20,47]. The example of five fuzzy level is depicted in Figure 10: NB (negative big), NS (negative small), ZE (zero), PS (positive small), and PB (positive big). The variables a, b are the values that are covered by each of the membership function. Some membership functions are made less symmetric to prioritize and optimize the particular fuzzy level. For example reference [8] proposed denser function in the middle in order to improve the sensitivity of PV voltage at the MPP.
In solar MPPT system, the usual inputs of fuzzy controller are error, E and the change of error, ∆E. However, the selection of error fully depends on the designer’s knowledge on the types of application he or she works on and for solar PV system, most will choose the slope of P-V curve, dP/dV as the error equation since zero value will be obtained at MPP. Equation (11) and (12) depict the error and the change of error. In some literatures like [20], dP and dV were chosen as the inputs of the controller.
∆E(k) = E(k) – E(k-1) (12)
Figure 10. Membership Function of FLC
Table 1. Rule Base Table
The output of fuzzy logic controller is duty cycle, which is used to drive the dc-dc converter or the change in reference voltage. Therefore, at the second stage, rule base table needs to be created based on the combination of both inputs. Different kinds of combination will result in different linguistic outcome, which are dependent on the types of converter being used and the depth of designer’s knowledge. Table 1 presents a sample of rule base table of boost converter, in which the output is the change of reference voltage. For example, if the operating point is far to the right of the MPP, as seen in Equation (11), the error, E is NB. In the meantime, if the change of error, ∆E is PB, this means the system is perturbed further away to the right of the MPP. Thus, the controller needs to output negative duty cycle, NB so that the operating point moves to the left direction to approach MPP. This methods is basically based on the hill-climbing concept.
In the last process, which is the defuzzification stage, the linguistic variables are converted into numerical values, as can be seen in Figure 10, in order to identify the changes of duty cycle or the reference voltage. The most popular method of defuzzification is Centre of Gravity (COG), with the mathematic expression proposed by [16,45] as depicted in Equation (13).
∆D = [ΣY(k) * F(k)] / ΣY(k) (13)
where Y(k) is the weighting factor, F(k) is the multiplying coefficient based on membership function, while ∆D is the change of duty cycle.
The main advantages of fuzzy logic control include the ability of handling non-linearity and imprecise input. Besides that, the method requires accurate input signal and it is capable of accepting noisy signal. As reported by [46,47], fast convergence speed and robust performance of fuzzy logic have been proven during sudden change of surrounding condition. However, as stated by [8,20], both manuscripts agreed that this method highly depends on the understanding of the user on the concept of the application so that the suitable error equation and rule base table can be determined. Apart from that, [2,3] had utilized the Takagi-Sugeno (T-S) fuzzy model that can further improve the robustness and stability of traditional fuzzy logic control.
4.4. Neural Network (NN)
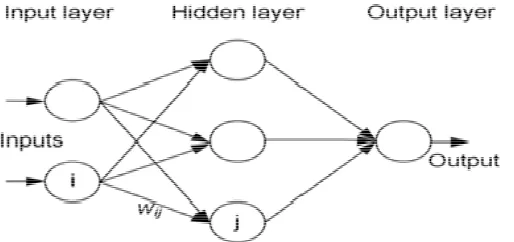
Besides fuzzy logic control, neural network is another method that suits the operation of microcontroller and digital signal processor, where the majority are software programming based devices. Both methods need great software familiarity and knowledge to ensure the system performs as desired.
Apart from the number of hidden layer as mentioned previously, another important factor that contributes to the system accuracy is the training given. Since each of the PV array has different characteristics, thus, training has to be given so that the system can precisely represent the particular PV array.
Figure 11. Fundamental of Neural Network
Along the training process, the form of the input and output will be observed and recorded from time to time, in which the duration could be a few months or even a year. From the outcome of the training, the weight of each link for example, can be accurately identified.
Reference [48]proposed a multi-level neuro-fuzzy model for MPPT, which comprises of fuzzy logic controller and three multi-levels feed forward neural network. The system has been proven capable of yielding higher efficiency and representing complex and nonlinear behaviour of PV array under wide range of operation circumstance, compared to conventional neural network algorithm.
However, the main disadvantage of neural network is unavoidable, where the system needs to be periodically trained to ensure highest accuracy since the PV array’s characteristic will vary with time.
4.5. Fractional Open Circuit Voltage (Voc)
Fractional open circuit voltage method, also known as constant voltage technique, provides the simplest way to implement MPPT circuit and find the maximum power point. This method utilizes the linear relationship between Vmpp and Voc as in equation (14),
Vmpp = K1 * Voc (14)
where K1 is the proportional constant. The value of proportionality constant varies according to the types of PV array being used, temperature and also irradiance [31,49]. In studies by [50,51], the suggested value of K1 was between 0.71 to 0.78. The value of K1 can also be obtained through the information given in PV array’s data sheet by observing the maximum voltage under load. According to the study by [31], 0.76 was selected as the value of K1 and reference [43] had reported that the value could range from 0.73 to 0.8.
small solar cell instead of large solar array, therefore, the characteristic curves that represented the solar array under test could be obtained. However, in reality, every pilot cell needs to be regulated so that it matches with the solar array, and this will surely increase the cost of the system.
A number of researches had been carried out using this method, and it was found that the constant K1 is often invalid during partial shading condition. Regarding this issue, sweeping on PV voltage can be implemented but it will definitely increase the complexity and system’s cost [20].
4.6. Fractional Short Circuit Current (Isc)
Fractional Short Circuit Current method uses the same concept with the constant voltage technique mentioned previously, using a linear relationship between PV short circuit current, Isc and Impp, as shown in Equation (15),
Impp = K2 * Isc (15)
K2 is the proportionality constant in which the value lies between 0.78 to 0.92, as reported by [20]. Compared with fractional Voc method, this technique is more troublesome because the solar PV array needs to be shorted periodically using additional switches to obtain Isc. Normally, boost converter is used instead because the switching elements in the power converter itself can act as the switch to shorten the circuit. Another similar limitation of this method, along with fractional Voc method, is that both methods are unable to track the real MPP due to the approximation based on Equation (15). Furthermore, once the PV array is being contaminated or partially shaded, the constant K2 will be varied as well. Hence, [8,20] proposed the PV voltage sweeping process to obtain real MPP but eventually, it will complicate the system and increase the overall cost.
4.7. Ripple Correlation Control (RCC)
Ripple Correlation Control (RCC) is another method that applies the hill climbing concept. It focuses on the utilization of PV ripple voltage or ripple current to determine the location of MPP. As stated in [8,20], DC-DC power converter will somehow induce a specific ripple into the PV module voltage or current. This method correlates the time-varying power with time-varying voltage or current to move the point towards MPP, as shown in Equation (16).
d(t) = -k3ʃ (dP)*(dV) dt (16)
d(t) = k3ʃ (dP)*(dI) dt (17)
Basically, the equations used for RCC techniques are related to the derivative and integration of time-varying power with current or voltage. Equation (16) and (17) present the common RCC equation to obtain duty cycle. The k in the equations is a positive constant.
Reference [17] suggested the use of correlation technique between ripple power and load impedance to calculate the duty cycle value. The relationship between load impedance and optimal impedance had been analysed in the literature and the duty ratio can be obtained through Equation (18).
D = k ʃ [dP/dt]*[dz/dt] dt (18)
5. Review Results, Discussions and Comparison
The comparison on four types of MPPT system (P&O, INC, Hill Climbing and Modified P&O) performance from [10] is shown in Figure 16. The basic block diagram of simulation is shown in Figure 12, produced by using MATLAB Simulink.
In this study, the power converter used was boost converter and the initial step size or change of reference voltage was set at 0.5V. Two types of input irradiation level (step change and ramp variation) were tested through conventional P&O and modified P&O (or voltage hold method considered in the literature) while assuming that temperature was constant. Figure 13 depicts the step changing response from 200W/m2 to 1000W/m2 at 0.3s and irradiation dropping at 0.6s from 1000W/m2 to 500W/m2. The result is shown in Figure 14, in which it can be clearly seen that steady state oscillation was reduced significantly in modified P&O.
Figure 12. Basic block diagram in Simulink
Figure 14. Result from conventional P&O and Modified P&O
Figure 15. Ramp irradiation signal
In the next experiment, the ramp signal from 200W/m2 to 1000W/m2, as shown in Figure 15, was injected and the result was presented in 3D form, as shown in Figure 16. Referring to the outcomes, the modified P&O was concluded as the most promising method because of its fast convergence speed and small power fluctuation compared to other hill climbing methods. On the other hand, hill climbing technique produced the worst result with the highest power oscillation obtained when the irradiation level varied in a ramp manner. Moreover, the response of conventional P&O was found to be the same as Incremental Conductance (INC) from the findings in previous review literatures. Apart from the evaluation among hill climbing methods, comparison between the modified P&O/INC with Fuzzy Logic Control (FLC) method had also been presented by [20].
Table 2. Dynamic Efficiency of Modified P&O, INC and FLC
Slope (W/m2/s) Dynamic Efficiency (%)
Modified P&O Modified INC Fuzzy Logic Control
10 99.51 99.51 99.51 20 99.50 99.50 99.50 50 99.48 99.48 99.47
100 99.46 99.46 99.43
overall performance of each technique was acceptable due to high efficiency. However, the dynamic efficiency of fuzzy logic control was slightly less than the other two modified methods, especially when the slope of irradiation increased. Besides that, as stated by [20], the fuzzy logic control provides unsatisfactory tracking if the slope is small. Here, it might be due to the difficulties of FLC to detect small changes in irradiance and tended to maintain the voltage constant.
Reference [8] also emphasized that the effectiveness of the FLC is dependent on the competency of the designer in choosing and tuning the suitable error and member’s functions. Plus, there is still no available guideline in determining the functions of FLC like modified P&O or INC. Next, though modified P&O and modified INC methods were expected to produce comparable results, both techniques provided almost the same result. Hence, hardware and processing complexity are the factors that can be used to identify the choice between P&O and INC. Since INC requires accurate current sensing and complex slope calculation, modified P&O is more preferable in most applications.
Lastly, Table 3 provides a comparison between seven favourable MPPT methods in the aspect of complexity, convergence speed and others for future research use and development purposes. Still, there are a lot more MPPT techniques available nowadays, such as differential equation, cascade boost converter method, current sweep, DC link capacitor droop control and others which ought to be explored [8,52-54].
Table 3. Characteristics of Various MPPT Techniques
5. Conclusion
This paper reviews and deliberates several popular MPPT techniques for solar PV system. Besides that, this paper presents the simulation and evaluation on four selected control algorithms in terms of convergence speed, steady state error and efficiency. The simulation outcome illustrates the dominance and advantages of modified P&O over other methods. This technique is capable to obtain real MPP and at the same time, it provides an accurate result under step and ramp irradiation condition. In addition, variable step size of P&O has been proven useful to compensate the drawbacks of conventional P&O method effectively in increasing the transient response and reducing steady state oscillation. However, it is unavoidable that this method might be influenced by partial shading effect. Apart from that, fuzzy logic control is effective in handling non-linearity condition and robust due to artificial operation concept. The result obtained from this method can be significant and promising if the designer is adept to include all desired requirements and specifications into the design. This paper also reviews and briefly discusses the other components in solar MPPT circuit for future research purposes. Lastly, the author hopes that some combinations of existing techniques or a brand new method can be proposed in the future to boost the effectiveness and efficiency of solar MPPT system to a higher level.
References
[1] Hua Chihchiang, Lin Jongrong, Shen Chihming. Implementation of a DSP-Controlled Photovoltaic System with Peak Power Tracking. IEEE Transactions on Industrial Electronics. 1998; 45: 99-107. [2] Chiu Chian-Song. T-S Fuzzy Maximum Power Point Tracking Control of Solar Power Generation
Systems. IEEE Transactions on Energy Conversion. 2010; 25: 1123-32.
[3] Chiu Chian-Song, Ouyang Ya-Lun. Robust Maximum Power Tracking Control of Uncertain Photovoltaic Systems: A Unified T-S Fuzzy Model-Based Approach. IEEE Transactions on Control Systems Technology. 2011; 19: 1516-26.
[4] A. Johari, S. S. Hafshar, M. Ramli, H. Hashim. Potential Use of Solar Photovoltaic in Peninsular Malaysia. 2011 IEEE First Conference on Clean Energy and Technology (CET). 2011: 110-114. [5] A. Y. Azman, A. A. Rahman, N. A. Bakar, F. Hanaffi, and A. Khamis. Study of Renewable Energy
Potential in Malaysia. 2011 IEEE First Conference on Clean Energy and Technology (CET). 2011: 170-76.
[6] Hoe Choo Kian, A. C. Vaithlingam, R. Teymourzadeh, R. Rajkumar. Design of Automatic Soil Humidity Control Using Maximum Power Point Tracking Controller. 2010 IEEE Student Conference on Research and Development (SCOReD). 2010: 387-391.
[7] H. L. Tsai, C. S. Tu, Y. J. Su. Development of Generalized Photovoltaic Model Using
MATLAB/SIMULINK. Proceedings of the World Congress on Engineering and Computer Science (WCECS). October 22 - 24, 2008.San Francisco, USA.
MPPT Methods P&O/Hill
Convergence Speed Varies Varies Fast Fast Medium Medium Fast Need specific
knowledge?
No No Yes Yes No No Yes
Complexity Simple Medium Complex Complex Simple Medium Complex
Dependency of PV Array
No No Yes Yes Yes Yes No
Accuracy Accurate Accurate Accurate Accurate Less accurate
Digital Digital Digital Analogue and Digital
[8] T. Esram, P.L. Chapman. Comparison of Photovoltaic Array Maximum Power Point Tracking Techniques. IEEE Transactions on Energy Conversion. 2007; 22(2): 439-449
[9] V. Salas, E. Olías, A. Barrado, and A. Lázaro. Review of the Maximum Power Point Tracking Algorithms for Stand-Alone Photovoltaic Systems. Solar Energy Materials and Solar Cells. 2006; 90: 1555-1578
[10] I. Abdalla, L. Zhang, and J. Corda. Voltage-Hold Perturbation &Amp; Observation Maximum Power Point Tracking Algorithm (Vh-P&O MPPT) for Improved Tracking over the Transient Atmospheric Changes. Proceedings of the 2011-14th European Conference on in Power Electronics and Applications. 2011: 1-10.
[11] N. Femia, G. Petrone, G. Spagnuolo, and M. Vitelli. Optimizing Sampling Rate of P&O Mppt Technique. IEEE 35th Annual in Power Electronics Specialists Conference (PESC 04). 2004; 3: 1945-1949
[12] Xiao Weidong, W. G. Dunford. A Modified Adaptive Hill Climbing Mppt Method for Photovoltaic Power Systems. IEEE 35th Annual in Power Electronics Specialists Conference (PESC 04). 2004; 3: 1957-1963.
13] L. Piegari, R. Rizzo. Adaptive Perturb and Observe Algorithm for Photovoltaic Maximum Power Point Tracking. IET Renewable Power Generation. 2010; 4: 317-28.
[14] A. Thenkani, N. Senthil Kumar. Design of Optimum Maximum Power Point Tracking Algorithm for Solar Panel. 2011 International Conference on Computer, Communication and Electrical Technology (ICCCET). 2011: 370-75.
[15] Liu Fangrui, Kang Yong, Zhang Yu, Duan Shanxu. Comparison of P&O and Hill Climbing MPPT Methods for Grid-Connected PV Converter. 3rd IEEE Conference on in Industrial Electronics and Applications (ICIEA 2008). 2008: 804-07.
[16] Li Jiyong, and Wang Honghua. Maximum Power Point Tracking of Photovoltaic Generation Based on the Fuzzy Control Method. International Conference on Sustainable Power Generation and Supply (SUPERGEN '09). 2009: 1-6.
[17] M. Rafiei, M. Abdolmaleki, and A. H. Mehrabi. A New Method of Maximum Power Point Tracking (MPPT) of Photovoltaic (PV) Cells using Impedance Adaption by Ripple Correlation Control (RCC). 2012 Proceedings of 17th Conference on in Electrical Power Distribution Networks (EPDC). 2012: 1-8.
[18] Chian-Song Chiu, Ya-Lun Ouyang, Chan-Yu Ku. Terminal Sliding Mode Control for Maximum Power Point Tracking of Photovoltaic Power Generation Systems. Solar Energy. 2012; 86: 2986-2995. [19] S. Narkhede, Rajpritam. Modelling of Photovoltaic Array [Degree’s Thesis]. Rourkela National Institute
of Technology. Department of Electrical Engineering. 2008.
[20] D.S. Morales. Maximum Power Point Tracking Algorithms for Photovoltaic Applications [Master’s Thesis]. Aalto University, Faculty of Electronics, Communications and Automation. 2010.
[21] Housheng Zhang, Suling Li, and Haidong Li. Maximum Power Point Tracker for Solar Cells Based on Boost Converter. 2010 2nd International Conference on Computer Engineering and Technology (ICCET). 2010: V4-665-V4-68.
[22] A. Durgadevi, S. Arulselvi, S. P. Natarajan. Study and Implementation of Maximum Power Point Tracking (MPPT) Algorithm for Photovoltaic Systems. 2011 1st International Conference on Electrical Energy Systems (ICEES). 2011: 240-245.
[23] R. F. Coelho, F. Concer, and D. C. Martins. A Study of the Basic DC-DC Converters Applied in Maximum Power Point Tracking. Power Electronics Conference 2009 (COBEP '09). Brazilian. 2009: 673-78.
[24] Hua Chihchiang, Lin Jongrong, Shen Chihming. Implementation of a Dsp-Controlled Photovoltaic System with Peak Power Tracking. IEEE Transactions on Industrial Electronics. 1998; 45: 99-107. [25] K. A. Kim, and P. T. Krein. Photovoltaic Converter Module Configurations for Maximum Power Point
Operation. Power and Energy Conference at Illinois (PECI 2010). 2010: 77-82.
[26] J. A. Gow, C. D. Manning. Development of a Photovoltaic Array Model for Use in Power-Electronics Simulation Studies. IEE Proceedings - Electric Power Applications. 1999; 146(2): 193-200.
[27] M. G. Villalva, J. R. Gazoli, E. R. Filho. Comprehensive Approach to Modeling and Simulation of Photovoltaic Arrays. IEEE Transactions on Power Electronics, Power Electronics. 2009; 24: 1198-1208.
[28] M. A. Elgendy, B. Zahawi, D. J. Atkinson. Assessment of Perturb and Observe Mppt Algorithm Implementation Techniques for PV Pumping Applications. IEEE Transactions on Sustainable Energy.
2012; 3: 21-33.
[29] Nabil Karami, Nazih Moubayed, Rachid Outbib. Analysis and Implementation of an Adaptative PV Based Battery Floating Charger. Solar Energy. 2012; 86: 2383-2396.
[30] F. Boico, and B. Lehman. Multiple-Input Maximum Power Point Tracking Algorithm for Solar Panels with Reduced Sensing Circuitry for Portable Applications. Solar Energy. 2012; 86: 463-475.
[32] S. Jain, and V. Agarwal. Comparison of the Performance of Maximum Power Point Tracking Schemes Applied to Single-Stage Grid-Connected Photovoltaic Systems. IET Electric Power Applications. 2007; 1: 753-762.
[33] S. Bal, B. C. Babu. Comparative Study between P&O and Current Compensation Method for MPPT of PV Energy System. 2012 Students Conference on Engineering and Systems (SCES). 2012: 1-6. [34] K. H. Hussein, I. Muta, T. Hoshino, and M. Osakada. Maximum Photovoltaic Power Tracking: An
Algorithm for Rapidly Changing Atmospheric Conditions. IEE Proceedings- Generation, Transmission and Distribution. 1995; 142: 59-64.
[35] V. T. Buyukdegirmenci, A. M. Bazzi, P. T. Krein. A Comparative Study of an Exponential Adaptive Perturb and Observe Algorithm and Ripple Correlation Control for Real-Time Optimization. 2010 IEEE 12th Workshop on Control and Modeling for Power Electronics (COMPEL). 2010: 1-8.
[36] Dorin Petreuş, Toma Pătărău, Stefan Dărăban, Cristina Morel, Brian Morley. A Novel Maximum Power Point Tracker Based on Analog and Digital Control Loops. Solar Energy. 2011; 85: 588-600. [37]N. Mutoh, M. Ohno, T. Inoue, 'A Method for MPPT Control While Searching for Parameters
Corresponding to Weather Conditions for PV Generation Systems. IEEE Transactions on Industrial Electronics. 2006; 53: 1055-65.
[38] Ahmad Al Nabulsi, R. Dhaouadi. Efficiency Optimization of a DSP-Based Standalone PV System Fuzzy Logic and Dual-MPPT Control. IEEE Transactions on Industrial Informatics. 2012; 8(3): 573 - 584.
[39] Mohamed A. El-Sayed, Osama A. Al-Naseem. Efficient Utilization of Photovoltaic Energy for Supplying of Remote Electric Loads. Proceedings of 2011 46th International Universities' Power Engineering Conference (UPEC). 2011: 1-5.
[40] E. M. Ahmed, and M. Shoyama. Highly Efficient Variable-Step-Size Maximum Power Point Tracker for PV Systems. 2010 3rd International Symposium on Electrical and Electronics Engineering (ISEEE). 2010: 112-117.
41] Lotfi Khemissi, Brahim Khiari, Ridha Andoulsi, Adnane Cherif. Low Cost and High Efficiency of Single Phase Photovoltaic System Based on Microcontroller. Solar Energy. 2012; 86: 1129-1141.
[42] N. Femia, G. Petrone, G. Spagnuolo, M. Vitelli. Optimization of Perturb and Observe Maximum Power Point Tracking Method. IEEE Transactions on Power Electronics. 2005; 20: 963-973.
[43] N. Pongratananukul. Analysis and Simulation Tools for Solar Array Power Systems [PHD’s Thesis]. University of Central Florida, Department of Electrical and Computer Engineering. 2005.
[44] Divya Teja Reddy Challa, I. Raghavendar. Implementation of Incremental Conductance MPPT with Direct Control Method Using Cuk Converter. International Journal of Modern Engineering Research (IJMER). 2012; 2(6): 4491-4496.
[45] S. A. Khan, M. I. Hossain. Design and Implementation of Microcontroller Based Fuzzy Logic Control for Maximum Power Point Tracking of a Photovoltaic System. 2010 International Conference on Electrical and Computer Engineering (ICECE). 2010: 322-325.
[46] A. Messai, A. Mellit, A. Guessoum, S. A. Kalogirou. Maximum Power Point Tracking Using a Ga Optimized Fuzzy Logic Controller and Its FPGA Implementation. Solar Energy. 2011; 85: 265-277. [47] M. A. Islam, A. B. Talukdar, N. Mohammad, P. K. S. Khan. Maximum Power Point Tracking of
Photovoltaic Arrays in Matlab Using Fuzzy Logic Controller. 2010 Annual IEEE India Conference (INDICON). 2010: 1-4.
[48] Aymen Chaouachi, Rashad M. Kamel, Ken Nagasaka. A Novel Multi-Model Neuro-Fuzzy-Based Mppt for Three-Phase Grid-Connected Photovoltaic System. Solar Energy. 2010; 84: 2219-2229. [49] S. Satpathy. Photovoltaic Power Control Using MPPT and Boost Converter [Degree’s Thesis],
Rourkela National Institute of Technology, Department of Electrical Engineering. 2012.
[50] C. Schuss, T. Rahkonen. Use of Mobile Phones as Microcontrollers for Control Applications Such as Maximum Power Point Tracking (MPPT). 2012 16th IEEE Mediterranean in Electrotechnical Conference (MELECON). 2012: 792-795.
[51] Carlos Manuel Ferreira Santos. Optimised Photovoltaic Solar Charger With Voltage Maximum Power Point Tracking [Master’s Thesis], Universidade Tecnica de Lisboa. 2008.
[52] J. Ghaisari, M. Habibi, A. Bakhshai. An MPPT Controller Design for Photovoltaic (PV) Systems Based on the Optimal Voltage Factor Tracking.IEEE Canada in Electrical Power Conference (EPC 2007). 2007: 359-362.
[53] R. Utsumi, S. Masukawa, S. Iida. Photovoltaic Power System with Simplified Cascade Boost Choppers. 2007 European Conference on Power Electronics and Applications. 2007: 1-6.