ONLINE LEAKAGE CURRENT MONITORING SYSTEM USING
TIME-FREQUENCY DISTRIBUTION
ON HIGH VOLTAGE INSULATOR
N. Q. Zainal Abidin1, A. R. Abdullah2, N. Norddin3and A. Aman4
1,2,3,4University of Technical Malaysia Melaka/Faculty of Electrical Engineering, Durian Tunggal, Malaysia. 1
[email protected], [email protected],[email protected],[email protected]
Abstract—Leakage current frequency components are frequently used as a tool for surface condition monitoring on polymeric insulation material and their pollution severity. Fast Fourier Transform (FFT) is one of the methods that are applied for the analysis, but it has some limitation in non-stationary signal. This paper presents the analysis of leakage current via online monitoring system for high voltage application. Tracking and erosion test complying with BS EN 60587-2007 is conducted on polymeric insulation to monitor the set of different leakage current patterns from capacitive, resistive and non-linear activities. The information obtained from this online monitoring allows the user to identify leakage current performance in real time. The user can monitor the performances at certain distances safely which it is the main purpose for online monitoring besides the accuracy of the measurement system, time and cost saving.
Keywords ü Leakage current; online monitoring; spectrogram.
I. INTRODUCTION
High voltage insulators are widely used in power industry and it is the most important part to prevent the flow of current to undesired paths and to resist stresses (mechanical stresses, electrical stresses, and environmental stresses)[1]. The insulators of the power system lines are easily exposed to the effects of pollution such the open air that causes tracking and erosion as well as to flashover[2]. Leakage current (LC) signal is a tool that leads to these contaminated conditions. Measurement of LC can be an effective method for minimizing the pollution flashover of insulators, and better if requires additional information from measurements and analysis of the pollution[3]. Tracking and erosion test complying with BS EN 60587-2007 are conducted on existing materials, which leakage current frequency components is used as a diagnostic tool for their surface condition monitoring and degradation severity.
Online performance monitoring can benefits engineering industries by confirming if the materials/equipment is performing as desired by the user. Online monitoring can give instantly information on LC performance in terms of its harmonic components. Normal performance analyses are usually conducted in offline mode which the LC data is saved into other files to be analyzed later. LC parameters such RMS value, RMS fundamental value, total harmonic distortion, total non-harmonic distortion, and total wave distortion instantaneously is estimated in order to develop and monitoring state condition of the materials insulating condition.
LC is normally analysed in frequency domain that utilise Fast Fourier Transform (FFT) for transformation technique[4]. However, this technique is only suitable for stationary signals and does not provide temporal information. Therefore, spectrogram is used that represent the signal in time and frequency. The information gained from this technique is extracted to get the information on harmonic components.
LC is classified into five groups namely capacitive, resistive, non-linear, discharge, and strong discharges[5]. The aim of this study is to examine the reliable method of surface monitoring using LC signal in time-frequency domain. Spectrogram is performed to detect the surface event of insulation material. Incline Plane Test (IPT) that complying with BS EN 60578-2007 is conducted on Polypropylene polymeric composite to simulate a set of different LC patterns as stated above.
In online LC monitoring system, it classifies LC signals in time domain, FFT, spectrogram, root mean square (RMS) value, fundamental value, total harmonic distortion (THD), total non-harmonic distortion (TnHD), and total wave distortion (TWD). The percentage of total waveform distortion TWD% is applied as rule based value for surface classification purpose. Hann (Hanning) is selected as window type for these analyses which it has lower peak side lobe compared to other types of windows i.e. rectangular, Hamming, Bartlett-Hann, Blackman, and etc.
II. EXPERIMENTAL WORK
Inclined Plane Test (IPT) is normally used to evaluate the tracking and erosion resistance of insulating materials and recommended by BS EN 60587[6]. It is a valuable tool for the comparison and evaluation of new and different materials under controlled electrical stress, to compare the suitability of materials for the dielectric surface of an insulator. It also has simplicity in test procedure and low equipment cost, and Polypropylene is used as the material under test. The selection of Polypropylene as electrical insulation, their advantages and properties are mentioned in [7]. Fig. 1 shows the experiment setup for IPT. The captured LC signal is based on NI-DAQ (data acquisition) that connected between the experimental high voltage setup and the notebook or computer to link with the software. The input signal is connected parallel with resistor to obtain the LC that flowed from the high voltage system. The LC signal and the analysis of the signal are displayed on the monitoring software.
In this study, Method 2 ‘variable-voltage method’ or
condition events for sample specimen. The voltage is increased from 0-3.5kV while maintaining the conductivity level of 2.5mS/cm and flow rate at 0.3ml/min.
Figure 1.Experiment setup for IPT test
The LC flow on polymer insulation surface can be divided into several parts which are the early aging period (EAP), transition period (TP) and late aging period (LAP) [8]. It consists of capacitive current, resistive current, non-linear current and non-linear with discharge current [9], which is the basic concept of this study. When the sample is completely dry or in hydrophobic state it is classified as EAP and only low capacitive LC flowed. In the second state, TP, the polymer insulation surface became hydrophilic and LC will change significantly from capacitive to resistively. Finally, during the LAP, LC is completely resistive and surface discharge took place.
III. LEAKAGE CURRENT ANALYSIS
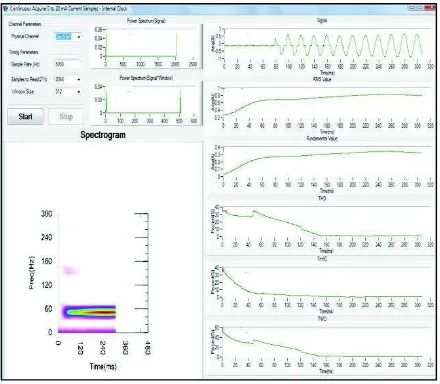
The graphical user interface (GUI) using visual basic is used to capture LC signal for monitoring and analysis purpose. The analysis of the LC signal includes FFT, spectrogram, and harmonic components such THD, TnHD, and TWD as shown in Fig. 2.
Figure 2. Leakage current monitoring system
A. Analysis in Frequency Domain
Fourier transform (FT) is mathematical techniques which convert signal from time to frequency domain. It can be defined as:
ò
-= ¥
¥
-dt ft j e t x f
X( ) ( ) 2p (1)
where fis the frequency to be analyzed. Discrete Fourier transform (DFT) is a digital filtering algorithm that calculates the magnitude and phase at discrete frequencies of a discrete time sequence while Fast Fourier Transform (FFT) are computationally capable algorithms for computing the DFT. The DFT is defined as:
å =
=
-N
n
N n k j
e n x k
X
0
) ( 2
) ( )
(
p
(2)
where Nis the maximum number of samples.
B. Analysis in Time-Frequency Representation
Instead of using frequency domain analysis, spectrogram gives better information on the material surface condition. The state of events from EAP to LAP can be classified by observing the result of spectrogram analysis. Other observations are the length, type of window and frequency sampling that is used has affected the frequency resolution as well as time resolution of spectrogram results.
Spectrogram is one of the time-frequency distributions (TFD) that represents the signal energy with respect to time and frequency. The analysis technique is motivated by the limitation of FFT to cater non-stationary signals whose spectral characteristics change in time. The changes are from calculating of the frequency spectrum of compound signal windowed frames [10]. Spectrogram can be defined as:
2
2 ) ( ) ( ) , (
S ò
-= ¥
¥
dt f j e t w x f t
x
t p t
t (3)
where x(t) is the input signal and w(t) is the window observation window.
I. LEAKAGE CURRENT PARAMETERS
A. Instantaneous RMS Current
The instantaneous RMS current is the square root of the arithmetic mean of squares of the function of continuous waveform. It can define as:
ò
= max
0 ( , )
] [
f
RMS t Sx t f df
I (4)
whereSx(t,f) is the time-frequency representation and fmax
is the maximum frequency of interest.
B. Instantaneous RMS Fundamental Current
Instantaneous RMS fundamental current, I1rms(t) is
2
,
2
)
,
(
2
)
(
1 1 1f
f
f
f
f
f
df
f
t
S
t
I
lo hi f f x RMS h i loD
-=
D
+
=
=
ò
(5)where f1is the fundamental frequency that corresponds to
the power system frequency and •f is the bandwidth which is set to 50Hz.
C. Instantaneous Total Harmonic Distortion
Total harmonic distortion (THD) is the relative signal energy present at non-fundamental frequencies and written as: ) ( ) ( ) ( 1
2 2 , 2 t I t I I t I RMS H
h h RMS RMS THD å -= = (6)
where Ih,RMS(t) is RMS harmonic current and H is the
highest measured harmonic component.
D. Instantaneous Total non-Harmonic Distortion
Non-harmonics are not multiple integer signal components frequency of the power system frequency. Therefore, total non-harmonic distortion (TnHD) is referred as distinguishing between non-harmonic and noise, and is calculated as:
) ( ) ( 1 , 2 t I I t I RMS M
m mRMS
TnHD
å
= (7)
where Im,RMS(t) is instantaneous RMS non-harmonic
current and M is the highest measured non-harmonic component.
E. Instantaneous Total Wave Distortion
Total wave distortion (TWD) consists of harmonic distortion and non-harmonic distortion. It can define as:
2 2
)
(
)
(
)
(
t
I
t
I
t
I
TWD=
THD+
TnHD (8)II. RESULTS
Visual Basic (VB) is a visual based programming language because the programming is done in a graphical environment. VB applies events driven programming language and allows users to click on a certain object randomly to make some action. Thus, graphical user interface in VB is suitable for monitoring system. In this study, the monitoring system consists of channel and timing parameters, data captured from DAQ, power spectrum, spectrogram, signal waveform, RMS and fundamental RMS, and harmonic components that calculated in percentage.
A. Channel Parameters
FFT and power spectrum are powerful tools for analyzing and measuring signals from plug in data acquisition (DAQ) device. With this kind of device, the user has the flexibility of configuring measurement processing to meet their needs. The user needs to enter the location of the device that connected to PC as in the Fig. 3.
Figure 3.Channel Parameters
B. Timing Parameters
The sampling frequency, fs for digitization of a
continuous signal must be at least twice the highest harmonic in the input signal[12]. The DFT spectral analysis will be constrained to range between zeros to one-half of the sampling frequency. The idea is if sampling frequency is 5000 Hz, the DFT output DFT will measure frequencies from 0 to 2500 Hz. Thus, the bandwidth of the DFT is proportional to sampling frequency. The sampling period, ts is computed from
sampling frequency:
s s
f
t
=
1
(9)Users are required to enter the number of samples as desired as shown in Fig. 4. However, the number of samples for compute FFT must equal to 2nwhere nis the integer. The window size also is equal to 2n where the user can choose the size that already been calculated in the box as shown in Fig. 4.
Figure 4.Timing parameters
C. Leakage Current Classifications
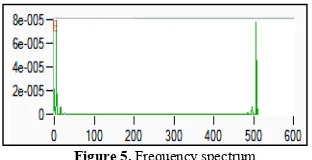
FFT is useful to get the magnitude and/or phase of a number individual or band of frequencies [13]. The current peaks of leakage current waveform are efficient tool to collect information about surface condition on polluted insulators and performing an FFT analysis to extract its frequency characteristics [14]. Fig. 5 shows the frequency spectrum where the x-axis represents the size of window function which in this study 512 is used.
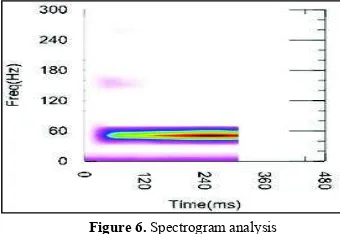
Hann (Hanning) window is selected because of its lower peak side lope [5] which is narrow effect on other frequencies around fundamental value (50 Hz in this study) and other frequency components. The highest power in spectrogram represented in red colour, while the lowest is blue colour as seen in Fig. 6.
Figure 6.Spectrogram analysis
As explained in experimental work, LC can be classified into capacitive type, resistive type, and non-linear type. During experiment, it is observed that at low voltages level between 0-1 kV, there is no erosion and arcing activities occurred on the insulation material. The material used in this study is polymer type. At this level of voltage, the LC is classified to capacitive type as shown in Fig. 7.
Figure 7.Capacitive type
On the other hand, at voltage levels between 1-2 kV, the LC is classified to resistive type which is a pure sinusoidal as shown in Fig. 8. Since the materials having the contaminant liquid at the surface before sparking occurs, LC flows and represented as pure sinusoidal waveform which is only fundamental frequency signal is existed.
Figure 8.Resistive type
The higher level of voltages until 3.5 kV will increase the energy and generate heat from arcing event and subsequently form dry-band on the surface which then leads to fast tracking and erosion[2]. This phenomenon form discharge activities as shown in Fig. 9. Arcing with lower sound is produced because of dry band region resulting from evaporation of conducting film. The effect of distorted non-linear symmetrical is associated with fundamental and non-fundamental frequency component.
Figure 9.Non-linear type
D. Harmonic Components
LC parameters such Irms, I1rms, ITHD, ITnHD, and ITWD
instantaneously is estimated in order to develop and monitoring state condition of the materials insulating condition. The frequency component is consisting not only harmonics but also non-harmonics (also known as inter-harmonics). Harmonic components consist of THD, TnHD, and TWD and they represented in percentage as in Fig. 10.
Figure 10.Harmonic components
III. CONCLUSIONS
component behavior is observed significantly with the LC signal shape. The non-fundamental frequency component is appearing associated with the distorted signal for capacitive and non-linear symmetrical LC signal. While, in pure sinusoidal LC signal only fundamental frequency signal is existed.
The correlation of surface event could be determined by frequency component of LC, where the higher content of frequency component represent as LAP and sinusoidal shape represent hydrophilic state of event or TP.
Continuous monitoring system of LC is essential for reliable and safe operation since there are high risks in high voltage application. The user can monitor the performances at certain distances safely which it is the main purpose for online monitoring besides the accuracy of the measurement system, time and cost saving.
ACKNOWLEDGMENT
The authors gratefully acknowledge the Faculty of Electrical Engineering, Universiti Teknikal Malaysia Melaka (UTeM) for giving the support in this study.
REFERENCES
[1] I. Ramirez, R. Hernandez, and G. Montoya, "Measurement of leakage current for monitoring the performance of outdoor insulators in polluted environments," Electrical Insulation Magazine, IEEE, vol. 28, pp. 29-34, 2012.
[2] A. El-Hag, L. H. Meyer, and A. Naderian, "Experience with salt-fog and inclined-plane tests for aging polymeric insulators and materials," Electrical Insulation Magazine, IEEE, vol. 26, pp. 42-50, 2010.
[3] I. Ramirez, R. Hernández, and G. Montoya, "Measurement of leakage current for monitoring the performance of outdoor insulators in polluted environments," IEEE Electrical Insulation Magazine, vol. 28, pp. 29-34, 2012.
[4] O. Rioul and M. Vetterli, "Wavelets and signal processing,"
IEEE Signal Processing Magazine, vol. 8, pp. 14-38, 1991. [5] H. I. S. Jayasundara, W. P. S. Sudarshani, and M. A. R. M.
Fernando, "Leakage current patterns on high voltage insulators: Analysis on frequency and time-frequency domains," 2008. [6] "Electrical insulating materials used under severe ambient
conditions - Test method for evaluating resistance to tracking and erosion," ed: BS EN 60857:2007, 2007.
[7] A. Aman, M. M. Yaacob, and J. A. Razak, "Dielectric Strength of Waste Tyre Dust-Polypropylene (WTD-PP) for High Voltage Application," Australian Journal of Basic and Applied Sciences, vol. 5, pp. 1578-1583, 2011.
[8] M. A. R. M. Fernando and S. M. Gubanski, "Leakage Currents on Non-ceramic Insulators and Materials," IEEE Transactions on Dielectrics and Electrical Insulation, vol. 6, pp. 660-667, 1999.
[9] M. A. R. M. Fernando and S. M. Gubanski, "Leakage Current Patterns on Contaminated Polymeric Surfaces," IEEE Transactions on Dielectrics and Electrical Insulation, vol. 6, pp. 688-694, 1999.
[10] A. R. Abdullah, A. Z. Sha'ameri, and N. M. Saad, "Power quality analysis using spectrogram and gabor transformation," 2007.
[11] A. Kusko and M. T. Thompson, Power Quality in Electrical Systems: McGraw Hill, 2007.
[12] D. Lyon, "The Discrete Fourier Transform Part 4: Spectral Leakage," Journal of Object Technology, 2009.
[13] E. P. Leite, Matlab - Modelling, Programming and Simulations: Sciyo.
POWER QUALITY SIGNALS DETECTION AND CLASSIFICATION USING
LINEAR TIME FREQUENCY DISTRIBUTION
N. H. T. H.Ahmad1,, A. R. Abdullah2and M. H. Jopri3
1,2Universiti Teknikal Malaysia Melaka,Malaysia. Faculty of Electrical Engineering, Malacca,Malaysia
[email protected], [email protected]
3Universiti Teknikal Malaysia Melaka, Faculty of Engineering Technology, Malacca,Malaysia. [email protected]
Abstract- Power quality has become a great concern to all electricity consumers. Poor quality can cause equipment failure, data and economical. An automated monitoring system is needed to ensure signal quality, reduces diagnostic time and rectifies failures. This paper presents the detection and classification of power quality signals using linear time-frequency distributions (TFD). The power quality signals focus on swell, sag, interruption, transient, harmonic, interharmonic and normal voltage based on IEEE Std. 1159-2009. The time-frequency analysis techniques selected are spectrogram and Gabor transform to represent the signals in time-frequency representation (TFR). From the time frequency representation (TFR) obtained, the signal parameters are estimated to identify the signal characteristics. The signal characteristics are the average of root means square voltage (Vave,rms), total waveform distortion (TWD), total harmonic distortion (THD) and total non harmonic distortion (TnHD) and duration of swell, sag, interruption and transient signals will be used as input for signals classification. The results show that spectrogram with the half window shift (HWS) provides better performance in term of accuracy, memory size, and computation complexity
KeywordsüLinear time frequency distribution; Time frequency representation; Power quality; Spectrogram; Gabor transform
I. INTRODUCTION
Power quality is the availability of pure sinusoidal voltage and current waveforms at 5 0 Hz (frequency power-line in Malaysia) without any disturbances at the incoming point of the supply system. Power quality problem is any problem manifested in voltage, current or frequency deviations with results in the failure or disoperation of end-use equipment [1 -3 ]. With the rapid advance in industrial applications that rely on sophisticated electronic devices, a demand for power quality and reliability has become a great concern. Power quality problems can cost business billions of dollars each year in lost revenue, process improvement and scrapped product. Major causes of power quality related revenue losses are interrupted manufacturing processes and computer network downtime [4 ].Conventional techniques that are currently used for power quality monitoring are based on visual of voltage and current waveforms [5]. The available equipment in the market for the inspection can capture and print the power quality data only at the current time. Therefore, a computerized and automated technique for monitoring and analysis of power quality
Many techniques were presented by various researchers for analyzing or classifying power quality problems [6-8]. However, this paper focuses on time-frequency analysis techniques to analyze power quality problems. Spectrogram and Gabor transform algorithms are proposed to identify the signals in time frequency domain. The spectrogram is squared magnitude of STFT where this technique very popular in many application. The spectrogram technique provides a good time resolution for narrow window while the large window is useful for good frequency resolution. The Gabor technique required very much computation compared spectrogram because it used the discrete Fourier transform; meanwhile spectrogram used the fast Fourier transform which it proposed to minimize the computation complexity.
In this paper the spectrogram and Gabor transform technique is used to represent the signals in time frequency representation (TFR).This technique will be analyzed with three different window shifts which is one sample window shift (OSWS), half window shift (HWS), and one window shift (OWS). From the TFR parameters of the signal are estimated and then, characteristics of signal are calculated from the signal parameter. The MAPE result use to identify the accuracy, memory size, and computation complexity of the signal characteristics that are calculated from TFR for each window. Lastly to verify the performance of this system, 100 signals with different characteristics for each type of power quality signal are generated and classified at signal noise to ratio (SNR) from 0db to 40 db and percentage of correct classification is identified.
II. POWER QUALITY SIGNAL
The parameters of the signal are estimated from the TFR to identify the signal information in time. This information is important to detect the power quality signal.
A. Signal model
The signals divide into three categories: voltage variation, waveform distortion and transient signal. Swell, sag and interruption are under voltage variation, harmonic and interharmonic are for waveform distortion and transient is for transient signal. The signal models of the categories are formed as a complex exponential signal based on IEEE Std. 1159-2009 [9] and can be defined as
å
=
-P =
3
1
1
2 ( )
)
( 1
k
k k k t f j
vv t e A t t