ISSN: 2252-8938 63
Adaptive Neural Subtractive Clustering Fuzzy Inference System
for the Detection of High Impedance Fault on Distribution
Power System
Adnan H. Tawafan*, Marizan bin Sulaiman* , Zulkifilie Bin Ibrahim*
* Faculty of Electrical Engineering, Universiti Teknikal Malaysia Melaka, Melaka, Malaysia.
Article Info ABSTRACT
Article history:
Received May 9, 2012 Revised May 28, 2012 Accepted Jun 9, 2012
High impedance fault (HIF) is abnormal event on electric power distribution feeder which does not draw enough fault current to be detected by conventional protective devices. The algorithm for HIF detection based on the amplitude ratio of second and odd harmonics to fundamental is presented. This paper proposes an intelligent algorithm using an adaptive neural- Takagi Sugeno-Kang (TSK) fuzzy modeling approach based on subtractive clustering to detect high impedance fault. It is integrating the learning capabilities of neural network to the fuzzy logic system robustness in the sense that fuzzy logic concepts are embedded in the network structure. It also provides a natural framework for combining both numerical information in the form of input/output pairs and linguistic information in the form of IF– THEN rules in a uniform fashion. Fast Fourier Transformation (FFT) is used to extract the features of the fault signal and other power system events. The effect of capacitor banks switching, non-linear load current, no-load line switching and other normal event on distribution feeder harmonics is discussed. HIF and other operation event data were obtained by simulation of a 13.8 kV distribution feeder using PSCAD. The results show that the proposed algorithm can distinguish successfully HIFs from other events in distribution power system
Keyword:
High Impedance Faults FFT
ANFIS
Subtractive Clustering Power system
Copyright © 2012 Institute of Advanced Engineering and Science. All rights reserved.
Corresponding Author:
Adnan H. Tawafan,
Faculty of Electrical Engineering,
Universiti Teknikal Malaysia Melaka,
Melaka, Malaysia,
Email: [email protected]
1. INTRODUCTION
A High Impedance Fault (HIF) is a weird event and difficult to detect on electric power distribution feeder [1]. A high impedance fault results when a primary conductor makes poor electrical contact with a road surface, sod, tree limb, sidewalk, with some other surface, or object which restricts the flow of fault current to a level lower that reliably detectable by conventional overcurrent devices. The resulting level of fault current is usually less than the normal current (about 10 to 50 A) of the electric power distribution feeder [1], the failure of HIF detection leads to serious threat in electric shock to human beings and potential fire hazards. HIF does not usually pose any risk to the electric power distribution feeder; however, the protection against them desirable. The nature of HIFs has been studied since the early 1970's with the hope of discovery some characteristic in the current or voltage waveform that would make detection possible and practical [1].
breaks down, a high potential is produced over a short distance and the sustainable current level in the arc is not sufficient to be reliably detected by conventional means.
There are some other electrical events that behave like the HIF (capacitor bank operation, air switching operation, nonlinear load and starting induction motor), the algorithm which proposed to detect HIF should have ability to discriminate between HIF from other normal event in power distribution system. Most of the detection methods require extensive computation in the reprocessing stage for feature extraction of the input signals. Then a strategy is applied to obtain detection parameters.
Through the past decades, protection engineers and researchers have tried to find a complete solution to this type of fault. The fault has many characteristics like presence of harmonics and high frequency components, detection techniques aim to identify useful features of HIF from the pattern of the voltage or current signals associated. Many detection algorithms have been proposed to detect HIF, some of these have used frequency-based to extract relevant features of the harmonic components [2–6] other have utilized time–frequency-based features to examine the transient phenomena of HIFs signals in both the time and frequency domains [7–14], the extracted features usually can be obtained after process the signals with one of methods of signal processing like discrete Fourier transform (DFT), discrete wavelet transform (DWT) and some other time–frequency analysis methods such as discrete S-transform (DST) and discrete time–time transform (DTT) [14].
In the research work [12], a method for HIF detection based on the nonlinear behaviour of current waveforms is presented. This method uses a wavelet multi-resolution signal decomposition method for feature extraction and an adaptive neural fuzzy inference system (ANFIS) for identification and classification. In [11] Wavelet transform and principal component analysis are used for feature extraction/selection. A fuzzy inference system is implemented for fault classification and a genetic algorithm is applied for input membership functions adjustment. In [15] the author uses (ANFIS) as a classifier to detect HIF. The 3rd harmonics, magnitude and angle, for the 3 phase currents are uses as features of HIF. And in [16] a collection of dominant key harmonic signals forms the basis for a ‘feature’ or ‘diagnostic’ vector instead of a single dominant harmonic signal. Fast Fourier Transform (FFT) is used to extract the vector comprising the 3rd and 5th harmonics of the voltage, current and power signals are developed.
Neural networks and fuzzy inference systems are complementary technologies in the design of adaptive intelligence system. Artificial Neural Network (ANN) learns from scratch by adjusting the interconnections between layers. Fuzzy Inference System (FIS) is a popular computing framework based on the concept of fuzzy set theory, fuzzy if-then rules, and fuzzy reasoning. A neuro-fuzzy system is simply a fuzzy inference system trained by a neural network-learning algorithm. The learning mechanism fine-tunes the underlying fuzzy inference system. Fuzzy system faces difficulties like a lack of completeness of the rule base and a lack of definite criteria for selection of the shape of membership functions, their degree of overlapping, and the levels of data quantization. Some of these problems can be solved if the neural technique is used for fuzzy reasoning.
This paper describes fault detection of HIF using Adaptive Neural subtractive Clustering Fuzzy Inference system as classifier. FFT is used to extract the features and the data for training and testing the ANFIS was produced by simulation of 13.8kV distribution feeder using PSCAD
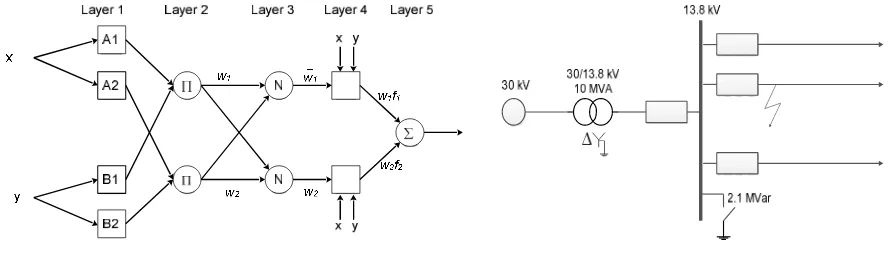
2. ANFIS CLASSIFICATION STRATEGY
ANFIS is a fuzzy Sugeno model of integration where the final fuzzy inference system is optimized via the ANNs training. ANFIS can be viewed as a class of adaptive networks which are functionally equivalent to fuzzy inference system. It maps inputs through input membership function and associated parameters, and then through output membership function to outputs. ANFIS uses back-propagation or a combination of least square estimation and back-propagation for membership function parameter estimation. The most important point in data classification by ANFIS is designing of fuzzy rules. To solve this problem, data clustering algorithms are used to categorize and organize data. The clustering in the fuzzy system is useful for reducing the dimension of fuzzy system rules while still representing the overall system. Clustering partitions a data set into several clusters where each data points in a cluster has more similarity than the one among the clusters. ln neuro-fuzzy systems, clustering is used to determine the initial locations and the number of IF-THEN rules. There are several clustering techniques that are used for this purpose and the most common ones are: K- means, fuzzy C-means, mountain clustering method and subtractive clustering. In this study, subtractive clustering is used in which each cluster represents one independent rule [17].
2.1. Subtractive Clustering
algorithms are used extensively not only to organize and categorize data, but are also helpful for model construction and data compression. Clustering techniques are used in conjunction with radial basis function networks or fuzzy modeling primarily to determine initial location for radial basis functions or fuzzy if-then rules. There are different clustering technique such as k-means clustering, fuzzy c-means clustering, mountain clustering and subtractive clustering. If there is no clear idea how many clusters there should be for a given set of data, subtractive clustering is a fast, one-pass algorithm for estimating the number of clusters and the cluster centers in a set of data.
Consider a collection of n data points in an m-dimensional space. Without loss of generality, the data points are assumed to have been normalized within a hypercube. Since each data point is a candidate for cluster centers, a density measure at data point xi is defined as:
= ∑ −ೕ
మ
ೌ⁄ మ
(1)
where ra is a positive constant. Hence a data point will have a high density value if it has many neighbouring
data points. The radius ra defines a neighbourhood; data points outside this radius contribute only slightly to
the density measure. After the density measure of each data point has been calculated, the data point with the highest density measure is selected as the first cluster center. Let xc1 be the point selected and Dc1 its density
measure. Next the density measure for each data point xi is recalculated by the formula
= − −‖భ‖
మ
್⁄ మ (2) Where rb is a positive constant. Therefore, the data points near the first cluster center xc1 will have
significantly reduced density measures, thereby making the points unlikely to be selected as the next cluster center. The constant rb defines a neighbourhood that has measurable reductions in density measure. The
constant rb is normally larger than ro to prevent closely spaced cluster centers; generally rb is equal to 1.5 ra.
After the density measure for each data point is recalculated, the next cluster center xc2 is selected and all of
the density measures for data points are recalculated again. This process is repeated until a sufficient number of cluster centers are generated.
When applying subtractive clustering to a set of input-output data, each of the cluster centers represents a prototype that exhibits certain characteristics of the system to be modeled. These cluster centers would be reasonably used as the centers for the fuzzy rules' premise in a zero-order Sugeno fuzzy model, or radial basis functions in a Radial Basis Function Network (RBFN). For instance, assume that the center for the i-th cluster is ci in an M dimension. The ci can be decomposed into two component vectors pi and qi,
where pi is the input part and it contains the first N element of ci; qi is the output part and it contains the last
M - N elements of ci. Then given an input vector x, the degree to which fuzzy rule i is fulfilled is defined by
ݑ
=
݁ݔ ቀ
‖‖
⁄
ቁ
(3)
This is also the definition of the i-th radial basis function if we adopt the perspective of modeling using RBFNs. Once the premise part (or the radial basis functions) has been determined, the consequent part (or the weights for output unit in an RBFN) can be estimated by the least-squares method. After these procedures are completed, more accuracy can be gained by using gradient descent or other advanced derivative based optimization schemes For further refinement [17].
3. SYSTEM MODELING 3.1 Distribution Feeder
A 13.8 kV distribution feeder was performed in PSCAD/ EMTDC. That consists of a substation and three distribution feeders with radial network. The schematic diagrams are given in Fig 2. The generator is of 30 kV and 10 MV connected to the transformer with 30/13.8 kV and 10 MV. The distribution network operates at 13.8 kV voltages. The distribution line is a 20 km long continuously transposed line. The 6-pulse rectifier is used to represent the nonlinear load. The simulation models are developed using PSCAD and the sampling rate chosen is 15.36 kHz.
The arcing and nonlinear characteristics of the current signals due to HIFs are similar to other events like load changes and switching operations. Therefore, the simulation of distribution system has been included linear load, non-linear loads and the effect of switching operation, the transient phenomena produced by capacitor switching similar to those of HIFs in frequency domain, so it is necessary to test the reliability of any HIF algorithm under this event. Many of capacitor energisation events have been taken into consideration in the studied distribution system. The conditions for these simulations are summarized in Table 1, where for each case, the current waveform on the feeder is calculated and processed.
3.2 HIF Simulation
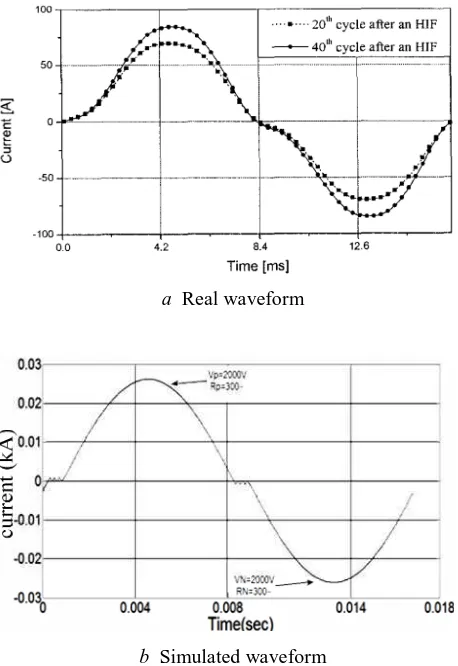
In the past, there are several models of HIF have proposed. All of these are based on Emanuel arc model and researchers have tried to complete it and come up to a better model for HIF. A simplified Emanuel model was introduced in 2003. The Two varying resistors were used to represent the fault resistance. A simplified two-diode model of HIF, shown in Figure3 [3]. It was used to generate different HIF currents by changing the parameters (resistors and DC source). Resistances ranging from 50 to 1500 ohms were varied and The DC source values were selected from 1 to 10 kV, which led to current value of the simulated HIFs in the range of 8–300 A.
Figure. 3 A simplified two-diode model of HIF
a Real waveform
b Simulated waveform
Table 1 The Conditions for These Simulations Event Simulation conditions Sending and receiving end
capacitor bank operation
operation conditions: on and off
Load levels: 30, 70 and 100 percent of the full load Source voltage phase angle: (0, 180)
Sending Capacitor operation: 2.1 and 4.2 MVar Receiving Capacitor operation: 2.1 MVar
Existing sending / receiving capacitor: 0 and 2.1 MVar Load operation on the
feeder
operation conditions: three and single phase
Load levels operation: 30-70, 70-100 percent of the full load Source voltage phase angle: (0, 180)
Existing sending / receiving capacitor: 0, 2.1 and 4.2 MVar Non-linear load operation on
the feeder
operation conditions: three phase
Load levels operation: 30-70, 70-100 percent of the full load Source voltage phase angle: (0, 180)
Existing sending / receiving capacitor: 0, 2.1 and 4.2 MVar
Figure 4a shows that real measured HIF current waveform extracted from [18] and Figure 4b shows the simulated waveform current. The qualitative comparison indicates that there is a relatively good correspondence between the real and simulation waveforms.
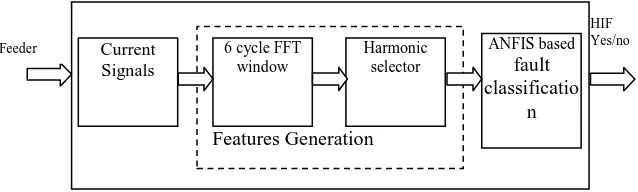
4. THE PROPOSED ALGORITHM
The proposed algorithm includes three important parts: input data preparation, features generation and fault classification. Input data preparation part is described in simulation section. The rest parts are detailed in the next section. Figure5 showed the Structure of the proposed algorithm.
Figure. 5 Structure of the proposed algorithm
4.1 Features Generation
On the modeled distribution system, different operation conditions have been simulated by using PSCAD/ EMTDC. The simulated data then were transferred to MATLAB to complete the rest algorithm. The main goal of algorithm is to discriminate between HIFs and other similar waveforms.
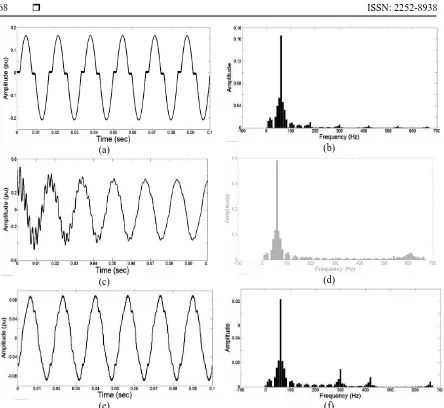
In this algorithm, the current waveforms of distribution power are used only to extract the features of HIFs, but not on voltage waveforms. The discrimination is based on the amplitude of fundamental and other harmonics current waveforms in the frequency domain. A Fast Fourier Transform (FFT) method is used for feature extraction. The analysis is focused on current waveform which is obtained from the distribution power system feeder. In the frequency domain, odd harmonics, such as the 3rd, 5th, 7th and 9th, are predominant also some even harmonics, such as 2nd, have significant amplitudes. However, the fundamental harmonic is decreased when the fault is occurred.
A normal current waveform, when a capacitor bank is present, appears no significant varies in phase current in the amplitude, the odd harmonics are predominant also even harmonics can be seen to some extent. In this paper, various waveforms were obtained by changing different parameters. When all these waveforms were obtained, useful relevant data were used to find the features that were common to all and can discriminate HIF from other signals. These investigations led us to define the following features.
The ratio of harmonics amplitude (2nd, 3rd, 5th, 7th, 9th and 11th) to the fundamental harmonic amplitude.
Features Generation
HIF Yes/no
Current Signals
6 cycle FFT window
Harmonic selector
ANFIS based fault classificatio
(a)
(c)
(e)
Figure 6. Signals of the Feeder: capacitor bank; (b), (d): FFT for
1 2
1
I
I
f
=
1 3
2
I
I
f
=
1 5
3
I
I
f
=
1 7
4
I
I
f
=
1 9
5
I
I
f
=
(b)
(d)
(f)
: (a), (c): The typical signals of HIF fault current unde for signals in a and b; and (e), (f) : The typical signal of
FFT
der linear load and with l of nonlinear load and its
(4)
(5)
(6)
(7)
1 11
6
I
I
f
=
(9)
where I2, 3, 5, 7, 9 and 11 represent the 2nd, 3rd, 5th, 7th, 9th and 11th harmonics amplitude of the signal
respectively, I1 represent the fundamental harmonic amplitude, and fi represent the extracted features.
Gather all the extracted features to obtain one vector which represent the input data to training the adaptive neural subtractive clustering fuzzy system. The typical signals of HIF fault current under linear load and with capacitor bank also signal of nonlinear current and their spectrum is shown in Figs. 6a, b, c, d, e and f respectively.
4.2 Classification
Cluster analysis is an exploratory data analysis tool which aims at sorting different objects into groups in a way that the degree of association between two objects is maximal if they belong to the same group and minimal otherwise. Given the above, cluster analysis can be used to discover structures in data without providing an explanation/interpretation. In other words, cluster analysis simply discovers structures in data without explaining why they exist.
Fuzzy Logic allows finding clusters in input-output training data. It can use the cluster information to generate a Sugeno-type fuzzy inference system that best models the data behavior using a minimum number of rules. The rules partition themselves according to the fuzzy qualities associated with each of the data clusters. Then adaptive neural trains fuzzy inference system to develop IF-THEN fuzzy rules and determine membership functions for the input and output variables of the system under study. Also the neural network associated with the ANFIS trains the membership functions for minimization of error for fault classification.
In this study, adaptive neural subtractive clustering fuzzy logic is used as the classifier to serve for the fuzzy classification. Six extracted features are used to generate fuzzy inference system.
4.3 Input Data Preparation
Building an adaptive neural fuzzy inference system involves two steps: A) Data preparation and,
B) Rules generation and system training.
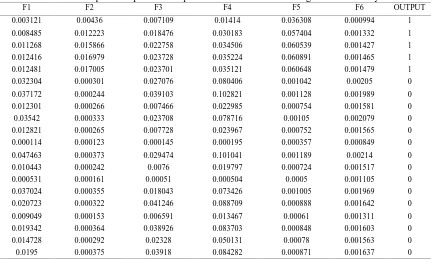
Table 2. Samples of Input And Output Data Sets Used for Training the FS Based System
F1 F2 F3 F4 F5 F6 OUTPUT
0.003121 0.00436 0.007109 0.01414 0.036308 0.000994 1
0.008485 0.012223 0.018476 0.030183 0.057404 0.001332 1
0.011268 0.015866 0.022758 0.034506 0.060539 0.001427 1 0.012416 0.016979 0.023728 0.035224 0.060891 0.001465 1 0.012481 0.017005 0.023701 0.035121 0.060648 0.001479 1 0.032304 0.000301 0.027076 0.080406 0.001042 0.00205 0
0.037172 0.000244 0.039103 0.102821 0.001128 0.001989 0 0.012301 0.000266 0.007466 0.022985 0.000754 0.001581 0 0.03542 0.000333 0.023708 0.078716 0.00105 0.002079 0
0.012821 0.000265 0.007728 0.023967 0.000752 0.001565 0 0.000114 0.000123 0.000145 0.000195 0.000357 0.000849 0 0.047463 0.000373 0.029474 0.101041 0.001189 0.00214 0
0.010443 0.000242 0.0076 0.019797 0.000724 0.001517 0 0.000531 0.000161 0.00051 0.000504 0.0005 0.001105 0 0.037024 0.000355 0.018043 0.073426 0.001005 0.001969 0 0.020723 0.000322 0.041246 0.088709 0.000888 0.001642 0
0.009049 0.000153 0.006591 0.013467 0.00061 0.001311 0 0.019342 0.000364 0.038926 0.083703 0.000848 0.001603 0 0.014728 0.000292 0.02328 0.050131 0.00078 0.001563 0
A) Clustering Data Preparation for ANFIS: Generating an ANFIS requires dividing the training data into two data sets:
a) An input data set which has values for the six inputs (F1, F2, F3, F4, F5, F6) represent the amplitude ratio of second, third, fifth, seventh, ninth and eleventh harmonic to the fundamental harmonic ). 570 input data points were selected from frequency domain of current signals. These points were placed into a single input data set.
b) An output data set which has values for the one output (1 or 0). The output of ANFIS either 1 for high impedance fault occurs or zero for other normal event in power system. 570 output data points, corresponding to the selected input points. These points were placed into a single output data set.
The other 570 input and output data points, which are different from the training data, will be used for testing purpose. Samples of input and output data sets used for training the ANFIS based system are given as Table2.
B) Rules Generation for ANFIS
The fuzzy subtractive clustering algorithm estimates the cluster centers in a set of data. It assumes each data point is a potential cluster center and calculates a measure of the likelihood that each data point would define the cluster center, based on the density of neighboring data points.
The radii variable is a vector of entries between 0 and 1 that specifies a cluster center’s range of influence in each of the data dimensions, assuming the data falls within a unit hyperbox. Small radii values generally result in finding a few large clusters. Good values for radii are usually between 0.2 and 0.5. For this application, a value of 0.2 for all the radii was chosen. This was found to result in fewer membership functions and higher processing speeds, without sacrificing accuracy.
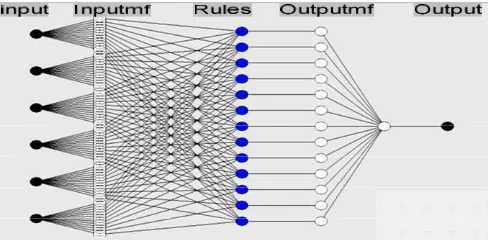
A hybrid algorithm in ANFIS updates the consequent and premise parameters through a learning procedure having two parts. In the first part, the entire training patterns are propagated, and the optimal consequent parameters are estimated by an iterative least mean square procedure Figure 7 shows the architecture of the ANFIS. The hybrid method is used to optimize the fuzzy system parameter with a set of input and output (target) pairs. An output vector can be produced by presenting an input pattern to the network. According to the difference between the produced output and the target vector, membership function shapes are adjusted to reduce the output error.
4.4 Results and Discussion
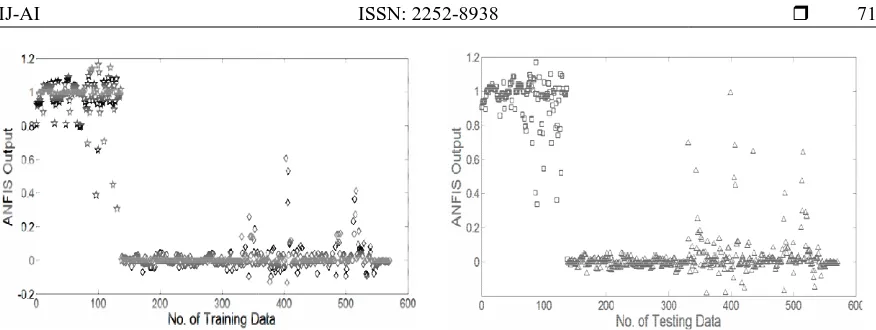
570 training cases were selected to train the network. The training sets included 138 HIF cases and the rest are non fault cases. The ANFIS has one output, the output is one when the system detect HIF case and is zero when other cases. Figure 5 shows output of the ANFIS to the training data. It is obvious that the HIF detection is successful to detect 97.8% of the fault cases and 99% for non fault cases. The MSE value of the model of training case is 0.0843. The system is trained properly and has categorized different cases effectively.
To evaluate the suitability of proposed algorithm, test data cases were fed to the ANFIS and the obtained output is shown in Figure 6. It shows that the proposed method could classify different input categories successfully and reliably. It is found that the proposed algorithm is capable to categorize 96.4% in case of HIF testing and 98% for non HIF testing cases. The MSE value of the model of testing case is 0.1163. Where the output of ANFIS for bath cases is
IHIF > 0.6 for HIF conditions
IHIF < 0.4 for no fault conditions
Results of the testing phase, which demonstrates that the algorithm is reasonably reliable.
Figure 8. O amplitudes of the 2nd, 3rd, 5th, 7 as a data input to ANFIS. The r
Output of the ANFIS to (a) the training data (b) test data
osed a framework for the construction of an ANFI to detect HIF. In this paper a normal current waveform re simulated with PSCAD software program. The curren ing processed the signal with FFT to extract the relevan
, 7th, 9th and 11th harmonics to amplitude of fundamen e results show that the ANFIS has the ability to discrim
he algorithm can be expanded and improved conside
thank the Faculty of Electrical Engineering, UTeM for
d Stephan, K., "High impedance fault detection technology" ng Group D15, March 1996
D., "Distribution high impedance fault detection utilizing
ower Appl. Syst., 1982, PAS-101, (6), pp. 1596–1606
, Orr, J.A., Shiller, S., Gulachenski, E.M., "High impedance fa contributions to the evaluation of the low frequency spectru
686.
Park, Y.M., Yoon, M.C., Yoo, M.H., "High impedance alized even order harmonic power", IEEE Trans. Power Deli
Cinchali, R.P., "An arcing fault detection technique using aluation using recorded field data", IEEE Trans. Power Deliv
g, C.J.L.,Guo,Y., Lin, T.M., Shen, S., "Energy variance criter ault detection", IEEE Trans. Power Deliv., 1999, 14, (3), pp. 8 endi, E., Gonzalez, J.A., "Study of high impedance fault det
onics and Quality of Power, 2000, pp. 1011–1016
Sichanie, A.G., "Application of discrete wavelet transform
nf. Energy Management and Power Delivery, 1998, pp. 689–6
E., "High impedance fault detection using discrete wavelet
IEEE Trans. Power Deliv., 2005, 20, (1), pp. 397–407.
.R., Malik, O.P., Ghassemian, M.H., "High impedance fault de rn recognition", IEEE Trans. Power Deliv., 2005, 20, (4), pp. A.-R.; Malik, O.P.; "Development of a fuzzy inference s ce fault detection", Generation, Transmission and Distribut
1 May 2006
nd, M., "High impedance fault detection using multi-resoluti erence system", IET Gener. Transm. Distrib., 2008, 2, (1), pp.
ata.
fault arcing on study soil in trum", IEEE Trans. Power
e fault detection utilizing
eliv., 1991, 6, (2), pp. 557–
let transform and frequency
[13] Michalik, M., Lukowicz, M., Ra
multigrounded MV networks",
[14] Samantaray, S.R., Panigrahi, B using time-frequency transform 261–270
[15] Abdel Aziz, M.S., Moustafa H detection and classification in
Drives (SDEMPED), 2011 IEEE
[16] Saleem, S.M.A.; Sharaf, A.M.,
and Computer Engineering, 20
2008
[17] Jang J. S. R., "ANFIS: "A
Cybernetics, Vol. 23, N0. 5f6
[18] Nam, S.R., Park, J.K., Kang, Y
Rabizant, W., Lee, S.J., Kang, S.H., "New ANN-based algorith
", IEEE Trans. Power Deliv., 2008, 23, (1), pp. 58–66 , B.K., Dash, P.K., "High impedance fault detection in pow
rm and probabilistic neural network", IET Gener. Transm. D
a Hassan, M.A., Zahab, E.A. , "Applications of ANFIS in in distribution networks", Diagnostics for Electric Machine
EE International Symposium on , vol., no., pp.612-619, 5-8 Se
., "A fuzzy ARTMAP based high impedance arc fault detec
2008. CCECE 2008. Canadian Conference on , vol., no., pp.0
"Adaptive-Network-Based Fuzzy Inference System", IEEE f6, pp. 665-685, 1993.
, Y.C., and Kim, T.H.: "A modelling method of high impeda e varying resistances in EMTP", IEEE Power Eng. Soc. Sum
RS he applications of artificial neural optimization networks and ptimization and protection
bin Sulaiman was born in April 16, 1962 in Kuala Besut, T
elor of Science in Electrical Engineering in May 1984, th l Engineering In December 1985 at the University of Misso nd Doctor of Philosophy Ph. D in Electrical Engineering Columbia in May 1989. He is a registered member of th (BEM) and the Institution of Engineers, Malaysia (IEM). He as Dean of Student Affairs and Alumni, UTeM from Februar focuses on Control, Instrumentation & Automation, Power E
nic Engineering.
e Bin Ibrahim was born in April 16, 1966 in Singapore.