UNIVERSITI TEKNIKAL MALAYSIA MELAKA
QUALITY IMPROVEMENT THROUGH LEAN SIX SIGMA
APPROACH AT WOODEN PICTURE FRAME MOULDING
COMPANY
This report submitted in accordance with requirement of the Universiti Teknikal Malaysia Melaka (UTeM) for the Bachelor Degree of Manufacturing Engineering
(Manufacturing Management) (Hons.)
by
ABDUL MUHAIMIN BIN MOHD YUSRI B051110262
921115-02-5379
UNIVERSITI TEKNIKAL MALAYSIA MELAKA
BORANG PENGESAHAN STATUS LAPORAN PROJEK SARJANA MUDA
TAJUK: Quality Improvement through Lean Six Sigma Approach at Wooden Picture Frame Moulding Company
SESI PENGAJIAN: 2014/15 Semester 2
Saya ABDUL MUHAIMIN BIN MOHD YUSRI
mengaku membenarkan Laporan PSM ini disimpan di Perpustakaan Universiti Teknikal Malaysia Melaka (UTeM) dengan syarat-syarat kegunaan seperti berikut:
1. Laporan PSM adalah hak milik Universiti Teknikal Malaysia Melaka dan penulis. 2. Perpustakaan Universiti Teknikal Malaysia Melaka dibenarkan membuat salinan
untuk tujuan pengajian sahaja dengan izin penulis.
3. Perpustakaan dibenarkan membuat salinan laporan PSM ini sebagai bahan pertukaran antara institusi pengajian tinggi. atau kepentingan Malaysia sebagaimana yang termaktub dalam AKTA RAHSIA RASMI 1972)
(Mengandungi maklumat TERHAD yang telah ditentukan oleh organisasi/badan di mana penyelidikan dijalankan)
Alamat Tetap:
DECLARATION
I hereby, declared this report entitled “Quality Improvement through Lean Six Sigma Approach at Wooden Picture Frame Moulding Company” is the results of
my own research except as cited in references.
Signature : ……….
Author’s Name : Abdul Muhaimin bin Mohd Yusri
APPROVAL
This report is submitted to the Faculty of Manufacturing Engineering of UTeM as a partial fulfillment of the requirements for the degree of Bachelor of Manufacturing Engineering (Manufacturing Management) (Hons.). The member of the supervisory is as follow:
i
ABSTRAK
ii
ABSTRACT
iii
DEDICATION
To the soul of my beloved parents, Mohd Yusri Giman and Mashithah Che Ahmad, my sisters, Najihah, Hidayah and Nur Jannah also lovely friends. Thank you for the
iv
ACKNOWLEDGEMENT
v
vi
3.2.2 Quantitative data 29
3.3 Methodology 30
3.3.1 Identify Critical Problems that Causes High Rate of 30 Defect at Emboss Process. (Define, Measure) (Objective 1).
3.3.2 Analyses the Root Causes of the Critical Problem at the 33 Emboss Process. (Measure, Analyse) (Objective 2).
3.3.3 Propose Appropriate Lean Tools and Techniques for the 36 Solution of the Critical Problem at Compo Process
vii
4.2.1 Data Analysis 46
4.2.1.1 Ishikawa Diagram 46
4.2.1.2 Quick Survey 46
4.2.1.3 Majority-minor Concept 47
4.2.2 Results and Discussion 47
4.2.2.1 Ishikawa Diagram 47
4.2.2.2 Quick Survey 54
4.2.2.3 Majority-minor Concept 54
4.3 Propose Appropriate Lean Tools and Techniques 57 for Solution of the Critical Problem at Compo Process
4.3.1 Data Analysis 57
4.3.2 Results and Discussion 57
4.3.2.1 Storage Room (Zero-Defect Lean Techniques) 57 4.3.2.2 Standard Operating Procedure of Compo Process 61
(Work Standardization- Lean Techniques)
4.3.2.3 Andon Light (Lean Tools) 64 4.3.2.4 Separation Box (Poka-Yoke – Lean Tools) 64 4.3.2.5 Glue Filter (Zero-Defect Lean Techniques) 66 6.3.2.6 Training on Compo Process 66
4.4 Summary 67
CHAPTER 5: CONCLUSION AND RECOMMENDATION 68
5.1 Conclusion 68
5.2 Recommendation 69
viii
APPENDICES 79
Appendix A1 Data for Number of Workers Turnover in Company X from January 2014 until August 2014
Appendix A2 Data for Number of Defects and Reworked Products in Company X from January 2014 until August 2014
Appendix A3 Data for Workers Overtime at Compo Department in Company X from January 2014 until August 2014
Appendix B Gantt Chart for Final Year Project (PSM I & PSM II) Appendix C1 Current Compo Department Layout
Appendix C2 Current use of Proposed Storage Room area Appendix C3 Proposed Storage Room layout location Appendix C4 Proposed Coating Material
Appendix D Compo Material Monthly Planning Sheet Appendix E Standard Operating Procedure (SOP) Appendix F1 Proposed Andon Light System
Appendix F2 Proposed Andon Light System Location
ix
LIST OF TABLES
2.1 The Factors Workers Turnover (Hana and Lucie,2011) 13 2.2 Seven types of waste (Womack & Jones,1996) 16
2.3 Lean Tools and Description 18
2.4 Key Steps of Six Sigma using DMAIC Process 23 (McClusky,2000) and its Tools and Techniques
(American Society for Quality,1940)
4.1 SIPOC Diagram Results Collected from the Interview 42 and Observation
4.2 The Results from Quick Survey of the Factor that 55 Lead to Finger Join Effect
4.3 The Summary of Proposed Solution to the Identified 58 Root Causes
x
LIST OF FIGURES
1.1 The Number of Workers Turnover in Company X 4 From January 2014 until August 2014
xi 4.9 Proposed Standard Operating Procedure at the 63 Compo Process
xii
LIST OF ABBREVIATIONS, SYMBOLS AND
NOMENCLATURE
HR - Human Resource LM - Lean Manufacturing MR - Machine Room
VSM - Value Stream Mapping
1 This chapter consists of background of the study, problem statement, aim and objectives, scope of the study, process flows of Company X, benefits and expected outcome of the study. Description of chapters in the thesis is presented at the end of this chapter.
1.1 Background of the Study
Furniture industry is one of the wood based sector that falls under the manufacturing sector which largely contributes to the national economy. Malaysian furniture industry stands as the 10th largest furniture exporters in the world, the 2nd in Asia and the 1st in ASEAN (MFPC, 2007). However, Bauman (2009) stated several factors that effecting wood furniture manufacturing industries such as management, manufacturing, asset quality, marketing and sales, distribution and delivery and this will gives impacts to the productivity.
Term productivity is generally used as a material productivity, worker’s productivity, lead time productivity, machine productivity, and others. Productivity is the ratio of output over input for a specific production situation (Rogers, 1998). The efficiency of a production system were measured by productivity. Productivity measures relating of a quality or quantity aspects of output over inputs required to produce it. It is calculated as the ratio of the amount of output produced to some measure of the amount of input used.
INTRODUCTION
2 Higher productivity means producing more from a given amount of input or producing a given amount with minimum level of inputs. In Malaysia, the furniture manufacturing industries as a whole utilize of aged technology and is still characterized by a heavy reliance on low or semi-skilled (Anand, 2011). Thus, contributed to low industrial and labour productivity. This study focuses on productivity improvement at Compo department at Company X which is one of the manufacturers in furniture industry.
1.2 Problem statement
All manufacturing companies have the most important goal which is to improve their productivity to increase the production efficiency. Company X is the wooden frame manufacturing company which located in Temerloh, Pahang. This factory seeks to increase their production productivity. Currently, there are defect and many rework products produced resulted from the output demand on customized products.
Figure 1.1 shows the number of workers turnover data in Company X from January 2014 until August 2014. The details data are shown at Table A1 in Appendix A. Compo department shows the highest workers turnover compared to the others department. Over that period, 21 new workers joined and 10 workers left. The second highest turnover is at MR department, 10 workers came in and eight workers left. This followed by spray department, six workers came in and three workers left. The other departments showed no higher rate of workers turnover like this three departments. No workers turnover at Foil department.
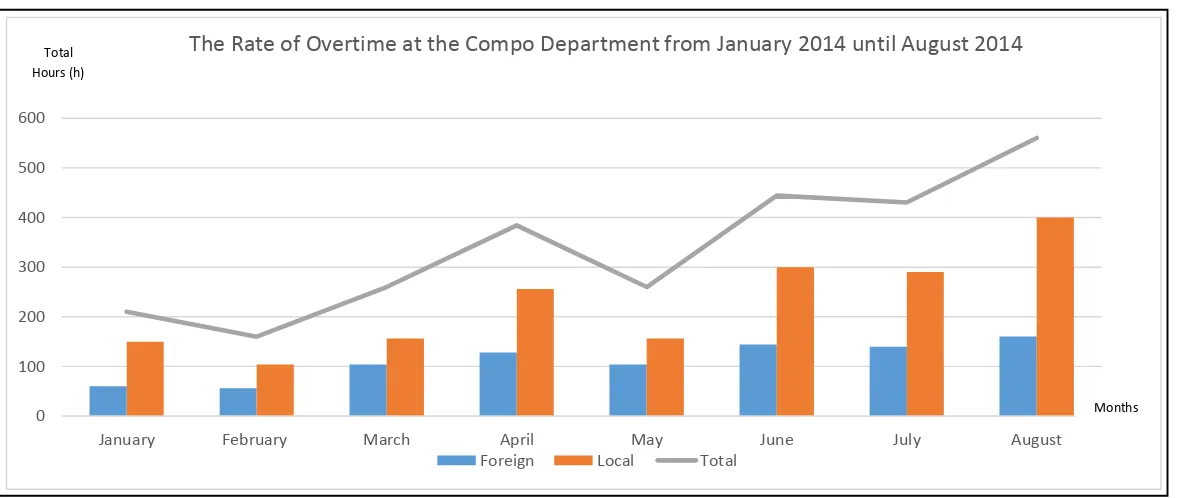
3 Figure 1.3 show the overall rates of overtime at the compo department from January 2014 until August 2014. The details data are shown at Table A3 in Appendix A. Based on the data, it shows fluctuated reading over the months. The overtime rate directly proportional to the number of output produced at the Compo department process. The more output produced the highest of overtime rate. Since the company experiences the large number of product reworks, unnecessary overtime has been created and it gives hidden loss to the company.
1.3 Aim and Objectives
The aim of this study is to improve the productivity in Compo department process by using Lean Six Sigma approach. These three objectives are set to achieve this aim:
i. To identify the critical problems that cause high rate of defect at Compo process.
ii. To analyse the root causes of the critical problem at the Compo process. iii. To propose appropriate lean tools and techniques for the solution of the critical
problem at Compo process.
1.4 Scope of the Study
4 Figure 1.1: The Number of Workers Turnover data in Company X from January 2014 until August 2014
5 Figure 1.2: The Number of Defects and Reworked Products at the Compo Department
6
Figure 1.3: The Rate of Overtime at the Compo Department from January 2014 until August 2014 0
100 200 300 400 500 600
January February March April May June July August
The Rate of Overtime at the Compo Department from January 2014 until August 2014
Foreign Local Total
Total Hours (h)
Months
7
1.5 Background of Company X
1.5.1 History of Company X
Company X was set up in 1982, in Pahang. The company produces customized picture frame which is only for export. Currently, Company X has secured market to the United States, Canada, Europe, Australia, Asia Pacific countries, and Middle East countries. Company X equipped with full range of profiles, sizes ranging from small 10mm fillets to 160mm ornate moulding, in an extensive range of finishing, from wood tone to hand leaf and ornate series. Company X is set to provide a full range of moulding in variety finishing to their customer, to facilitate buying everything from one source save customer cost. Their main focus is to meet customer satisfactions with their products.
1.5.2 Core Business
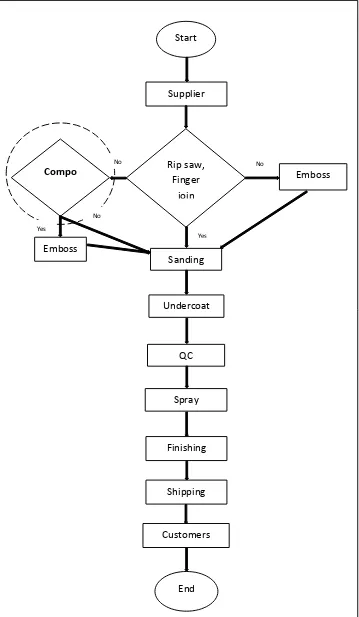
The core business of Company X is to manufacture customized picture frame by using various type of woods such as Meranti, Pulai and Jelutong. All the products must undergo basic processes such as rip and saw, finger join, milling, compo and spray. Company X has suppliers and customers all in foreign countries.
1.5.3 Process Flow
8 Figure 1.4: The Process Flow of Wooden Frame Products