111
V. SIMPULAN DAN SARAN
A. Simpulan
Penelitian terhadap judul “Aktivitas Antioksidan Minuman Beralkohol
Dari Ragi Tuak Dayak Dengan Kombinasi Ketan Hitam (Oryza sativa Var.
Glutinosa) Dan Beras Hitam (Oryza sativa) Kultivar Cempo Ireng” ini telah
diselesaikan dan menghasilkan tiga simpulan sebagai berikut :
1. Tidak ada perbedaan pengaruh dari kombinasi ketan hitam dan beras hitam terhadap aktivitas antioksidan dalam minuman beralkohol yang dihasilkan. 2. Kombinasi ketan hitam dan beras hitam yang tepat untuk membuat minuman beralkohol dengan aktivitas antioksidan tertinggi adalah kombinasi E yang menggunakan 100% beras hitam.
3. Kombinasi ketan hitam dan beras hitam yang tepat untuk membuat minuman beralkohol dengan kualitas yang baik berdasarkan standar SNI (SNI 01-4984:1999 dan SNI 7388:2009) adalah kombinasi C dengan penggunaan 50% ketan hitam dan 50% beras hitam.
B. Saran
112
dan paparan oksigen serta dijaga pada suhu kurang dari 37ºC. Proses penyaringan dengan kain saring dapat digantikan dengan penyaringan vakum.
113
DAFTAR PUSTAKA
Anggraeni, L.N. 2012. Karakterisasi T-DNA Agrobacterium tumefaciens
Pembawa Florigen Hd3a di Bawah Kontrol Promoter rolC. Skripsi S1. Fakultas Biologi. Universitas Gadjah Mada.
Anonim. 2006. Pengujian Organoleptik (Evaluasi Sensori) dalam Industri Pangan. http://tekpan.unimus.ac.id/wp-content/uploads/2013 /07/Pengujian-Organoleptik-dalam-Industri-Pangan.pdf. 14 April 2014.
Aligita, W. 2007. Isolasi Antosianin dari Ketan Hitam (Oryza sativa L. Forma Glutinosa). Skripsi. Bandung, Institut Teknologi Bandung.
Balai Besar Penelitian Tanaman Padi. 2010. Mengenal Beras Hitam. http://pustaka.litbang.deptan.go.id/ bppi/lengkap/bpp10031.pdf. 1 Juni 2013. Bao, J, Cai, Y., Sun, M., Wang, G. dan Corke, H. 2005. Anthocyanins, Flavonols, and Free Radical Scavenging Activity of Chinese Bayberry (Myrica rubra) Extracts and Their Color Properties and Stability. J Agric Food Chem 53: 2327-2332.
Baxter, G., Blanchard, C., dan Zhao, J. 2014. Effects of Glutelin and Globulin on the Physicochemical Properties of Rice Starch and Flour.
http://www.sciencedirect.com/science/article/pii/S0733521014001015. 20 Juni 2014.
Benabadji, S.J., Wen, R., Zheng, J.B., Dong, X.C. dan Yuan, S.G. 2004. Anticarcinogenic and Antioxidant Activity of Diindolymethane Derivatives.
J.Acta Pharmacologica Sinica 25(5):666-671.
Bennett, R.W. dan Lancte, G.A. 2001. Bam: Staphylococcus aureus. http://www.fda.gov/food/foodscienceresearch/laboratorymethods/ucm07142 9.htm. 12 November 2013.
Beuchat, L.R. 1993. Selective Media for Detecting and Enumrating Foodborne Yeasts. Int. J. Food Microbiol. 19(1):1-14.
Blois, M.S. 1958. Antioxidant Determinations by the Use of a Stable Free Radical. Nature 181:1199-1200.
BPTP Yogyakarta. 2010. Mari Lestarikan Beras Hitam Lokal. http://yogya.litbang.deptan.go.id/ind/index.php?option=com_content&view =article&id=63&Itemid=5. 11 November 2013.
114
BSNI. 2009. SNI 7388 : Batas Maksimum Cemaran Mikroba dalam Pangan. Badan Standardisasi Nasional, Jakarta.
Buleon, A., Colonna, P., Planchot, V. dan Ball, S. 1998. Starch Granule : Structure and Biosynthesis. International Journal of Biological Macromolecules 23:85-112.
Campbell-Platt, G. 2009. Food Science and Technology. Wiley-Blackwell, UK. 86-96.
Chaudary, R. C., dan Tran, D. V. 2001. Specialty Rice of the World: A Prologue In: Enfield, N.H (eds). Speciality Rice of the World; Breeding, Production and Marketing. pp. 3-12. Science Publishers. Inc. and FAO, USA.
Chi, Z., Chi, Z., Liu, G., Wang, F., Ju, L., dan Zhang, T. 2009. Saccharomycopsis fibuligera and its Applications in biotechnology. Biotechnology Advances
27:423-431.
Chiang, Y.W., Che, F.Y. dan Ismail, A.M.. 2006. Microbial Diversity and
Proximate Composition of Tapai, A Sabah’s Fermented Beverage. Malaysian Journal of Microbiology 2:1-6.
Code of Federal Regulation. 2013. Acidified Foods. http://www.accessdata. fda.gov/scripts/cdrh/cfdocs/cfcfr/CFRSearch.cfm?fr=114.90. 18 November 2013.
DeMan, J.M. 1997. Kimia Makanan. Institut Teknologi Bandung, Bandung. 251-252.
DifcoTM. 2009. DRBC Agar. http://www.bd.com/europe/regulatory/Assets/IFU/ Difco_BBL/258710.pdf. 12 Mei 2014.
Dung, N.T.P., Rombout, F.M. dan Nout, M.J.R. 2005. Development of defined mixed-culture fungal fermentation starter granulate for controlled production of rice wine. Innovative Food Science and Emerging Technologies 6:429-441.
Dung, N.T.P., Rombout, F.M. dan Nout, M.J.R. 2007. Characteristic of some traditional Vietnamese starch-based rice wine fermentation starters. LWT Food Science and Technology 40:130-135.
Dung, N.T.P. 2013. Vietnamese Rice-based Alcoholic Beverages. International Food Research Journal 20(3):1035-1041.
115
Gardjito, M dan Hastuti, P. 1988. Teknologi Pengolahan Serealia. PAU Pangan dan Gizi UGM, Yogyakarta. 25-27.
Galli, R.L, Shukitt-Hale, B., Youdim, K.A. dan Joseph, J.A.. 2002. Fruit Polyphenolics and Brain aging: Nutritional Interventions Targeting Age-related Neuronal and Behavioural Deficits. Ann NY Acad Sci 959:128-132. Ghiselli, A., Nardini, M., Baldi, A. dan Scaccini, C.. 1998. Antioxidant Activity
of Different Phenolic Fractions Separated from an Italian Red Wine. J Agric FoodChem 46(1):361-367.
Goufo, P. dan Trindade, H. 2014. Rice Antioxidants : Phenolics Acids, Flavonoids, Anthocyanins, Proanthocyanidins, Tocopherols, Tocotrienols,
γ-oryzanol and Phytic Acid. Food Science & Nutrition 2(2): 75-104.
Gougoulias, N., Papachatzis, A., Helen, K., Adamantia C. dan Chouliaras, N.. 2010. Studies of Total Phenol Contents, Anthocyans and Antioxidant Activity of Some Greek Red Wines. Universitatea Din Craiova 15(51):269-274.
Hamaker, B.R. 1994. The Influence of Rice Protein on Rice Quality. Dalam:Marshall, W.E. dan Wadsworth, J.I (ed), Rice Science and Technology, hal. 187-190. Marcel Dekker, New York.
Harborne, J.B., 1987. Metode Fotokimia : Penuntun Cara Modern Menganalisa Tumbuhan. ITB, Bandung.
Harini, S., Roekistiningsih, dan Rahmi, Y. 2013. Perbedaan Nilai Indeks Glikemik Beras Hitam (Oryza sativa L. indica), Beras Merah (Oryza
nivara) dan Beras Putih (Oryza sativa).
http://fk.ub.ac.id/artikel/id/filedownload/gizi /SETYO%20HARINI.pdf. 2 Juni 2013.
Haryadi. 2008. Teknologi Pengolahan Beras. UGM Press, Yogyakarta. 158-159 Heinonen, I.M., Meyer, A.S. dan Frankel, E.N.. 1998. Antioxidant Activity of
Berry Phenolics on Human Low-Density Lipoprotein and Liposom Oxidation. J Agric FoodChem 46:4107-4112.
Hoahua, H.E., Pan, X., Zao, Z. and Liu, Y.. 1996. Properties of the Pigment in Black Rice. Chinese Rice. Res. News 4(2): 11-12.
Hou, Z., Qin, P., Zhang, Y., Cui, S. dan Ren, G. 2013. Identification of Anthocyanins Isolated from Black Rice (Oryza sativa L.) and their degradation kinetics. Food Research International 50(2):691-697.
Hostinova, E. 2002. Amylolytic Enzymes Produced by the Yeast
116
Jackman, R.L. dan Smith, J.L. 1996. Anthicyanin and Betalains. Dalam: Hendry, G.A.F. dan Houghton, J.D. (ed), Natural Food Colorants, hal. 249-309. Blackie Academic & Professional, Glasgow.
Jackson, R.S. 2000. Wine Science : Principles, Practices, Perception. Academic Press, USA. 273-275.
Jang, S. dan Xu, S. 2009. Lipophilic and Hidrophilic Antioxidants and Their Antioxidant Activities in Purple Rice Bran. J. Agric Food Chem 57:858-862.
Jayaprakasam, B, Vareed, S.K., Olson, L.K. dan Nair, M.G.. 2005. Insulin Secretion by Bioactive Anthocyanins and Anthocyanidins Present in Fruits.
J Agric FoodChem 53:28-31.
Junaidah, H dan Bakar, H.A. 2000. Saccharomycopsis fibuligera : A Unique Yeast. http://fos.ubd.edu.bn/sites/default/files/2000-Paper4.pdf. 8 April 2014.
Kadirantau, D.M.E. 2000. Kajian Isothermi Sorpsi Air (ISA) dan Stabilitas Tepung Ketan selama Penyimpanan. Skripsi. Bogor, Institut Pertanian Bogor.
Kamiyama M., Kishimoto, Y., Tani, M., Andoh, K., Utsunomiya, K., Kondo, K. 2009. Inhibition of Low-Density Lipoprotein Oxidation by Nagano Purple Grape. J. Nutr. Sci. Vitaminol 55:471-478.
Katsube, N, Iwashita, K., Tsushida, T., Yamaki, K. and Kobori, M. 2003. Induction of Apoptosis in Cancer Cells by Bilberry (Vaccinium myrtillus) and the Anthocyanins. J Agric Food Chem 51:68-75.
Kavanagh, K. 2005. Fungal Fermentation System and Products. Dalam:Kavanagh, K. (ed). Fungi:Biology and Aplication. hal.96-97. John Wiley & Sons, Ltd., UK.
Kedare, S.B. dan R.P., Singh. 2011. Genesis and Development of DPPH Method of Antioxidant Assay. J. Food Sci Technol 48(4):412-422.
Khalaf, N.A., Shakya, A.K., Al-Othman, A., El-Agbar, Z. dan Farah, H. 2008. Antioxidant Activity of Some Common Plants. Turk. J. Biol 32:51-55. Kim, B.G., Kim, J.H., Min, S.Y., Shin, K., Kim, J.H., Kim, H.Y., Ryu, S.N. dan
Ahm, J. 2007. Anthocyanin Content in Rice is Related to Expressions Levels of Anthocyanin Biosynthetic Genes. Journal of Plant Biology
117
Koguchi M., Saigusa, N. dan Teramoto, Y. 2010. Antioxidative Activity of Alcoholic Beverage made from Purple Rice (Oryza sativa var. Indica cv.
Shiun). Food. Sci. Technol. Res 16:157-162.
Kong, J.M, Chia, L.S., Goh, N.K., Chia, T.F. and Brouillard, R.. 2003. Analysis and Biological Activities of Anthocyanins. Phytochemistry 64:923-933. Kristamtini, Taryono, Basunanda, P., Murti, R.H., Supriyanta, Widyajanti, S. dan
Sutarno. 2012. Morphological of Genetic Relationships Among Black Rice Landraces from Yogyakarta and Surrounding Areas. APPN J. of Agricultural and Biological Science 7(12): 982-989.
Kusmiadi, R. 2008. Varietas Beras dengan Komposisi Kimiawi Zat Penyusunnya.
http://www.ubb.ac.id/menulengkap.php?judul=Varietas%20Beras%20denga n%20Komposisi%20Kimiawi%20Zat%20Penyusunnya&&nomorurut_artik el=136. 8 Mei 2014.
Lee, J., Durst, R.W., dan Wrostald, R.E. 2005. Determination of Total Monomeric Antocyanin Pigment Content of Fruit Juice, Beverages, Natural Colorants and Wines by the pH Differential Method : Collaborative Study. Journal of AOAC International 88(5):1269-1278.
Liu X.H., Sun, C.Q. dan Wang, X.K. 1995. Studies on the Content of Four Elements Fe, Zn, Ca, and Se in Rice Various Area of China. Acta Agriculturae Universitatis Pekinensis 21(3): 138-142.
Longo, L., Platini, F., Scardino, A., Alabiso, O., Vasapollo, G., dan Tessitore, L. 2008. Autophagy Inhibition Enhances Anthocyanin-Induced Apoptosis in Hepatocellular Carcinoma. Mol. Cancer. Ther 8:2476-2485.
Lukman, A., Anggraini, D., Rahmawati, N., dan Suhaeni, N. 2013. Pembuatan dan Uji Sifat Fisikokimia Pati Beras Ketan Kampar yang Dipragelatinasi.
Jurnal Penelitian Farmasi Indonesia 1(2):67-71.
Lugemwa, F.N., Snyder, A.L., dan Shaikh, K. 2013. Determination of Radical Scavenging Activity and Total Phenols of Wine and Spices L A Randomized Study. Antioxidants 2:110-121.
Lund, A. dan Lund, M. 2013. Friedman Test in SPSS. https://statistics.laerd.com/ spss-tutorials/friedman-test-using-spss-statistics.php. 10 April 2014.
Makfoeld, D. 1992. Polifenol. PAU Pangan dan Gizi UGM, Yogyakarta. 4-6. Mambrasar, R.H., Prasetyo, B. dan Martosupono, M. 2010. Antioksidan dan
118
Marinova, G. dan Batchvarov, V. 2011. Evaluation of Methods for Determination of the Free Radical Scavenging Activity by DPPH. Bulgarian Journal of Agricultural Science 17(1):11-24.
Maturin, L. dan Peeler, J.T. 2001. Bam:Aerobic Plate Count. http://www.fda.gov/ food/foodscienceresearch/laboratorymethods/ucm063346.htm.12 November 2013.
McCarthy, M. 2011. Measurement of TA and pH. http://www.crcv.com.au/ resources/Grape%20and%20Wine%20Quality/Workshop%20Notes/Measur ing%20TA%20and%20pH.pdf. 14 April 2014.
McKelvey, S.M. dan Murphy, R.A. 2011. Biotechnological Use of Fungal Enzymes. Dalam:Kavanagh, K.(ed). Fungi:Biology and Aplication sec. ed. hal.188-200. John Wiley & Sons, Ltd., UK.
Miyazaki, K., Makino, K., Iwadate, E., Deguchi, Y., dan Ishikawa, F. 2008. Anthocyanins from Purple Sweet Potato Ipomoea batatas Cultivar Ayamurasaki Suppress The Development of Antherosclerotic Lesions and Both Enhancements of Oxidative Stress and Soluble Vascular Cell Adhesion Molecule-1 in Apolipoprotein E-Deficient Mice. J. Agric. Food Chem 56: 11485-11492.
Molyneux, P. 2004. The use of the stable free radical diphenylpicrylhidrazyl (DPPH) for estimating antioxidant activity. J. Sci. Technol 26(2):211-219. Muchtadi, D. 2012. Pangan Fungsional dan Senyawa Bioaktif. Alfabeta,
Bandung. 1-5.
Nailufar, A.A., Basito dan Anam, C. 2012. Kajian Karakteristik Ketan Hitam (Oryza sativa glutinosa) pada Beberapa Jenis Pengemas Selama Penyimpanan. Jurnal Teknosains Pangan 1(1):121-132.
Natsumi T. dan Noriko, O. 1994. Physicochemical Properties of Kurogome, a Japanese Native Black Rice. Gifu Women’s Coll 23: 105 -113.
Navarro, A.R., Sepulveda, M.C. dan Rubio, M.C. 2000. Bioconcentration of vinasse from alcoholic fermentation of sugar cane molase. Waste Management 20:581-585.
Nave, R. 2005. The CIE Color Space. http://hyperphysics.phy-astr.gsu.edu/ hbase/vision/imgvis/cie4.gif. 14 April 2014.
119
Palaniveloo, K dan Vairappan, C.S. 2013. Biochemical properties of rice wine produced from three different starter cultures. Journal of Tropical Biology and Conservation 10:31-41.
Park, Sam, Y., Kim, S-J dan Chang, H-I. 2008. Isolation of Anthocyanin from Black Rice (Heugjinjubyeo) and Screening of its Antioxidant Activities. J. Microbiol. Biotechnol 36(1):55-60.
Patras, A., Brunton, N.P., O’Donnel, C. dan Tiwari, B.K. 2010. Effect of Thermal
Processing on Anthocyanin Stability in Foods; Mechanisms and Kinetics of Degradation. Trends in Food Science & Technology 21:3-11.
Pietta, P. 2000. Flavonoids as Antioxidants : Reviews. J. Nat. Prod. 63:1035-042. Pokorny, J., Yanishlieva, N., dan Gordon M. 2008. Antioxidants in Food :
Practical Application. Woodhead Publishing Limited, London. Prakash, A. 2001. Antioxidant Activity. Med. Lab. Anal Prog. 19(2):1-6.
Qiu L.C., Pan, J. dan Dan, B.W. 1993. The Mineral Nutrient Component and Characteristics of Color and White Brown Rice. Chinese J. Rice Science
7(2): 95-100.
Quan, L.H. 1999. Selection of Yeast for Beverage Production from Black Rice.
Nong Nghiep Cong Nghiep Thue Pham. 8: 375-376.
Ratnaningsih, N. 2010. Ringkasan Potensi Beras Hitam sebagai Sumber Antosianin dan Aplikasinya pada Makanan Tradisional Yogyakarta. http://pilnas.ristek.go.id/karya/index.php/record/view/110927. 1 Juni 2013. Rhee, S.J., Lee, C., Kim, M., Lee, C. 2004. Potential Antioxidant Peptides in Rice
Wine. Journal of Microbiology and Biotechnology 14(4):715-721.
Roosheroe, G., Sjamsuridzal, W., dan Oetari, A. 2014. Mikologi Dasar dan Terapan. Yayasan Pustaka Obor Indonesia, Jakarta. 25-27.
Ryu S. N., Park, S. Z. dan Ho, C.T. 1998. High Performances Liquid Chromatographic Determination of Anthocyanin Pigments in Some varieties of Black Rice. Journal of food and Drug Analysis. 6: 1710-1715.
Simanjuntak, S.G. 2010. Tidak Perlu ke Jepang untuk Minum Sake. http://wisata.kompasiana.com/jalan-jalan/2010/08/23/tidak-perlu-ke-jepang-untuk-minum-sake-lamandau-yang-eksotik-part-1-235681.html. 1 Juni 2013.
120
Sanchez, P.C. 2008. Philipine Fermented Foods : Principles and Technology. The University of Philippines Press, Quezon. 109.
Sastry, S.V.S. 1978. Inheritance of genes Controlling Glume Size, Pericarp Color, and Their Interrelationships in Indica Rice. Oryza 15: 177-179.
Singleton, V.L., Orthofer, R. dan Lamuela-Raventos, R.M. 1999. Methods in Enzymology. Academic Press, USA. 152-161.
Singleton, P. dan Sainsbury, D. 2006. Dictionary of Microbiology and Molecular Biology. John Wiley & Sons Ltd., England. 684.
Spormann, T.M., Albert, F.W., Rath, T., Dietrich, H., Will, F., Stockis, J.P., Eisenbrand, G., dan Janzowski, C. 2008. Anthocyanin Polyphenolic-Rich Fruit Juice Reduces Oxidative Cell Damage in an Intervention Study with Patient on Hemodialysis. Cancer Epidemiol Biomarkers Prev 17:3372-3380.
Suardi, D. dan Ridwan. I. 2009. Beras Hitam, Pangan Berkhasiat yang Belum Populer. Warta P enelitian dan Pengembangan Pertanian 31(2): 9-10. Sudarmadji, S., Hariono, B. dan Suhardi. 1997. Prosedur Analisis untuk Bahan
Makanan dan Pertanian. Liberty, Yogyakarta. 34-35.
Suliartini, N.W.S., Sadimantara, G.R., Wijayanto, T. dan Muhidin. 2011. Pengujian Kadar Antosianin Pagi Gogo Beras Merah Hasil Koleksi Plasma Nutfah Sulawesi Tenggara. Crop Agro 4(2): 43-48.
Sulivan, J. 1998. Anthocyanin. http://www.carnivorousplants.org/cpn/samples/ Science273anthocyanin.htm. 24 April 2014.
Suzuki, M., Kimur, T., Yamagishi, K. dan Yamak, K. 2004. Comparison of Mineral Contents in 8 Cultivars of Pigmented Brown rice. Nippon Shokuhin Kagaku Kogaku Kaishi 51(58): 424-427.
Takashi, I., Bing, X., Yoichi, Y., Masaharu, N. dan Tetsuya, K. 2001. Antioxidant Activity of Anthocyanin Extract from Purple Black Rice. J. Med Food 4: 211-218.
Teramoto, Y., Koguchi, M., Wongwicharn, A dan Saigusa, N. 2011. Production and Antioxidative activity of alcoholic beverages made from Thai ou yeast and Black Rice (Oryza sativa var. Indica cv. Shiun). African Journal of Biotechnology 10(52):10706-10711.
121
Tjitrosoepomo, G. 2005. Taksonomi Tumbuhan Obat-obatan. Gadjah Mada University Press, Yogyakarta.
Tournas, V., Stack, M.E., Mislives, P.B., Koch, H.A. dan Bandler, R. 2001.
BAM:Yeast, Mold an Mycotoxins. http://www.fda.gov/food/food scienceresearch/laboratorymethods/ucm071435.htm. 12 November 2013. U.S. Food and Drug Administration. 2001a. Bam Media M124: Plate Count Agar.
http://www.fda.gov/Food/FoodScienceResearch/LaboratoryMethods /ucm063501.htm. 12 November 2013.
U.S. Food and Drug Administration c. 2001b. Bam Media M183:Dichloran Rose Bengal Chloramphenicol Agar. http://www.fda.gov/Food/FoodScience Research/LaboratoryMethods/ucm064266.htm. 12 November 2013.
U.S. Food and Drug Administration. 2013. Bam Reagents R11: Butterfield’s
Phosphate-Buffered Dilution Water. http://www.fda.gov/Food/Food ScienceResearch/LaboratoryMethods/ucm061208.htm. 12 November 2013.
Velkov, Z.A., Kolev, M.K., dam Tadjer, A.V. 2007. Modeling and Statisical Analysis of DPPH Scavenging Activity of Poliphenolics. ProQuest Science Journal 72(11):1461-1471.
Walter, M. dan Marchesan, E. 2011. Phenolic Compounds and Antioxidant Activity of Rice. Brazilian Archives Biology and Technology 54(1):371-377.
Waterhouse, A. 2012. Folin-Ciocalteau Micro Method For Total Phenol in Wine. http://waterhouse.ucdavis.edu/faqs/folin-ciocalteau-micro-method-for-total-phenol-in-wine. 12 November 2013.
Webb, A. 2010. My Favorite Protein : α-amilase. http://www.bio.davidson.edu/ Courses/Molbio/MolStudents/spring2010/Webb/Starch_GOP_Assay_Kit_P ar_0001_Image_575.gif. 14 April 2014.
Wibowo, D. 1991. Taksonomi Mikrobia Pangan. Pusat Antar Universitas UGM, Yogyakarta.
Winarno, F.G. 2002. Kimia Pangan dan Gizi. Gramedia, Jakarta. 27-33.
Winarsi, H. 2010. Protein Kedelai dan Kecambah. Kanisius, Yogyakarta. 169-170.
122
Yawadio R., Tanimori, S. dan Morita, N. 2007. Identification of Phenolic Compounds Isolated from Pigmented Rice and their Aldose Redustase Inhibitory Activities. Food Chemistry 101(4): 1616-1625.
Yuan, L. C. 2010. Investigating the Extracellular Amylases of Saccharomycopsis fibuligera. http://projectsday.hci.edu.sg/2010/15-FinalsWeb/Cat-01/1-47/ introduction.html. 8 April 2014
Zha, X., Wang, J., Yang, X., Liang, H., Zhao, L., Bao, S., dan Luo, J. 2009. Antioxidant Properties of Polysaccharide Fraction with Different Molecular Mass Extracted with Hot Water from Rice Bran. Carbohydrate Polymers. 78:570-575.
123 LAMPIRAN
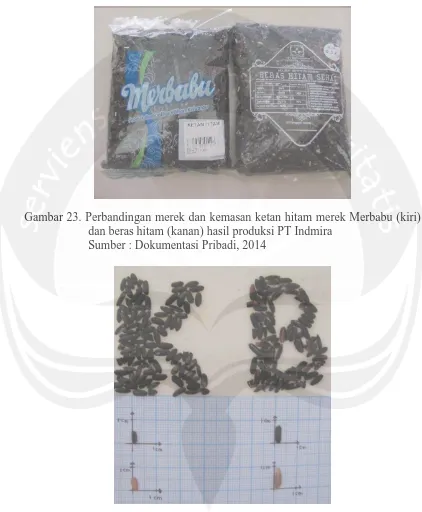
Lampiran 1. Perbandingan ketan hitam dan beras hitam
Gambar 23. Perbandingan merek dan kemasan ketan hitam merek Merbabu (kiri) dan beras hitam (kanan) hasil produksi PT Indmira
Sumber : Dokumentasi Pribadi, 2014
Gambar 24. Perbedaan bentuk dan ukuran bulir ketan hitam (kiri) dan beras hitam (kanan). Bulir beras hitam lebih panjang dan lonjong.
125
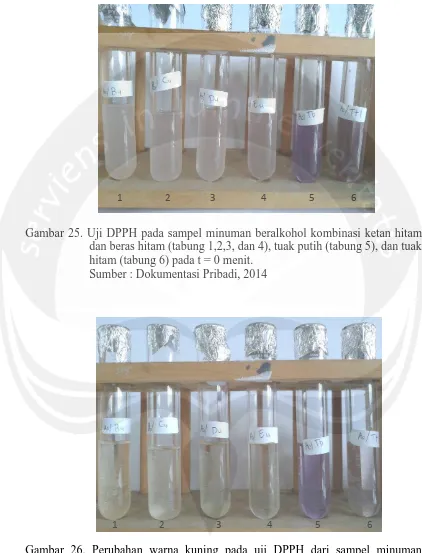
Lampiran 2. Hasil pengujian inhibisi DPPH
Gambar 25. Uji DPPH pada sampel minuman beralkohol kombinasi ketan hitam dan beras hitam (tabung 1,2,3, dan 4), tuak putih (tabung 5), dan tuak hitam (tabung 6) pada t = 0 menit.
Sumber : Dokumentasi Pribadi, 2014
Gambar 26. Perubahan warna kuning pada uji DPPH dari sampel minuman beralkohol kombinasi ketan hitam dan beras hitam (tabung 1,2,3, dan 4), tuak putih (tabung 5), dan tuak hitam (tabung 6) pada t = 20 menit.
Sumber : Dokumentasi Pribadi, 2014
1 2 3 4 5 6
126
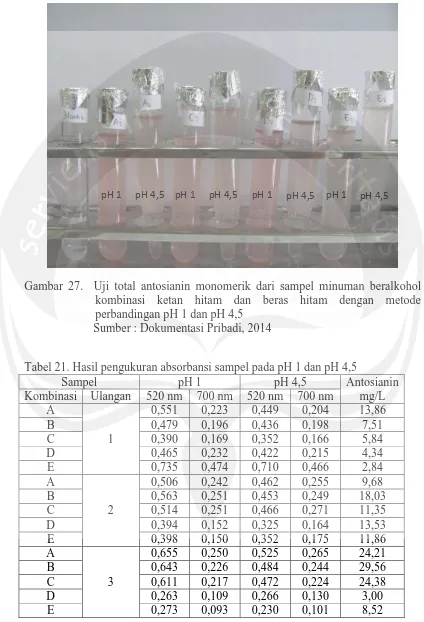
Tabel 17. Hasil pengukuran absorbansi sampel terhadap DPPH
Kombinasi Ulangan Absorbansi c(0) Absorbansi A(t) % Inhibisi A
1
0,245 0,084 65,71%
B 0,245 0,095 61,22%
C 0,245 0,051 79,18%
D 0,245 0,079 67,75%
E 0,245 0,031 87,35%
A
2
0,245 0,031 87,35%
B 0,245 0,050 79,59%
C 0,245 0,041 83,26%
D 0,245 0,022 91,02%
E 0,245 0,024 90,20%
A
3
0,245 0,101 58,78%
B 0,461 0,066 85,683%
C 0,461 0,104 77,44%
D 0,461 0,066 85,68%
E 0,461 0,054 88,29%
Tabel 18. Persen inhibisi DPPH oleh minuman beralkohol dari kombinasi ketan hitam dan beras hitam
Ulangan Kombinasi
A B C D E
1 65,71% 61,22% 79,18% 67,75% 87,35%
2 87,35% 79,59% 83,26% 91,02% 90,20%
3 58,78% 85,68% 74,44% 85,68% 88,29%
Rata-rata 70,61% 75,50% 79,96% 81,61% 88,61% Tabel 19. Deskripsi hasil inhibisi DPPH pada perbedaan kombinasi ketan hitam
dan beras hitam
Kombinasi N Rata-rata Std. Deviasi Std. Eror Tingkat Kepercayaan 95% Interval Rata-rata
Min Maks Batas
Bawah
Batas Atas
ketan100 3 70,61 14,90 8,60 33,59 107,63 58,78 87,35 ketan75beras25 3 75,50 12,73 7,35 43,87 107,13 61,22 85,68 ketan50beras50 3 79,96 2,99 1,73 72,54 87,39 77,44 83,26 ketan25beras75 3 81,61 12,19 7,04 51,21 111,76 67,75 91,02 beras100 3 88,61 1,46 0,84 84,95 92,23 87,35 90,20 Total 15 79,23 10,80 2,79 73,25 85,21 58,78 91,02 Tabel 20. Hasil ANOVA pengaruh kombinasi ketan hitam dan beras hitam
terhadap inhibisi DPPH
Jumlah Kuadrat Df Rata-Rata Kuadrat F Sig.
Antar Kelompok 545,50 4 136,38 1,25 0,35
Dalam Kelompok 1087,55 10 108,75
127
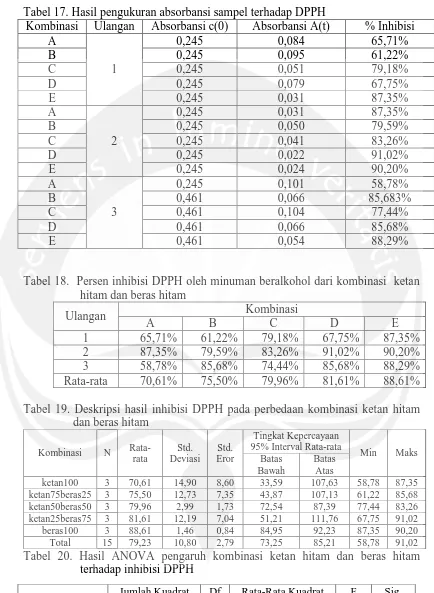
Lampiran 3. Hasil pengujian kandungan total antosianin monomerik
Gambar 27. Uji total antosianin monomerik dari sampel minuman beralkohol kombinasi ketan hitam dan beras hitam dengan metode perbandingan pH 1 dan pH 4,5
Sumber : Dokumentasi Pribadi, 2014
Tabel 21. Hasil pengukuran absorbansi sampel pada pH 1 dan pH 4,5
Sampel pH 1 pH 4,5 Antosianin
mg/L Kombinasi Ulangan 520 nm 700 nm 520 nm 700 nm
A
1
0,551 0,223 0,449 0,204 13,86
B 0,479 0,196 0,436 0,198 7,51
C 0,390 0,169 0,352 0,166 5,84
D 0,465 0,232 0,422 0,215 4,34
E 0,735 0,474 0,710 0,466 2,84
A
2
0,506 0,242 0,462 0,255 9,68
B 0,563 0,251 0,453 0,249 18,03
C 0,514 0,251 0,466 0,271 11,35
D 0,394 0,152 0,325 0,164 13,53
E 0,398 0,150 0,352 0,175 11,86
A
3
0,655 0,250 0,525 0,265 24,21
B 0,643 0,226 0,484 0,244 29,56
C 0,611 0,217 0,472 0,224 24,38
D 0,263 0,109 0,266 0,130 3,00
E 0,273 0,093 0,230 0,101 8,52
128
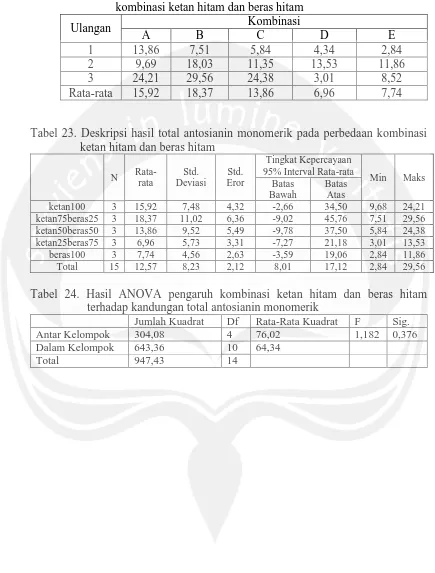
Tabel 22. Total antosianin monomerik dalam minuman beralkohol dari kombinasi ketan hitam dan beras hitam
Ulangan Kombinasi
A B C D E
1 13,86 7,51 5,84 4,34 2,84
2 9,69 18,03 11,35 13,53 11,86
3 24,21 29,56 24,38 3,01 8,52
Rata-rata 15,92 18,37 13,86 6,96 7,74
Tabel 23. Deskripsi hasil total antosianin monomerik pada perbedaan kombinasi ketan hitam dan beras hitam
N Rata-rata
Std. Deviasi
Std. Eror
Tingkat Kepercayaan 95% Interval Rata-rata
Min Maks Batas
Bawah
Batas Atas
ketan100 3 15,92 7,48 4,32 -2,66 34,50 9,68 24,21 ketan75beras25 3 18,37 11,02 6,36 -9,02 45,76 7,51 29,56 ketan50beras50 3 13,86 9,52 5,49 -9,78 37,50 5,84 24,38 ketan25beras75 3 6,96 5,73 3,31 -7,27 21,18 3,01 13,53 beras100 3 7,74 4,56 2,63 -3,59 19,06 2,84 11,86 Total 15 12,57 8,23 2,12 8,01 17,12 2,84 29,56
Tabel 24. Hasil ANOVA pengaruh kombinasi ketan hitam dan beras hitam terhadap kandungan total antosianin monomerik
Jumlah Kuadrat Df Rata-Rata Kuadrat F Sig.
Antar Kelompok 304,08 4 76,02 1,182 0,376
Dalam Kelompok 643,36 10 64,34
129
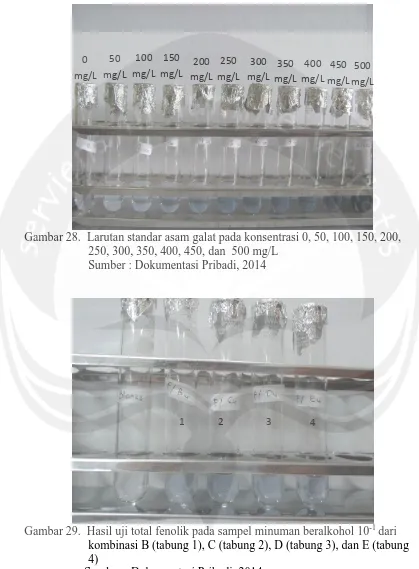
Lampiran 4. Hasil pengujian total fenolik
Gambar 28. Larutan standar asam galat pada konsentrasi 0, 50, 100, 150, 200, 250, 300, 350, 400, 450, dan 500 mg/L
Sumber : Dokumentasi Pribadi, 2014
Gambar 29. Hasil uji total fenolik pada sampel minuman beralkohol 10-1 dari kombinasi B (tabung 1), C (tabung 2), D (tabung 3), dan E (tabung 4)
Sumber : Dokumentasi Pribadi, 2014 50
mg/L 100 mg/L
150 mg/L
200 mg/L
250 mg/L
300 mg/L
350 mg/L
400 mg/L
450 mg/L
500 mg/L 0
mg/L
130
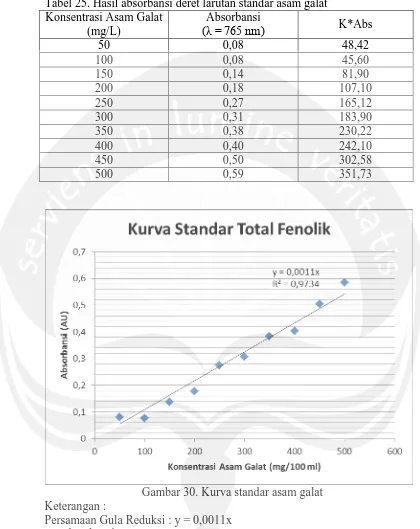
Tabel 25. Hasil absorbansi deret larutan standar asam galat Konsentrasi Asam Galat
(mg/L)
Absorbansi
(λ = 765 nm) K*Abs
50 0,08 48,42
100 0,08 45,60
150 0,14 81,90
200 0,18 107,10
250 0,27 165,12
300 0,31 183,90
350 0,38 230,22
400 0,40 242,10
450 0,50 302,58
500 0,59 351,73
Gambar 30. Kurva standar asam galat Keterangan :
Persamaan Gula Reduksi : y = 0,0011x y = absorbansi
131
Tabel 26. Hasil absorbansi sampel dalam uji total fenolik
Kombinasi Ulangan Absorbansi Total Fenolik (GAE mg/L) A
1
0,093 845,45
B 0,064 581,82
C 0,058 527,27
D 0,051 463,64
E 0,131 1.190,91
A
2
0,104 945,45
B 0,235 2.136,36
C 0,090 818,18
D 0,137 1.245,45
E 0,113 1.027,27
A
3
0,099 900
B 0,107 972,73
C 0,100 909,09
D 0,120 1.090,91
E 0,117 1.063,64
Tabel 27. Total fenolik (GAE mg/L) minuman beralkohol dari kombinasi ketan hitam dan beras hitam
Ulangan Kombinasi
A B C D E
1 845,454 581,818 527,273 463,636 1190,91 2 945,45 2136,36 818,18 1245,45 1027,27
3 900 927,727 909,09 1090,909 1063,636
Rata-rata 896,97 1.215,30 751,51 933,33 1.093,94 Tabel 28. Deskripsi hasil total fenolik pada perbedaan kombinasi ketan hitam dan
beras hitam
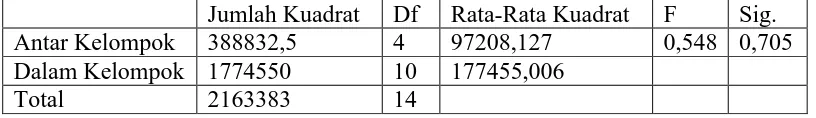
Tabel 29. Hasil ANOVA pengaruh kombinasi ketan hitam dan beras hitam terhadap kandungan total fenolik
N Rata-rata Std. Deviasi
Std. Eror
Tingkat Kepercayaan 95% Interval Rata-rata
Min Maks
Batas Bawah
Batas Atas
ketan100 3 896,97 50,07 28,91 772,59 1021,34 845,45 945,45
ketan75beras25 3 1215,30 816,19 471,23 -812,24 3242,84 581,82 2136,36
ketan50beras50 3 751,51 199,45 115,15 256,06 1246,97 527,27 909,09
ketan25beras75 3 933,33 414,04 239,05 -95,21 1961,87 463,63 1245,45
beras100 3 1093,94 86,92 49,61 880,49 1307,39 1027,27 1190,91
Total 15 978,21 393,10 101,50 760,52 1195,90 436,64 2136,36
Jumlah Kuadrat Df Rata-Rata Kuadrat F Sig. Antar Kelompok 388832,5 4 97208,127 0,548 0,705 Dalam Kelompok 1774550 10 177455,006
132
Lampiran 5. Hasil pengujian kadar etanol
Tabel 30. Kadar etanol minuman beralkohol dari kombinasi ketan hitam dan beras hitam
Ulangan Kombinasi
A B C D E
1 14,45% 15,68% 13,05% 9,17% 7,82%
2 11,59% 12,37% 10,45% 10,63% 6,88%
3 13,27% 12,93% 14,24% 10,08% 10,49%
Rata-rata 13,10% 13,66% 12,58% 9,96% 8,40% Tabel 31. Deskripsi hasil kadar etanol pada perbedaan kombinasi ketan hitam dan
beras hitam
N Rata-rata Std. Deviasi Std. Eror Tingkat Kepercayaan 95% Interval Rata-rata
Min Maks Batas
Bawah
Batas Atas
ketan100 3 13,10 1,44 0,83 9,53 16,67 11,59 14,45 ketan75beras25 3 13,66 1,77 1,02 9,25 18,06 12,37 15,68 ketan50beras50 3 12,58 1,94 1,12 7,77 17,39 10,45 14,24 ketan25beras75 3 9,96 0,74 0,43 8,12 11,80 9,17 10,63 beras100 3 8,40 1,87 1,08 3,75 13,05 6,88 10,49 Total 15 11,54 2,49 0,64 10,16 12,92 6,88 15,68
Tabel 32. Hasil ANOVA pengaruh kombinasi ketan hitam dan beras hitam terhadap kadar etanol
Tabel 33. Hasil uji duncan perbedaan kombinasi ketan hitam dan beras hitam terhadap kadar etanol
Kombinasi N Bagian Alfa = 0,05
1 2 3
Duncana
beras100 3 8,40
ketan25beras75 3 9,96 9,96
ketan50beras50 3 12,58 12,58
ketan100 3 13,10
ketan75beras25 3 13,66
Sig. 0,264 0,075 0,453
a. Penggunaan rata-rata ukuran sampel = 3,000 Sumber
Variasi
Jumlah Kuadrat (JK)
Derajat bebas (db)
Rata-Rata Kuadrat (RK)
F Sig.
Perlakuan 61,11 4 15,27 5,867 0,011
Sesatan 26,04 10 2,60
135
Lampiran 6. Hasil pengujian kandungan gula reduksi
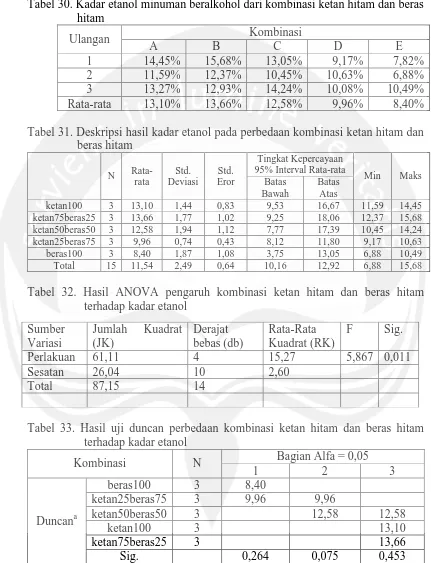
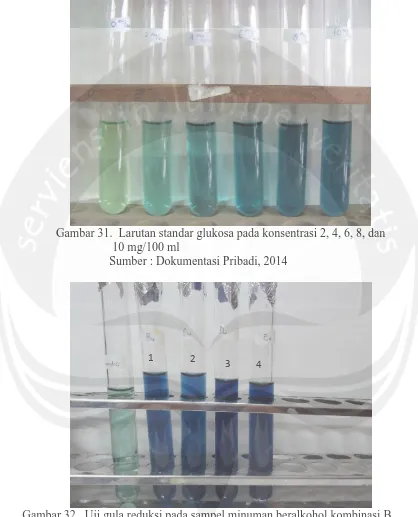
Gambar 31. Larutan standar glukosa pada konsentrasi 2, 4, 6, 8, dan 10 mg/100 ml
Sumber : Dokumentasi Pribadi, 2014
Gambar 32. Uji gula reduksi pada sampel minuman beralkohol kombinasi B (tabung 1), C (tabung 2), D (tabung 3), dan E (tabung 4)
Sumber : Dokumentasi Pribadi, 2014
1 2
136
Tabel 34. Hasil absorbansi deret larutan standar glukosa Konsentrasi Glukosa
(mg/100 ml)
Absorbansi
(λ = 540 nm) K*Abs
2 0,07 43,20
4 0,17 103,86
6 0,24 143,70
8 0,34 205,20
10 0,43 259,98
Gambar 33. Kurva standar glukosa Keterangan :
Persamaan Gula Reduksi : y = 0,04x – 0,01 y = absorbansi
137
Tabel 35. Hasil absorbansi sampel dalam uji gula reduksi
Kombinasi Ulangan Absorbansi Gula Reduksi (mg/100ml) A
1
0,356 9.150
B 0,530 13.500
C 0,587 14.925
D 0,823 20.825
E 0,138 (10-4) 37.000
A
2
0,644 16.350
B 0,508 12.950
C 0,677 17.175
D 0,738 18.700
E 0,889 22.575
A
3
0,518 13.200
B 0,728 18.450
C 0,607 15.425
D 0,120 (10-4) 32.500
E 0,112 (10-4) 30.500
Tabel 36. Deskripsi hasil kandungan gula reduksi pada perbedaan kombinasi ketan hitam dan beras hitam
Tabel 37. Hasil ANOVA pengaruh kombinasi ketan hitam dan beras hitam terhadap kandungan gula reduksi
Tabel 38. Hasil uji Duncan perbedaan kombinasi ketan hitam dan beras hitam terhadap kandungan gula reduksi
Kombinasi N Bagian Alfa = 0,05
1 2 3
Duncana
ketan100 3 12.900,00
ketan75beras25 3 14.966,67 14.966,67 ketan50beras50 3 15.841,67 15.481,67
ketan25beras75 3 24.008,33 24.008,33
Beras100 3 30.085,67
Sig. 0,515 ,064 0,175
a. Penggunaan rata-rata ukuran sampel = 3,00 N Rata-rata Std.
Deviasi Std. Eror
Tingkat Kepercayaan 95%
Interval Rata-rata Min Maks
Batas Bawah Batas Atas
ketan100 3 12.900,00 3.609,36 2.083,87 3.933,75 21.866,15 9.150 16.350
ketan75beras25 3 14.966,67 3.029,16 1.748,89 7.441,81 22.491,53 12.950 18.450
ketan50beras50 3 15.841,67 1.191,45 682,11 12.906,77 18.776,56 14.925 17.175
ketan25beras75 3 24.008,33 7.430,36 4.289,92 5.550,30 42.466,36 18.700 32.500
beras100 3 30.085,67 7.130,53 4.116,82 12.372,44 47.798,90 22.757 37.000
Total 15 19.560,47 7.968,15 2.057,37 15.147,85 23.973,08 9.150 37.000
Jumlah Kuadrat Df Rata-Rata Kuadrat F Sig.
Antar Kelompok 629.572.923,1 4 157.393.230,8 6,070 0,010
Dalam Kelompok 259.307.782,7 10 25.930.778,27
138
Lampiran 7. Hasil pengujian total asam tertitrasi
Tabel 39. Hasil titrasi sampel dalam uji total asam tertitrasi Kombinasi Ulangan Vol. NaOH 0,1 N
(ml)
Total Asam Tertitrasi (g/100ml) A
1
6,7 0,87
B 7,5 0,97
C 7,7 1,00
D 7,7 1,00
E 5,8 0,75
A
2
7,7 1,00
B 7,6 0,98
C 6,1 0,79
D 8,2 1,06
E 8,7 1,13
A
3
7,4 0,96
B 7,8 1,01
C 8,2 1,06
D 7,8 1,01
E 8,6 1,11
Perhitungan
Asam asetat g/100 ml = volume NaOH x N NaOH x 0,060 x 100 volume sampel
Tabel 40. Kandungan total asam tertitrasi (mg/100 ml) minuman beralkohol dari kombinasi ketan hitam dan beras hitam
Ulangan Total Asam Tertitrasi (g/100ml) pada Kombinasi
A B C D E
1 0,87 0,97 1,00 1,00 0,75
2 1,00 0,98 0,79 1,06 1,13
3 0,96 1,01 1,06 1,01 1,11
Rata-rata 0,94 0,99 0,95 1,02 1,00
Tabel 41. Hasil ANOVA pengaruh kombinasi ketan hitam dan beras hitam terhadap total asam tertitrasi
Jumlah Kuadrat Df Rata-Rata Kuadrat F Sig.
Antar Kelompok 0,014 4 0,004 0,244 0,907
Dalam Kelompok 0,144 10 0,014
139
Lampiran 8. Hasil pengujian derajat keasaman (pH)
Tabel 42. Derajat keasaman (pH) minuman beralkohol dari kombinasi ketan hitam dan beras hitam
Ulangan Kombinasi
A B C D E
1 4,02 3,96 3,97 3,89 3,98
2 4,26 3,83 4,18 4,31 3,78
3 3,93 3,87 3,85 3,88 3,87
Rata-rata 4,07 3,89 4,00 4,03 3,88
Tabel 43. Deskripsi hasil derajat keasaman (pH) pada perbedaan kombinasi ketan hitam dan beras hitam
Tabel 44. Hasil ANOVA pengaruh kombinasi ketan hitam dan beras hitam terhadap derajat keasaman (pH)
N Rata-rata Std.
Deviasi Std. Eror
Tingkat Kepercayaan 95% Interval Rata-rata
Min Maks
Batas Bawah
Batas Atas
ketan100 3 4,07 0,17 0,10 3,65 4,49 3,93 4,26
ketan75beras25 3 3,89 0,07 0,04 3,72 4,05 3,83 3,96
ketan50beras50 3 4,00 0,17 0,10 3,58 4,41 3,85 4,18
ketan25beras75 3 4,03 0,24 0,14 3,42 4,64 3,88 4,31
beras100 3 3,88 0,10 0,06 3,63 4,12 3,78 3,98
Total 15 3,97 0,16 0,04 3,88 4,06 3,78 4,31
Jumlah Kuadrat Df Rata-Rata Kuadrat F Sig.
Antar Kelompok 0,09 4 0,02 0,85 0,53
Dalam Kelompok 0,26 10 0,03
140
[image:30.595.89.511.140.702.2]Lampiran 9. Hasil analisis data statistik dalam uji organoleptik
Gambar 34. Minuman beralkohol kombinasi ketan hitam dan beras hitam pada kombinasi A (100% ketan hitam), B (75% ketan hitam dan 25% beras hitam), C (50% ketan hitam dan 50% beras hitam), D (25% ketan hitam dan 75% beras hitam), dan E (100% beras hitam) Sumber : Dokumentasi Pribadi, 2014
141
Tabel 45. Hasil pengujian organoleptik terhadap tingkat kesukaan panelis pada minuman beralkohol dari kombinasi ketan hitam dan beras hitam
Panelis
Hedonic Test
Ranking Test
Warna Aroma Rasa
A B C D E A B C D E A B C D E A B C D E
1 4 2 3 4 5 3 3 2 3 2 2 3 1 4 4 2 3 5 4 1
2 4 2 2 5 5 3 3 2 2 3 3 4 2 1 4 3 2 4 5 1
3 4 1 3 5 5 3 1 1 4 5 1 4 5 4 5 3 1 2 4 5
4 3 3 2 2 4 2 2 2 3 2 2 3 3 4 5 4 3 5 2 1
5 2 2 4 2 5 4 4 4 4 5 2 3 3 4 4 1 2 4 3 5
6 5 4 2 2 4 4 3 3 2 4 4 3 2 2 2 1 2 3 4 5
7 5 4 3 4 3 5 4 4 4 4 4 5 5 3 5 4 2 1 5 3
8 4 3 1 4 1 4 4 3 5 1 4 5 1 4 3 2 1 5 4 3
9 4 3 3 3 4 4 4 2 2 4 4 3 2 2 3 1 2 5 4 3
10 5 5 3 5 1 4 4 3 5 4 3 3 3 5 5 1 2 3 5 4
11 3 3 4 2 2 3 3 3 4 4 3 4 2 2 2 4 3 1 5 2
12 4 4 3 3 5 4 4 3 3 2 3 3 2 1 1 1 2 4 5 3
13 5 4 2 3 2 2 5 3 3 4 2 4 5 2 3 1 3 2 5 4
14 4 5 2 4 1 4 5 4 4 3 5 5 5 2 2 2 1 3 4 5
15 2 2 2 2 2 3 2 3 3 3 4 4 4 2 5 3 2 4 5 1
16 3 4 2 5 1 1 3 2 5 4 2 3 4 4 3 5 3 2 1 4
17 4 4 4 4 3 5 4 2 3 1 2 3 4 4 2 1 3 2 4 5
18 4 4 5 4 5 2 4 4 5 2 2 5 5 3 4 5 1 2 3 4
19 3 3 3 3 4 4 2 2 2 3 4 5 5 3 4 3 1 4 5 2
20 5 5 4 4 1 3 3 3 3 3 4 4 5 4 2 2 3 1 4 5
21 4 1 1 4 1 2 2 4 4 4 2 2 4 4 4 1 2 5 4 3
22 4 3 2 3 1 4 4 3 4 3 4 3 4 3 4 1 5 2 4 3
23 5 4 4 4 4 5 5 3 3 3 4 5 3 3 3 2 1 4 3 5
24 4 4 4 4 4 4 3 4 3 4 2 4 5 3 5 5 3 2 4 1
25 3 3 2 4 1 3 2 2 5 1 2 4 2 1 5 3 1 4 5 2
26 4 3 2 1 3 2 2 2 3 3 1 2 2 1 4 3 2 4 5 1
27 3 3 4 5 5 4 3 2 4 4 2 4 2 4 5 5 3 4 2 1
28 5 4 3 3 2 3 4 4 3 4 4 3 3 4 3 1 3 2 4 5
29 4 4 3 3 2 4 4 3 3 2 1 1 1 1 2 3 4 2 5 1
30 4 3 2 5 1 5 1 3 2 4 4 3 2 5 1 1 4 3 2 5
Keterangan :
[image:31.595.104.540.140.670.2]142
Tabel 46. Deskripsi hasil kesukaan panelis terhadap warna minuman beralkohol dari lima kombinasi ketan hitam dan beras hitam
Tabel 47. Deskripsi hasil kesukaan panelis terhadap aroma minuman beralkohol dari lima kombinasi ketan hitam dan beras hitam
Tabel 48. Deskripsi hasil kesukaan panelis terhadap rasa minuman beralkohol dari lima kombinasi ketan hitam dan beras hitam
Tabel 49. Hasil uji statistik Friedman kesukaan panelis terhadap warna, aroma dan rasa minuman beralkohol dari kombinasi ketan hitam dan beras hitam
Parameter N Chi-Square Df Sig
Warna 30 16,46 4 0,002
Aroma 30 8,70 4 0,07
Rasa 30 7,40 4 0,12
N
Rata-rata
Std.
Deviasi Min Maks
Persentil Ke
25
Ke 50 (median) Ke
75
ketan100 30 3,90 0,84 2 5 3,00 4,00 4,25
ketan75beras25 30 3,30 1,05 1 5 3,00 3,00 4,00
ketan50beras50 30 2,80 1,00 1 5 2,00 3,00 4,00
ketan25beras75 30 3,53 1,11 1 5 3,00 4,00 4,00
beras100 30 2,90 1,60 1 5 1,00 3,00 4,25
N
Rata-rata
Std.
Deviasi Min Maks
Persentil
Ke 25 Ke 50
(median)
Ke 75
ketan100 30 3,43 1,04 1 5 3,00 4,00 4,00
ketan75beras25 30 3,23 1,10 1 5 2,00 3,00 4,00
ketan50beras50 30 2,83 0,83 1 4 2,00 3,00 3,25
ketan25beras75 30 3,43 0,97 2 5 3,00 3,00 4,00
beras100 30 3,17 0,12 1 5 2,00 3,00 4,00
N Rata-rata Std.
Deviasi Min Maks
Persentil Ke 25 Ke 50
(median)
Ke 75
ketan100 30 2,87 1,137 1 5 2,00 3,00 4,00
ketan75beras25 30 3,57 1,01 1 5 3,00 3,50 4,00
ketan50beras50 30 3,20 1,40 1 5 2,00 3,00 5,00
ketan25beras75 30 2,97 1,24 1 5 2,00 3,00 4,00
143
Tabel 50. Hasil deskripsi statistik dari data ranking minuman beralkohol kombinasi ketan hitam dan beras hitam
Kombinasi N Persentil
Ke 25 Ke 50 (median) Ke 75
A 30 1,00 2,00 3,25
B 30 1,75 2,00 3,00
C 30 2,00 3,00 4,00
D 30 3,75 4,00 5,00
E 30 1,00 3,00 5,00
Tabel 51. Hasil rata-rata ranking minuman beralkohol kombinasi ketan hitam dan beras hitam
Kombinasi Rata-Rata Ranking
A 2,47
B 2,33
C 3,13
D 3,97
E 3,10
Tabel 52. Hasil uji Friedman terhadap penentuan peringkat minuman beralkohol dari kombinasi ketan hitam dan beras hitam
N 30
Chi-Square 20,293
Df 4
Asymp. Sig. 0,000
Tabel 53. Hasil uji Wilcoxon terhadap penentuan peringkat minuman beralkohol dari kombinasi ketan hitam dan beras hitam
B-A C-A D-A E-A C-B D-B E-B D-C E-C E-D Z -0,56 -1,69 -3,15 -1,48 -2,22 -3,87 -1,80 -2,38 -0,16 -1,99 Asymp.
Sig. (2-tailed)
[image:33.595.85.513.121.682.2]144
Lampiran 10. Hasil uji mikrobiologi minuman beralkohol
Tabel 54. Hasil koloni dalam uji angka lempeng total minuman beralkohol
Kombinasi Ulangan 10
0
10-1 10-2
A B A B A B
A
1
3 0 0 1 1 0
B 0 0 1 1 0 1
C 0 0 0 0 0 0
D S S 182 142 0 1
E 127 155 50 33 2 1
A
2
0 0 5 4 5 2
B 0 0 10 9 9 17
C 0 0 12 3 2 0
D 0 0 0 0 0 0
E 69 13 S 12 S TNTC
A
3
0 0 0 0 0 5
B 5 4 1 S 0 1
C 4 11 4 S 0 0
D 111 166 8 S 1 0
[image:34.595.89.517.145.536.2]E 81 50 30 S 6 8
Gambar 36. Hasil ALT minuman beralkohol kombinasi A (100% ketan hitam) dan kombinasi B (75% ketan hitam dan 25% beras hitam)
[image:34.595.228.418.590.710.2]Sumber : Dokumentasi pribadi, 2014
Gambar 37. Hasil ALT minuman beralkohol kombinasi C (50% ketan hitam dan 50% beras hitam)
145
Gambar 38. Hasil ALT minuman beralkohol kombinasi D (25% ketan hitam dan 75% beras hitam) dan kombinasi E (100% beras hitam)
[image:35.595.84.524.266.684.2]Sumber : Dokumentasi pribadi, 2014
Tabel 55. Hasil Koloni dalam Uji Kapang dan Khamir Minuman Beralkohol
Kombinasi Ulangan 10
0
10-1 10-2
A B A B A B
A
1
1 0 0 0 0 0
B 1 9 2 0 0 0
C 0 0 0 0 0 0
D TNTC TNTC 63 93 11 4
E TNTC TNTC TNTC TNTC 189 165
A
2
0 0 0 0 0 0
B 21 31 4 5 0 0
C 0 0 0 0 0 0
D 248 59 66 84 3 16
E 5 3 16 0 0
A
3
0 0 0 0 0 0
B 22 24 1 2 1 0
C 0 0 0 0 0 0
D TNTC TNTC 145 64 7 21
E TNTC TNTC 344 593 0 0
Gambar 39. Hasil kapang dan khamir minuman beralkohol kombinasi A (100% ketan hitam) dan kombinasi B (75% ketan hitam dan 25% beras hitam)
146
Gambar 40. Hasil kapang dan khamir minuman beralkohol kombinasi C (50% ketan hitam dan 50% beras hitam)
Sumber : Dokumentasi pribadi, 2014
Gambar 41. Hasil kapang dan khamir minuman beralkohol kombinasi D (25% ketan hitam dan 75% beras hitam) dan kombinasi E (100% beras hitam)
Sumber : Dokumentasi pribadi, 2014
Tabel 56. Hasil koloni dalam uji S. aureus minuman beralkohol
Kombinasi Ulangan 10
0
Hasil
A B
A
1
0 0 Negatif/ml
B 0 0 Negatif/ml
C 0 0 Negatif/ml
D 0 0 Negatif/ml
E 0 0 Negatif/ml
A
2
0 0 Negatif/ml
B 0 1 Positif/ml
C 0 0 Negatif/ml
D 0 0 Negatif/ml
E 0 1 Positif/ml
A
3
0 0 Negatif/ml
B 0 0 Negatif/ml
C 0 0 Negatif/ml
D 2 0 Positif/ml
147
Gambar 42. Hasil negatif S. aureus dalam minuman beralkohol Sumber : Dokumentasi pribadi, 2014