17
RESEARCH METHODOLOGY
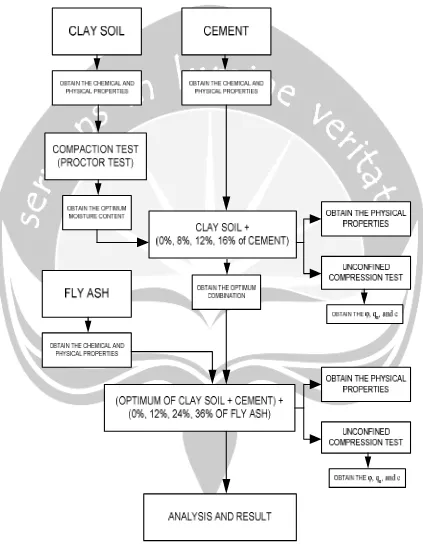
This research aims to study the influence of the addition of fly ash and cement to improve properties of clayey soil., and how number of optimum contain this addition can be applied to stabilize the clayey soil.
III.1. MATERIALS AND INSTRUMENTS
III.1.1. Materials
1. Soil: clay is taken from Dusun Ngablak, Desa Sitimulyo, Kecamatan Piyungan, Kabupaten Bantul, DIY at 1.5 – 2 m depth. The clay has pass sieve no 4.
2. Cement is Portland Cement (PC) Tiga Roda
3. Fly ash: taken from waste of PLTU Karang Kandri (PT. S2P), Cilacap, Central Java.
III.1.2. Instruments
For clay characteristic test and Unconfined Compression test, it was used apparatus from Soil Mechanics Laboratory of Atma Jaya Yogyakarta University.
1. Sieve no 4.
2. Oven
The oven used to dry the clay sample to find out the water content of the clay.
Figure 3.1 Oven 3. Weight scales
Use the weight scales with sensitivity 0.01gram.
Figure 3.2 Weight Scales 4. Mold
For Standard Proctor Test, the clay compacted in this cylinder mold with volume 938.1229 cm3, mold’s diameter 10.15 cm, height 11.60 cm.
5. Split Mold Cylinder
As a tool to mould the sample.
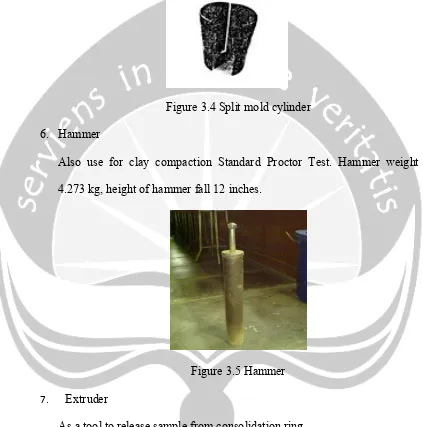
Figure 3.4 Split mold cylinder 6. Hammer
Also use for clay compaction Standard Proctor Test. Hammer weight 4.273 kg, height of hammer fall 12 inches.
Figure 3.5 Hammer
7. Extruder
As a tool to release sample from consolidation ring.
8. Caliper
To measure the dimension of the sample.
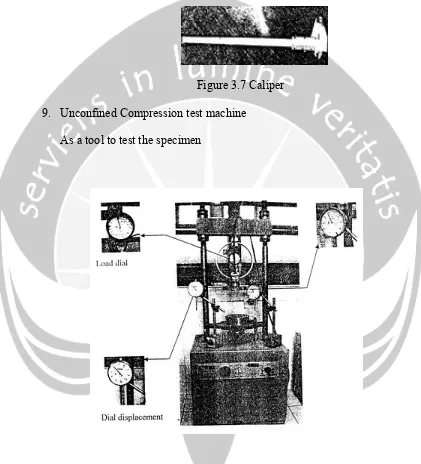
Figure 3.7 Caliper 9. Unconfined Compression test machine
As a tool to test the specimen
III.2. RESEARCH PROCEDURE
III.2.1. Material Test
III.2.1.1. Clay
III.2.1.1.1. Clay Characteristic Test (water content)
The ratio of the weight of water in soil compared to the solid weight. The objective of this test is to investigate the water content of a disturbed soil.
a. Apparatus:
1. Aluminum cup with cover 2. Scale, with sensitivity 0.01 gram 3. Dessicator
4. Oven, able to heathen 105°-110° C b. Procedure:
1. Empty cup was dried and cleaned. Its weight was noted as W1. 2. The disturbed soil was filled into the cup half full. The soil was
weighed together with the cup and its cover as W2.
3. The soil was dried in oven at 105°-110° C for 24 hours with its cover was opened and marked to keep it paired with the cup.
4. After dried, it was taken out and cooled in dessicator. 5. The cup containing dried soil was weighed as W3. c. Formulas:
Water content:
Where,
III.2.1.1.2. Compaction (Standard Proctor Test)
This test in order to set the optimum moisture content (OMC) of soil. This test performed to compacted clay using compacting method, standard ASTM D698-78.
a. Apparatus: 1. Sieve No. 4
2. Mold, to compact the clay 3. Standard compactor 4. Extruder
5. Scale, with sensitivity 0.1 gram 6. Spatula and stick mate
7. Oven, adjustable for 105°-110° C 8. Caliper
b. Procedure:
1. The clay was crushed and sieved using No. 4 and it was made into 6 samples, 2.5 kg each.
2. Each of the samples was added with water, as much as 100 ml, 200 ml, 300 ml, 400 ml, 500 ml, and 600 ml. They were put into separate plastic bags and were left for 24 hours.
3. The main cylinder was cleaned, weighed and recorded. The dimensions were taken.
4. The collar and the cylinder were fixed and the inner surface was lubricated using used oil to ease extruding soil from cylinder. 5. Each sample was compacted by filling it to the cylinder into 3
layers. The compaction pattern followed the standard soil compaction method.
6. The main cylinder was separated from the collar. The upper part was trimmed. After weighed, the soil sample was extruded. It was sampled from its core and its water content was tested.
c. Formulas:
1. Unit weight of soil:
(3.2)
Where,
W1 = Weight of cylinder + dense soil W2 = Weight of cylinder
V = Volume 2. Unit weight of dry soil:
(3.3)
Where,
γ = Unit weight of soil
w = Moisture content
3. Optimum Moisture Content (OMC):
(3.4)
Where,
III.2.1.2. Fly Ash (chemical and mineralogy test)
These test in order to figures the chemical composition of fly ash. Main component of fly ash: silica (SiO2), alumina (Al2O3), and ferrite oxide (Fe2O3), the rest are carbon, calcium, magnesium, and sulfur. Fly ash empirical formula: Si1.0Al0.45Ca0.51Na0.047Fe0.039Mg0.020K0.013Ti0.011.
The data was taken from fly ash source factory (PLTU Cilacap). The content of SiO2+Al2O3+Fe2O3 from fly ash is 66.46%. Based on ASTM C618-80, this fly ash include to Class C type. This type of fly ash has pozzolan characteristic and when it’s mixed with water, it will become hard caused by hydration.
III.2.2. Sample Preparation and Production
III.2.2.1. Sample Preparation
1. The clay was crushed and sieved using No.4, and it was made into 10 samples, 2.5 kg each.
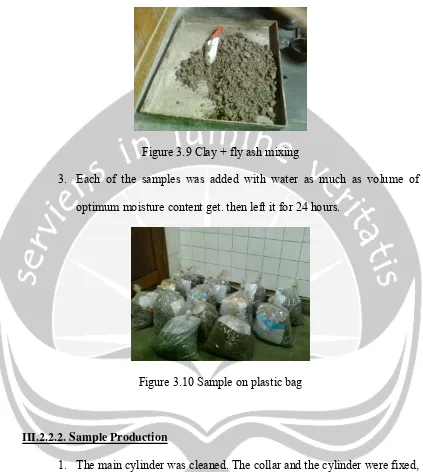
Figure 3.9 Clay + fly ash mixing
3. Each of the samples was added with water as much as volume of optimum moisture content get. then left it for 24 hours.
Figure 3.10 Sample on plastic bag
III.2.2.2. Sample Production
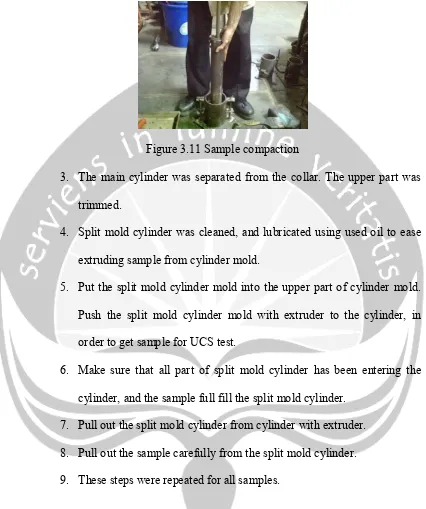
1. The main cylinder was cleaned. The collar and the cylinder were fixed, and the inner surface was lubricated using used oil to ease extruding clay from cylinder.
Figure 3.11 Sample compaction
3. The main cylinder was separated from the collar. The upper part was trimmed.
4. Split mold cylinder was cleaned, and lubricated using used oil to ease extruding sample from cylinder mold.
5. Put the split mold cylinder mold into the upper part of cylinder mold. Push the split mold cylinder mold with extruder to the cylinder, in order to get sample for UCS test.
6. Make sure that all part of split mold cylinder has been entering the cylinder, and the sample full fill the split mold cylinder.
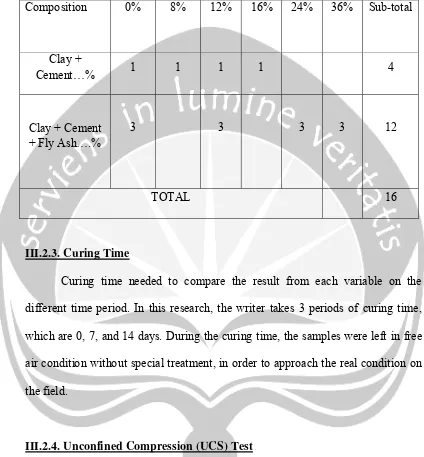
Table 3.1 Total sample for UCS test
Composition 0% 8% 12% 16% 24% 36% Sub-total
Clay +
Cement…% 1 1 1 1 4
Clay + Cement + Fly Ash….%
3 3 3 3 12
TOTAL 16
III.2.3. Curing Time
Curing time needed to compare the result from each variable on the different time period. In this research, the writer takes 3 periods of curing time, which are 0, 7, and 14 days. During the curing time, the samples were left in free air condition without special treatment, in order to approach the real condition on the field.
III.2.4. Unconfined Compression (UCS) Test
a. Apparatus
1. Compression apparatus 2. Extruder
3. Strain dial 4. Stress dial
5. Split mold cylinder 6. Scale, with 0.1 sensitivity 7. Caliper
8. Saw 9. Arch b. Procedure
1. The specimen was placed on a metal plate vertically and placed centered on the base plate of compression apparatus.
2. The compression machine was adjusted so that the top plate would just touch the top of the specimen.
3. All dials were set to zero.
4. He compression machine was started.
5. The stress dial was read for every 25 increment read on strain dial. 6. The loading was stopped when the stress dial showed the same
number or decreasing for three consecutive times. 7. The specimen was taken off the machine.
c. Formulas:
Φ = ( α - 45°) x 2
qu = 2.c.tg (45 +½Φ) Where,
D = Diameter (cm) Lo = Height (cm) B = Weight (gram)
Ao = Initial cross section area (cm²) V = Volume (cm³)
γ = Unit weight (gram/cm³) α = failure angle (°)
Φ = Inner shear angle (°)
III.3. RESEARCH FLOW CHART
32
CHAPTER IV
RESULT AND ANALYSIS
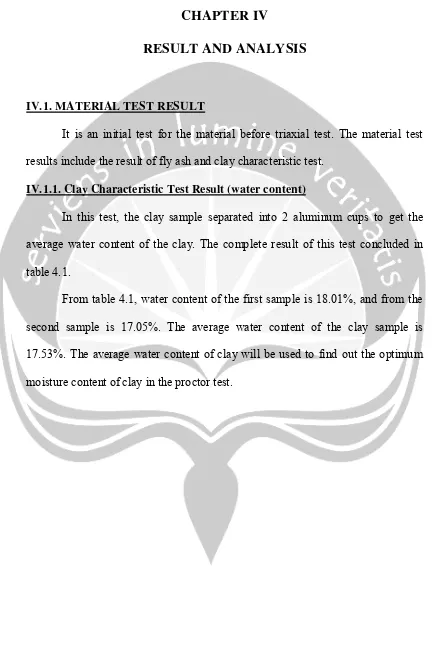
IV.1. MATERIAL TEST RESULT
It is an initial test for the material before triaxial test. The material test results include the result of fly ash and clay characteristic test.
IV.1.1. Clay Characteristic Test Result (water content)
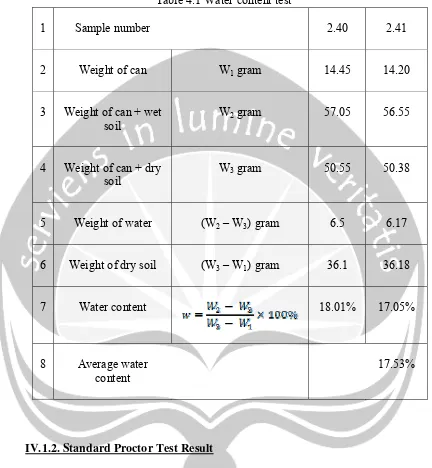
In this test, the clay sample separated into 2 aluminum cups to get the average water content of the clay. The complete result of this test concluded in table 4.1.
Table 4.1 Water content test
IV.1.2. Standard Proctor Test Result
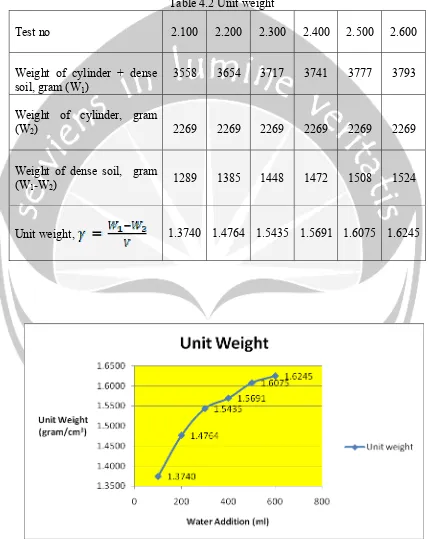
increased. Table 4.2 and figure 4.1 shows the relationship between unit weight and water addition.
Table 4.2 Unit weight
Test no 2.100 2.200 2.300 2.400 2.500 2.600
Weight of cylinder + dense soil, gram (W1)
3558 3654 3717 3741 3777 3793
Weight of cylinder, gram
(W2) 2269 2269 2269 2269 2269 2269
Weight of dense soil, gram
(W1-W2) 1289 1385 1448 1472 1508 1524
Unit weight, 1.3740 1.4764 1.5435 1.5691 1.6075 1.6245
Table 4.2 and figure 4.1 shows that with the addition of water, the unit weight of clay will increase. By 100 ml water addition, the clay unit weight is 1.3740 gram/cm3; 200 ml water addition, the unit weight increase to 1.4764 gram/cm3; 300 ml water addition, unit weight 1.5435 gram/cm3; 400 ml water addition, unit weight 1.5691 gram/cm3; 500 ml water addition, unit weight 1.6075 gram/cm3; and 600 ml water addition, unit weight 1.6245 gram/cm3.
No. tin box 1 2 3 4 5 7 8 13 14 16 19 20
Weight empty tin
box W1, gram 24.00 24.64 24.05 24.29 23.68 24.65 23.09 24.02 24.58 23.49 23.49 23.49 Weight tin box +
wet soil W2, gram 65.60 64.75 67.30 69.65 60.80 65.30 58.75 60.85 57.80 63.70 65.25 62.35 Weight tin box +
dry soil W3, gram 58.44 57.93 58.19 60.31 51.89 55.83 49.80 51.61 48.61 52.70 53.04 50.76 Weight water A = (W2 – W3)
gram 7.16 6.82 9.11 9.34 8.91 9.47 8.95 9.24 9.11 11 12.21 11.59 Weight dry soil B = (W3 – W1)
gram 34.44 33.29 34.14 36.02 28.21 31.18 26.71 27.59 24.03 29.21 29.55 27.27
Moisture content 20.79 20.47 26.68 25.93 31.58 30.37 33.51 33.49 38.24 37.66 41.32 42.50
Average moisture content, % 20.64 26.31 30.98 33.50 37.95 41.91
Table 4.3 shows that the average moisture content and weight dry volume of clay from each samples (6 samples), with various water content addition (100 ml; 200 ml; 300 ml; 400 ml; 500 ml; and 600 ml). First sample with 100 ml water addition (tin box no. 1 and 2), the average moisture content is 20.64%, weight dry volume (γd) is 1.1390 gram/cm3; second sample with 200 ml water addition (tin box no. 3 and 4), average moisture content = 26.31%, γd = 1.1689 gram/cm3; third sample with 300 ml water addition (tin box no. 5 and 7), average moisture content = 30.98%, γd = 1.1784 gram/cm3; fourth sample with 400 ml water addition (tin box no. 8 and 13), average moisture content = 33.50%, γd = 1.1754 gram/cm3; fifth sample with 500 ml water addition (tin box no. 14 and 16), average moisture content = 37.95%, γd = 1.1652 gram/cm3; sixth sample with 600 ml water addition (tin box no. 19 and 20), average moisture content = 41.91%, γd = 1.1448 gram/cm3.
From the data above, figure 4.2 shows the relationship between average moisture content and dry density volume.
1.1000
20.64 26.31 30.98 33.50 37.95 41.91
Dr
Moisture Content (w), %
From the figure above, the amount of maximum dry density (MDD) is 1.18 gram/cm3, and optimum moisture content (OMC) is 32.24%. Based on the MDD and OMC, the water content for OMC condition can be calculated. By the calculation the result is 901.54 ml water needed for OMC condition.
IV.2. UNCONFINED COMPRESSION TEST (UCS) RESULT
IV.2.1. Clay Soil + Cement
For complete result of these UCS test please see the appendix. The figures
below shows the values of friction angle (Ф), cohession (c), and shear strength (qu) of clay + cement from various samples (0%; 8%; 12%; and 16%) of cement, with one curing time (0 day).
Table 4.4 UCS test of Clay – Cement result conclusion
CEMENT φ qu c
% ( ° ) (kg/cm2) (kg/cm2)
0% 10 0.2390 0.1003
8% 40 0.7649 0.1783
12% 30 0.2043 0.0590
10
Figure 4.3 Friction Angle Value of Clay – Cement
0.2390
0.2390
Figure 4.5 Cohession of Clay – Cement
From table 4.4, figure 4.3, 4.4, 4.5, obtained that cement at percentage 8% is the best value of these combination. The values of c and qu at 8% of cementare increased compare with 0% of cement, but then decreased at the percentage values above 8%.
IV.2.2. Clay Soil + Cement + Fly Ash
For complete result of these UCS test please see the appendix. The figures below shows the values of friction angle (Ф), cohession (c), and shear strength
(qu) of clay + cement + fly ash from various samples (0%; 8%; 12%; and 16%) of fly ash, with three times curing time (0, 7, and 14 days). Here, we used cement at percentage of 8%, obtained from the conclusion of subchapter above, where this percentage of cement have the optimum values of cohession and shear strength.
Table 4.5 UCS test of Clay – Cement – Fly Ash result conclusion
CEMENT FLY ASH DAY φ qu c
% % ( ° ) (kg/cm2) (kg/cm2)
0 10 1.6095 0.6753 7 20 2.0822 0.7290 14 20 2.3199 0.8122 0 20 2.1988 0.7698 7 30 2.7664 0.7986 14 30 3.1633 0.9132 0 30 1.8028 0.5204 7 30 1.9819 0.5721 14 30 2.1695 0.6263 0 30 1.2240 0.3533 7 40 1.6327 0.3807 14 20 1.7194 0.6020 8%
0%
12%
24%
0
Figure 4.6 Friction Angle Value of Clay – Cement – Fly Ash
0.0000
0.0000
Figure 4.8 Cohession of Clay – Cement – Fly Ash