THE CORRELATION
BETWEEN STUDENTS’ LEARNING STRATEGIES
AND THEIR ENGLISH READING ACHIEVEMENT
TEST SCORES
(The Case of the Eighth Graders of MTS N 1 Semarang in the Academic Year of 2009 / 2010)
a final project
submitted in partial fulfillment of the requirements for Sarjana Pendidikan in English
by
Walnendah Puspita Rini 2201405557
ENGLISH DEPARTMENT
FACULTY OF LANGUAGES AND ARTS
SEMARANG STATE UNIVERSITY
ii
APPROVAL
This final project was approved by the Board of Examiners of the English Department of Languages and Arts Faculty of Semarang State University on March 2010.
1. Chairman
Drs. Januarius Mujianto, M. Hum. NIP. 195312131983031002 2. Secretary
Drs. Alim Sukrisno, M. A. NIP. 195206251981111001 3. First Examiner
Dr. Dwi Anggani Linggar B., M. Pd. NIP. 195901141989012001
4. Second Advisor as Second Examiner Sri Wuli Fitriati, S. Pd., M. Pd. NIP. 197510262005012001 5. First Advisor as Third Examiner
Rohani, S. Pd., M. A. NIP. 197903122003121002
Approved by
Dean of Faculty of Languages and Arts
iii
PERNYATAAN
Dengan ini saya :
Nama : Walnendah Puspita Rini NIM : 2201405557
Prodi / Jurusan : Pendidikan Bahasa Inggris / Bahasa dan Sastra Inggris Fakultas Bahasa dan Seni Universitas Negeri Semarang
Menyatakan dengan sesungguhnya bahwa skripsi / tugas akhir / final project yang berjudul:
THE CORRELATION BETWEEN
STUDENTS’ LEARNING STRATEGIES AND THEIR
ENGLISH READING ACHIEVEMENT TEST SCORES (THE
CASE OF THE EIGHTH GRADERS OF MTS N 1 SEMARANG
IN THE ACADEMIC YEAR OF 2009 / 2010)
yang saya tulis dalam rangka memenuhi salah satu syarat untuk memperoleh gelar sarjana ini benar-benar merupakan karya sendiri yang saya hasilkan setelah melalui proses penelitian, bimbingan, diskusi, dan pemaparan ujian. Semua kutipan baik langsung maupun tidak langsung, baik yang diperoleh dari perpustakaan, wahana elektronik, maupun sumber lain telah disertai dengan keterangan mengenai identitas sumbernya dengan cara sebagaimana mestinya yang lazim dalam penelitian ilmiah. Dengan demikian, walaupun tim penguji dan pembimbing penulisan skripsi / tugas akhir / final project ini membubuhkan tanda tangan sebagai tanda keabsahannya, seluruh isi karya ilmiah ini tetap menjadi tanggung jawab saya sendiri. Jika kemudian ditemukan pelanggaran, saya bersedia meenerima akibatnya. Demikian harap pernyataan ini dapat digunakan seperlunya.
Semarang, Februari 2010 Yang membuat pernyataan
iv
ACKNOWLEDGEMENTS
Firstly, I would like to express the highest gratitude to Allah SWT, who has blessed me in completing and finishing this final project.
I also express thankfulness to the people who have given contribution in finishing this final project, especially for:
(1) Mr. Rohani, S.Pd., M.A. as my first advisor and Mrs. Sri Wuli Fitriati, S.Pd., M.Pd. as my second advisor for their time, advices, guidances, and patience so that I can finish this final project.
(2) Mrs. Rini Absari, my mother, and Mr. Suwarto, my father, for their prayers, supports, wishes, and motivation for me.
(3) All of my lecturers in the English Department of Semarang State University, who have given knowledge for me.
(4) Mrs. Nisa and her students in VIII.A of MTS N 1 Semarang for their helps and cooperation.
(5) All of my friends in D parallel class, especially Hanifah, Ika Septi, and Ika Sakti for their friendship and cooperation.
v
”GIVE THANKS FOR WHAT YOU ARE NOW AND KEEP FIGHTING
FOR WHAT YOU WANT TO BE TOMORROW”
(Fernanda Miramontes-Landeros)
To
My beloved mother (Rini Absari)
vi
ABSTRACT
Rini, Walnendah Puspita. 2010. The Correlation between Students’ Learning Strategies and Their English Reading Achievement Test Scores (The Case of the Eighth Graders of MTS N 1 Semarang in the Academic Year of 2009/2010). Final Project. English Department. S1 Degree of Education. First advisor: Rohani, S.Pd., M.A. Second advisor: Sri Wuli Fitriati, S. Pd., M.Pd.
Keywords: Correlation, English learning, learning strategies, achievement test scores.
This study is a quantitative study. Thus, the problem of this study is whether or not there is a significant correlation between students’ learning strategies and their English reading achievement test scores of the eighth graders of MTS N 1 Semarang in the academic year of 2009/2010. It used questionnaire and test to collect the data. The sample was the eighth graders of MTS N 1 Semarang year 2009/2010 that consisted of 30 students. The sample was taken by using cluster sampling technique. It was chosen based on the level of students’ groups. Then, the correlation of the data was calculated by using Pearson Product Moment Formula.
The hypothesis can be formulated that there is a significant correlation between leaning strategies and English reading achievement test scores of the eighth graders of MTS N 1 Semarang in the academic year 2009/2010, while the null hypothesis is that there is no correlation between learning strategies and English reading achievement test scores of the eighth graders of MTS N 1 Semarang in the academic year 2009/2010.
Using Pearson Product Moment Formula, it was revealed that the coefficient correlation was 0.062. On the other hand, the critical value of 5 % of significance level with (N) is 30 is 0.361. It means that the coefficient correlation was lower than the critical value. So, there is no correlation between learning strategies and English reading achievement test scores of the eighth graders of MTS N 1 Semarang in the academic year 2009/2010.
The finding shows that there is no correlation between students’ learning strategies and their English reading achievement test scores. It is possibly caused by other strategies that are used by students in learning. The other possible cause is there are other factors that affect their achievement test scores.
vii
TABLE OF CONTENTS
page
Acknowledgements ... iv
Abstract ... vi
Table of Contents ... .vii
List of Appendices ... x
Chapter 1. INTRODUCTION ... .1
1.1 General Background of the Study ... 1
1.2 Reason for Choosing the Topic ... 4
1.3 Statements of the Problem ... 5
1.4 Objectives of the Study... 5
1.5 Statements of the Hypothesis ... .5
1.6 Significance of the Study ... 6
1.7 Outline of the Report ... 7
2. REVIEW OF RELATED LITERATURE ... 8
2.1 Review of Previous Studies ... .8
2.2 Theoretical Background ... 9
2.3 Learning ... 9
2.4 Learning Strategies ... .11
viii
2.6 Cognitive Strategies ... 13
2.7 Metacognitive Strategies ... .14
2.8 Social and Affective Strategies ... .14
2.9 Achievement Test ... 15
2.10 Achievement Test Scores ... 16
2.11 The Relationship between Learning Strategies and Achievement Test Scores ... .17
2.12 Theoretical Framework... 17
3. METHOD OF INVESTIGATION ... .20
3.1 Research Design ... 20
3.2 Population ... 21
3.3 Sample ... .22
3.4 Variable ... 23
3.5 Instruments ... .23
3.6 Questionnaire ... 23
3.7 Validity of the Questionnaire ... .25
3.8 Reliability of the Questionnaire ... 25
3.9 Achievement Test ... .27
3.10 Validity of the Test ... 28
3.11 Reliability of the Test ... 29
3.12 Procedure of Collecting Data ... 31
ix
4. FINDINGS AND DISCUSSION ... 34
4.1 Data Analysis ... 34
4.1.1 The Scoring of the Students’ English Achievement Test ... 34
4.1.2 The Scoring of the Students’ Questionnaires ... 35
4.1.2.1 The Cognitive Strategy ... 37
4.1.2.2 The Metacognitive Strategy ... .39
4.1.2.3 The Social Strategy ... 41
4.1.2.4 The Affective Strategy ... .43
4.2 Correlation Analysis ... 44
4.3 Discussion ... .45
5. CONCLUSIONS AND SUGGESTIONS ... .47
5.1 Conclusions ... 47
5.2 Suggestions ... 48
REFERENCES ... .49
x
LIST OF APPENDICES
Appendix
1. Questionnaire ... 51
2. Reading Achievement Test ... 55
3. The Computation of Validity of Questionnaire ... 60
4. The Computation of Reliability of Questionnaire ... 61
5. The Table of Validity of Questionnaire ... 62
6. The Computation of Validity of the Try-out Test... 63
7. The Computation of Reliability of the Try-out Test ... 64
8. The Table of Validity of the Try-out Test ... 65
9. The Table of Questionnaire Scores ... 66
10. The Table of Test Scores ... 67
11. The Table of Scores ... 68
1
1.1 General Background of the Study
Language is needed in our life. It is acquired by all people in the world. It has many functions. One of them is as a means of communication. Many experts give their opinions about language. According to Hornby (1995:662) language is the system of sounds and words used by humans to express their thoughts and feelings. Wardraugh (1992:1) states that language is also what the members of particular society speak. Brown (2000:5) says that it operates in speech community and culture. From all above, we can conclude that we need language for communication. All people in this world communicate each other with languages.
There are many languages in this world. One of the international languages is English. Brumfit (1988:2) states that English is an international language in that it is the widest spread medium of international communication, both because of a number and geographical spread of its native speakers and because of a large number of non native speakers who use it.
taught in some semesters at universities.
As we know, the goals of teaching English at junior high school are different from those of senior high school in their depth and broadness of the materials, so are the goals of teaching English at universities. They, however, share the same general objective, such as: their graduate are supposed to be able to use the language well, spoken and written (Soejono, 1990:63).
Learning a foreign language, especially learning English is difficult. Lado (1961:13) argues that learning a foreign language is a matter of habit and transfer. A foreign language learner transfers the habit of his native language to foreign language and this happens without his awareness.
Learning a second language is a long and complex undertaking and your whole person is affected as you struggle to reach beyond the confines of your first language and into a new language, a new culture, a new way of thinking, feeling, and acting. Total commitment, involvement, physical, intellectual, and emotional responses are necessary to successfully send and receive messages in a second language (Brown, 2000:1).
The students have different problems in learning and have different ways in learning to achieve their goals. Learning strategies are needed to solve their problems.
Learning strategies are different from learning styles. Learning styles according to Brown (2000:122) are general characteristics that differentiate one individual from another; strategies are those specific attacks that we make on a given problem. They are the moment by moment techniques that we employ to solve the problems posed by second language input and output.
Learning strategies are divided into three categories. They are cognitive strategies, metacognitive strategies, and socioaffective strategies. O'Malley gives statements that were quoted by Brown (2000:125).
Metacognitive is a term used in information processing theory to indicate an executive function, strategies that involve planning for learning, thinking about the learning process as it is taking place, monitoring of one's production or comprehension and evaluating learning after an activity is completed. Cognitive strategies are more limited to specific learning tasks and involve more direct manipulation of the material itself. Socioaffective strategies have to do with social mediating activity and interacting with others.
The above quotation implies that metacognitive strategies are about planning and evaluating learning and cognitive strategies are about the ability of brain to learn something. Then, socioaffective strategies are about students’ interaction with others.
To know whether the students have achieved their goals of learning, then teacher needs achievement test. This achievement test is held at the end of the study.
mastery of a particular syllabus, such as: final test, school leaving examinations, and public tests. These tests are generally based on a syllabus and measure what has been taught and has been learned. They are rarely constructed by the classroom teacher for a particular class and they are designed primarily to measure individual performance rather than to act as a means of motivating the students or reinforcing learning. The score of this achievement test can show whether the students have succeeded in learning.
1.2 Reason for Choosing the Topic
Learning second language is difficult, especially in learning English. Sometimes, students have problems in learning English. Because of it, students use some strategies in learning English. They use these strategies to solve their learning problem. On the other hand, some students also use it to increase their English achievement test scores. From their scores, the students will know whether they have been successful learners.
1.3 Statements of the Problem
In this final project, the writer intends to limit the discussion by presenting the following problem:
Is there any significant correlation between learning strategies and English reading achievement test scores of the eighth graders of MTS N 1 Semarang in the academic year of 2009 /2010?
1.4 Objectives of the Study
This final project has objective as follow:
To find out whether or not there is a significant correlation between learning strategies and English reading achievement test scores of the eighth graders of MTS N 1 Semarang in the academic year of 2009 / 2010.
1.5 Statements of the Hypothesis
Based on the above statement of the problem, the writer hypothesizes that ”There is a significant correlation between learning strategies and English reading achievement test scores of the eighth graders of MTS N 1 Semarang in the academic year 2009 / 2010.
1.6 Significance of the Study
The writer hopes this research can give some contributions:
For teachers:
(1) The result of study is expected to become an evaluation for English teaching learning process and gives some contribution to the improvement of it.
(2) It is to give information to teachers about their students' learning strategies.
(3) It also informs teachers how they can apply their students' learning strategies in the classroom.
(4) Then, it is to give information to teachers how they can help their students to be successful learners.
For students:
(1) The result of the study is expected to encourage students to use appropriate learning strategies.
(2) It is also expected to encourage students to study harder than before. (3) Then, it is expected to advise students to become more independent
learners.
(4) It helps the students to become better language learners.
1.7 Outline of the Report
Chapter I presents introduction, which contains general background of the study, reason for choosing the topic, statements of the problem, objectives of the study, significance of the study, statements of the hypothesis, and outline of the report.
Chapter II is a review of related literature. It reveals some ideas and opinions related to the topic. It consists of learning, learning strategies, the kinds of learning strategies, cognitive strategies, metacognitive strategies, social and affective strategies, achievement test, achievement test scores, and the relationship between learning strategies and achievement test scores.
Chapter III deals with method of research, which concerns with population, sample, variable, instruments, the procedure of collecting data, and method of analyzing data.
Chapter IV is the findings and discussion, which consists of the data analysis and the correlation analysis.
The last chapter is conclusions and suggestions. It concludes and gives suggestions to the reader based on the research findings.
8
This chapter presents about the theory of this study which becomes the
theoretical background of this study. Review of previous study and the theoretical framework are also presented in this chapter.
2.1
Review of Previous Studies
There are many researches on learning strategies. One of them is a study of learning strategies in foreign language instruction which has conducted by Chamot (1987). His study is the description of identification of the range and characteristics of learning strategies used in studying foreign language. This research is on high school and college students. The result of this study is that the students at all levels of instructions use predominantly cognitive strategies supported by metacognitive strategies.
Then, Warr (2000) conducted a research about learning strategies, learning anxiety, and knowledge acquisition. This research is on adult learners. From this research, it was found that four reported learning strategies were negative significantly associated with learning gain.
Besides, Magogwe (2007) also conducted a research about the relationship between language learning strategies, proficiency, age, and self-eficacy beliefs. It is a study of language learners in Botswana. Lai (2009) also conducted a similar research. It is about language learning strategy use and English proficiency of university freshmen in Taiwan. Those researches are on college students. Both of them give the similar result that there is a dynamic relationship between use of language learning strategies and proficiency.
From the researches above, it can be known that there is no research about learning strategies which took junior high school students as samples and its relationship to achievement test scores, so this research is conducted to know the correlation between learning strategies and achievement test scores. Then, this research took the eighth graders of MTS N 1 Semarang in the academic year 2009/2010 as samples.
2.2
Theoretical Background
2.2.1 Learning
Besides, Kimble and Garmezy (2001:6) also define learning as a relatively permanent change in a behavioral tendency and is the result of reinforced practice. Another definition of learning which is stated by Estes (1975:9) is some systematic change behavior or behavioral disposition that occurs as a sequence of experience in some specified situations.
Furthermore, learning begins at birth and ends at death. People learn under a wide range of conditions and circumstances. We learn more and less continuously everywhere. There are some kinds of learning, such as language learning. There is a lot of language in this world, especially English. Before we learn about English we have to know what language learning is.
McKay and Tom (1999:15 – 16) give some assumption about language learning.
Language is an interrelated and meaningful whole … Formal aspects of language should not, in principle, be taught separately from meaning … Learning a language is an integrated process … Language learning is a long process, in which the learner gradually increases his ability to understand and express himself, integrating every new bit of learning into an overall competence… Mistakes are a normal and necessary part of language learning … The classroom atmosphere effects learning … As an active participant in the learning process, the learner needs to have input into both the content of the course and the way in which it is being taught.
There are many principles in language learning. According to Brown (2004:20) many principles of language learning are cognitive, affective, and linguistic principles. These principles are important, so students can learn language correctly.
2.2.2 Learning Strategies
Learning is not separated from learning strategies. It is used to achieve the goals of learning. Oxford quoted by Celce-Murcia (2001:359) states that learning strategies are defined as specific actions, behaviors, steps, or techniques such as seeking out conversation partners or giving oneself encouragement to tackle a difficult language task which is used by students to enhance their own learning.
According to Weinstein and Mayer (1990:43) learning strategies are the behaviors and thoughts that a learner engages in during learning that are intended to influence the learner’s encoding process. They have learning facilitation as a goal and are intentional on the part of learner. The goal of strategy is to affect the learners’ motivational or affective state, or the way, in which the learner selects, acquires, organizes, or integrates new knowledge.
Besides, the learning strategies are used to make learning easier so the learner can understand the subject easily. It is based on the O’ Malley and Chamot (1990:42) statements.
directed, more effective and more transferable to new situations. In dealing with learning materials and demands during language use, learners will engage in systematic mental steps to process the language in order to entrance production, comprehension, learning or retention.
Learning strategies are also used by learners when they face some problems in learning. It is according to Ellis statements (2003:77).
Learning strategies are the particular approaches or techniques that learners employ to try to learn a second language. They can be behavioral or they can be mental. They are faced with some problems; such as how to remember new word learners are generally aware of the strategies they use and when asked can explain what they did to try to learn something.
It means that students use strategies when they face many problems. For example, when they have many difficulties in remembering new words, they use a strategy to make it easier for them.
2.2.3 Kinds of Learning Strategies
According to O’Malley and Chamot (1990:151) learning strategies are divided into direct strategies, which involve mental processing of the target language and indirect strategies, which support learning through focusing, planning, evaluating, seeking opportunities, controlling anxiety, increasing cooperation and empathy and other means. Indirect strategies are subdivided into three categories: metacognitive, social, and affective.
2.2.3.1
Cognitive Strategies
O’Malley and Chamot (1990:136) says that cognitive strategies are operations carried out directly on the material to be learnt. Brown (2000:124) says that cognitive strategies are more limited to specific learning tasks and more direct manipulation of the learning material itself.
According to Ellaine and Christines, (2004:188) cognitive strategies operate directly on incoming information and enable learners to process texts and materials for learning. This can be done by manipulating the information mentally or physically. Examples of cognitive strategies are visualize the information, use background knowledge to make inferences, draw concept maps to group items to be learnt, and make notes about important information to be remembered.
Celce-Murcia (2001:363) also states that cognitive strategies enable the learner to manipulate the language material in direct ways, through reasoning, analyzing, note taking, summarizing, synthesizing, outlining, reorganizing information to develop stronger schema, practicing in naturalistic setting, and practicing structures and sounds formally.
2.2.3.2
Metacognitive Strategies
They describe mental operations used by learners in the self management of their learning. O’ Malley and Chamot (1990:138) organize these into seven major groups: planning, directed attention, selective attention, self management, self monitoring, problem identification and self evaluation.
Celce-Murcia (2001:364) also states that metacognitive strategies are identifying one’s own learning style preference and needs, planning for second language tasks, gathering and organizing materials, arranging schedule, monitoring mistakes, evaluating the success of any type of learning strategies are employed for managing the learning success overall.
2.2.3.3 Social and Affective Strategies
According to Ellaine and Christine (2004:188), social strategies are learner initiated actions to engage another person’s help and cooperation. Affective strategies are behaviors or thoughts for coping with one’s emotions so as to ensure the successful completion of a learning or communicative task.
2.2.4
Achievement Test
There are two forms of test which differ according to their purpose. One of them is achievement test. According to McNamara (2000:131), the achievement test is a test which aim to establish what has been learned in a course of instruction.
Davies (1977:45) also states that achievement tests are concerned with assessing what has been learned of a known syllabus. This may be within a school or within a total educational system.
Besides, Gronlund (1982:1) also gives a statement about the achievement test. An achievement test is a systematic procedure for determining the amount a student has learned so the writer can conclude that the achievement test is associated with what has been learned. It is given at the end of study in order to see whether and where progress has been made in terms of the goals of learning, it has to relate to the curriculum and has constructive relationship with teaching and learning process.
Although, according to Gronlund (1982:1) the emphasis of an achievement test is on measuring learning outcomes, it should not be implied that testing is to be done only at the end of instruction. All too frequently, achievement testing is viewed as an end of unit or end of course activity that is used primarily for assigning course grades.
Achievement tests should support and reinforce other aspects of the instructional process. They can aid both the teacher and students to assessing learning outcomes…monitoring learning progress…diagnosing learning difficulties…and evaluating learning outcomes….
This implies that achievement tests can aid students and teachers to assess and evaluate learning outcomes. Achievement tests also help students and teachers to monitor learning progress and diagnose learning difficulties. Besides, achievement tests are also as a proponent of other aspects of the instructional process.
2.2.5 Achievement Test Scores
The achievement test score should show the result of teaching learning process because achievement test relates to the past in that they measure what language the students have learned as a result of teaching learning process. Achievement test score can show what the learners have achieved the goals of learning. If the learners have achieved the goals of learning, they can be successful learners. The frequency of score shows the frequency of goals that has been achieved by the learners. So, it can be concluded that the achievement test score shows who successful learners are.
2.2.6 The Relationship between Learning Strategies and
Achievement Test Scores
to have a strategy in their learning process. Learning strategies are used by students to be successful learners. Because successful learners get the high scores of achievement test, so students use learning strategies to get the high score.
It means that students that have the high scores show that their strategies are appropriate and effective to be used. The scores can show which learning strategies are appropriate to the students.
2.3
Theoretical Framework
There are many studies on learning strategies which are conducted by language researchers, but there is no research about learning strategies which are used by eighth graders of junior high school, especially on MTS N 1 Semarang in the academic year 2009/2010 and their relation to students’ achievement test scores. Then, this research is conducted to complete it.
Every student has to get high score in achievement test. It will be got in several ways. One of them is by learning. In learning, students have to have strategies so they can be successful learners. According to Willis (2004:10) different types of learners adopt different strategies for learning successfully. Good learners tend to have more strategies than weak ones, and they use them more regularly.
the situations demands. However, frequently there are times when such strategies are applied methodically after having been learned from others.
There are many learning strategies. In this research, there is an explanation about them. They are cognitive, metacognitive, social, and affective strategies. According to Willis (2004:9) adults usually learn faster than children because they use both cognitive and metacognitive strategies. Children have better memories and rely less on cognitive strategies.
A learning strategy is neither good nor bad. It depends on how students used each learning strategy. According to Celce-Murcia (2001:362) a strategy is useful if the following conditions are presents: (a) the strategy relates well to the second language task at hand, (b) the strategy fits the particular student’s learning style preferences to one degree or another, (c) the student employs the strategy effectively and links it with other relevant strategies.
19
This chapter deals with the methods in conducting the research. It presents research design, population, sample, instruments, procedure of collecting data, and method of analyzing data. It also presents the reliability and the validity of instruments.
3.1 Research Design
On the basis of the nature of the data being analyzed, scientific research is categorized into two. They are qualitative and quantitative research. Qualitative research is one which collects some type of non numerical data to answer a research question. On the other hand, quantitative research is research carried out by collecting numerical data from sample drawn from a certain population. Based on these statements, this study constitutes a quantitative research.
Gall and Borg (2003:320) state that correlation research refers to studies in which the purpose is to discover relationship between variables through the use of correlational statistics. They further explain that the basic design of correlational research is collecting data on two or more variables for each individual in a sample and computing a correlational coefficient.
A positive correlation indicates that the variables vary together in the same direction, so increases in one variable are equivalent with the other. It means that a generally consistent proportional relationship exists. On the other hand, a negative correlation indicates that the increases in one measure are accompanied with the decreases the other.
3.2 Population
Quantitative researchers attempt to discover something about a large group of individuals by studying a much smaller group. The larger group that they wish to learn about is called population and the smaller group they actually study is called sample (Gall and Borg, 2003:167).
Tuckman quoted by Saleh (2005:227) also states that population is group about which the researcher is interested in gaining information and drawing conclusion.
3.3 Sample
Tuckman quoted by Saleh (2005:226) says that sample is representative group from the population to serve as respondents. One way to insure that this sample will be representative of the larger population is to draw a sampling. According to Gall and Borg ( 2003:167) Sampling refers to the process of selecting a sample from a defined population with the intent that the sample accurately represents that population.
There are five sampling technique in quantitative research such as: simple random sampling, stratified sampling, cluster sampling, and convenience sampling.
Besides using sampling technique, there are three factors in determining an optimal sample size for a quantitative research study. They are subgroup analysis, attrition, and reliability of the measures. Gall and Borg (2003:176) points out that in correlation research, a minimum 30 participants is desirable.
Based on the statement above, 30 students were taken as participants. Then, by using cluster sampling technique, V.III A was chosen as a sample. It was chosen based on the level of students’ groups.
3.4 Variable
According to Brown that is quoted by Saleh (2005:7) variable is something that may vary or differ. There are five variables. They are dependent variables, independent variable, moderator variable, control variable and intervening variable.
This study has two variables. They are dependent variable and dependent variable. The independent variable is students’ learning strategies and the dependent variable is students’ English reading achievement test scores. For the independent variable, the data was obtained from the result of the learning strategies questionnaires. Meanwhile, for the dependent variable, the data was obtained from the result of achievement test.
3.5 Instruments
The data for this study were collected using two instruments. They are questionnaire and achievement test. The following presents the description of these instruments.
3.5.1 Questionnaire
can fill out the questionnaire at their convenience, answer the item in vary order, take more than one sitting to complete it, make marginal comments or skip questions.
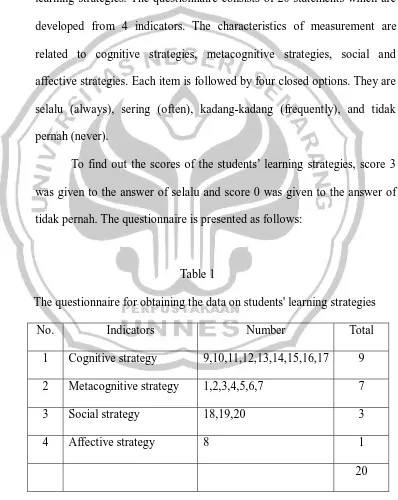
This study used closed questionnaire to measure the students learning strategies. The questionnaire consists of 20 statements which are developed from 4 indicators. The characteristics of measurement are related to cognitive strategies, metacognitive strategies, social and affective strategies. Each item is followed by four closed options. They are selalu (always), sering (often), kadang-kadang (frequently), and tidak pernah (never).
[image:33.595.114.512.232.732.2]To find out the scores of the students’ learning strategies, score 3 was given to the answer of selalu and score 0 was given to the answer of tidak pernah. The questionnaire is presented as follows:
Table 1
The questionnaire for obtaining the data on students' learning strategies
No. Indicators Number Total
1 Cognitive strategy 9,10,11,12,13,14,15,16,17 9 2 Metacognitive strategy 1,2,3,4,5,6,7 7
3 Social strategy 18,19,20 3
4 Affective strategy 8 1
3.5.1.1 Validity of the Questionnaire
According to Eichelberger (1989:117) validity addresses the extent to which a measurement process measures what a researcher wants it to measure. This characteristic of a measurement process is not inherent in the process, as is reliability, but depends on the purpose of a researcher have for the data and the way of the data are used.
This study used classical pure theory formula. The formula is as follows:
(
2 2)
/ Sx St rxy=
rxy = validity coefficient
St = student’s score
Sx = the highest score
(Azwar, 2006:44)
3.5.1.2 Reliability of the Questionnaire
Eichelberger (1989:119) mentions some statements about reliability as follows:
Therefore, reliability is the steadiness of the test. It means that students will have the similar result in the same test. Scores of students will be relatively same although students do the same test many times.
This study used variance analysis technique. The formula is as follows:
2 2 1
/ 1 Se Ss rxx = −
1 xx
r = reliability coefficient
Se = error variance
Ss = cross subject variance
(Azwar, 2006:93)
To make it easy, the computation of error variance can be done using formula: ) 1 )( 1 ( / ) ( / ) ( / ) ( 2 2 2 2 − − ∑ + ∑ − ∑ − ∑ = k n nk i n Y k X i se
i = the score of a subject on an item X = the total score a subject on all items Y = the total score all subjects on an item k = the number of item
n = the total number of subject
While the computation to the cross subject variance can be done using formula:
1 / ) ( / ) ( 2
2 2
− ∑
− ∑
=
n
nk i k X ss
i = the score of a subject on an item X = the total score a subject on all items k = the number of item
n = the total number of subject
(Azwar, 2006:94)
3.5.2 Achievement Test
Gronlund (1982:1) states that:
An achievement test is a systematic procedure for determining the amount a students has learned. Although, the emphasis is on measuring learning outcomes, it should not be implied that testing is to be done only at the end of instruction. All too frequently, achievement testing is viewed as an end of unit or end of course activity that is used primarily for assigning course grades. Although, this is necessary and useful function of testing, it is just one of many. As with teaching, the main purpose of testing is to improve learning and within this larger context, there are a number of specific contributions it can make. (Gronlund, 1982:1)
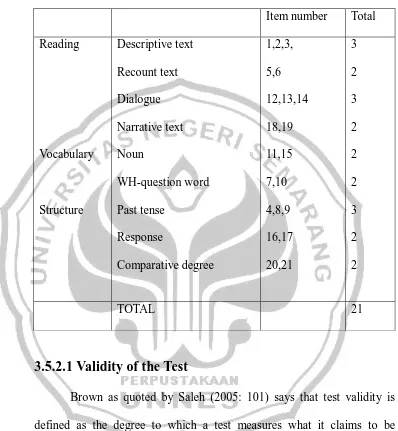
Table 2
The content of achievement test
Item number Total
Reading
Vocabulary
Structure
Descriptive text Recount text Dialogue Narrative text Noun
WH-question word Past tense
Response
Comparative degree
1,2,3, 5,6 12,13,14 18,19 11,15 7,10 4,8,9 16,17 20,21
3 2 3 2 2 2 3 2 2
TOTAL 21
3.5.2.1 Validity of the Test
Brown as quoted by Saleh (2005: 101) says that test validity is defined as the degree to which a test measures what it claims to be measuring.
Gronlund (1982:126) also points out the concept of validity, as used as in testing, can be clarified further by nothing the following general points:
(2) Validity is inferred from available evidence. (3) Validity is specific to a particular use. (4) Validity is expressed by degree.
There are three types of validity. They are content validity, criterion-related validity, and construct validity. The formula that was used to measure validity is Classical Pure Score Theory. The formula is as follows:
(
2 2)
/ Sx St rxy =
rxy = validity coefficient
St = student’s score
Sx = the highest score
(Azwar, 2006:44)
3.5.2.2 Reliability of the Test
Azwar (2006:4) says that reliability is how far a measurement is reliable. A measurement is reliable if there is similarity of the result in many times of measurement to the same subject.
Three types of reliability (Eichelberger, 1989:119) that addresses somewhat different concerns about a measurement or testing process are the following:
(3) Equivalence of alternate forms.
Variance analysis technique is formula to know whether the items are reliable or not. The formula is as follows:
2 2 1
/ 1 Se Ss rxx = −
1 xx
r = reliability coefficient
Se = error variance
Ss = cross subject variance
(Azwar, 2006:93)
To make it easy, the computation of error variance can be done using formula: ) 1 )( 1 ( / ) ( / ) ( / ) ( 2 2 2 2 − − ∑ + ∑ − ∑ − ∑ = k n nk i n Y k X i se
i = the score of a subject on an item X = the total score a subject on all items Y = the total score all subjects on an item k = the number of item
n = the total number of subject
(Azwar, 2006:93)
i = the score of a subject on an item X = the total score a subject on all items k = the number of item
n = the total number of subject
(Azwar, 2006:94)
3.6 Procedure of Collecting Data
Once, the research instruments were prepared. The instruments consisted of questionnaire of learning strategies and the achievement test. Therefore, after finishing the instruments and analyzing their validity, reliability and the effectiveness of each item, these were administered. Then, they were scored. The scores of the test were the data required by this study. After the data were gathered, they were analyzed and interpreted.
3.7 Method of Analyzing Data
between the variables, the Pearson Product Moment Formula was used. The formula is as follows:
( )( )
( )
{
∑
∑
−∑
∑
}
{
∑
∑
−( )
∑
}
−
= 2 2 2 2
Y Y
N X X
N
Y X XY
N rxy
xy
r = correlation coefficient
∑
XY = the sum of the product multiplying the scores for students’ learning strategies and the scores for students’ achievement test∑
X = the sum of the scores for students’ learning strategies∑
Y = the sum of the scores for students’ achievement test∑
2X = the sum of the square of students’ learning strategies scores
∑
2Y = the sum of the square of students’ achievement test scores
( )
2∑
X = the square of the sum of students’ learning strategies scores( )
2∑
Y = the square of the sum of students’ achievement test scoresN = the total number of the respondents
33
This chapter presents the way of computing the students’ learning strategies and their achievement test scores, which becomes the indicator of the correlation analysis between those, and the research finding is also presented in this chapter.
4.1 Data Analysis
4.1.1 Scoring of the Students’ English Reading Achievement
Test
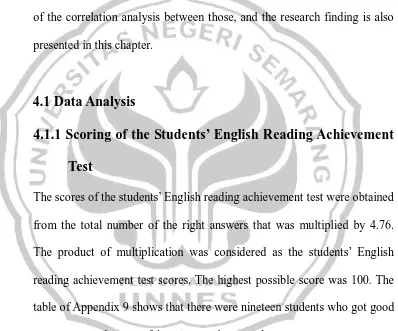
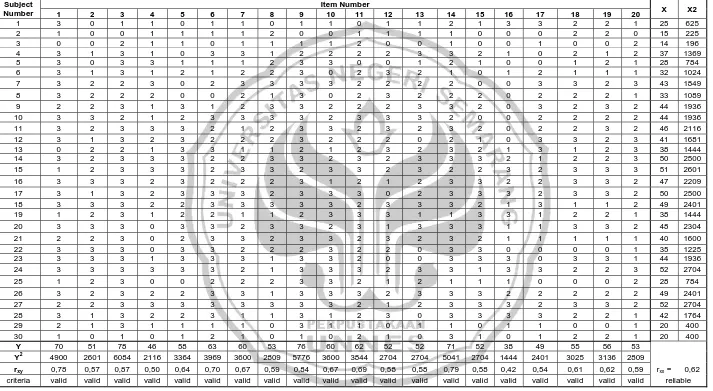
[image:43.595.116.514.259.590.2]The scores of the students’ English reading achievement test were obtained from the total number of the right answers that was multiplied by 4.76. The product of multiplication was considered as the students’ English reading achievement test scores. The highest possible score was 100. The table of Appendix 9 shows that there were nineteen students who got good scores, ten students got fair scores, and one student got poor score.
4.1.2 Scoring of the Students’ Questionnaires
The scores of the questionnaires were obtained by summing up the item credits of the students’ answer. Each item had four response options, selalu (always) credited 3, sering (often) credited 2, kadang-kadang (sometimes) credited 1, and tidak pernah (never) credited 0. After that, they were summed up in percentage description to facilitate the analysis.
[image:44.595.115.518.257.583.2]The distribution of the scores can be presented in the following table.
Table 4
The distribution of the scores of the questionnaire
No. Indicators Items A B C D
1 Cognitive strategy 9-17 93 152 139 0
2 Metacognitive strategy 1-7 99 106 113 0
3 Social strategy 18-20 21 28 50 0
4 Affective strategy 8 0 8 17 0
216 290 292 0
Each column on the table has different number. The highest number in cognitive strategy is in column B that is 152. It means that almost students often used cognitive strategy. The lower number is 139. It is in column C. It means that there were many students who sometimes used this strategy. The lowest number is in column A. It means that the rest number of students who always used cognitive strategy in their learning.
In metacognitive strategy column, there are four columns that have different number. The highest number is in column C which is 113. The smaller number is in column B, and the smallest number is in column A. It can be known that almost students sometimes used this strategy, the other students often used it, and little number of students always used this strategy.
Then, the comparison number of each column in social strategy is similar with metacognitive strategy column. The highest number is in column C, the lower number is in column B, and the lowest number is in column A. It can be known that it is similar with metacognitive strategy that the highest number of students sometimes used social strategy, the smaller number of students often used this strategy, and the others always used this learning strategy.
From the distribution of the scores of students’ questionnaire, students’ learning strategies can be measured as follows:
The total value of answers (A): 216 + 290 + 292 + 0 : 798
The total value of ideal answers (B): 30 x 20 x 3 : 1800
The percentage of students’ learning strategies: X B A
100 %
: X
1800 798
100 %
: 44.3 %
The computation above shows that the percentage of students’ learning strategies was 44.3 %. It means that the students used these learning strategies in low frequency because 44.3 % was regarded as low. They almost used their own learning strategies.
Then, the score of questionnaire was got from the total number of the credit points of students’ questionnaire answers that were multiplied by 10 and then divided by six. The highest possible score was 100.
4.1.2.1 The Cognitive Strategy
This strategy consists of nine items. The following scores were computed to determine the percentage of this strategy.
The total value of ideal answers (B): 30 x 9 x 3 : 810
The percentage of cognitive strategy: X B A
100 %
: X
810 384
100 %
: 47.4 %
The computation above shows that the percentage of cognitive strategy was 47.4 %. It was regarded as low. It means that students used cognitive strategy in low frequency. They almost used other strategies.
After analyzing each student, it was got that there are five students got very low score, thirteen students got low score, nine students got fair score, and three students got high score. Students who got high score are students number nine, twenty seven, and thirty. It means that they used cognitive strategy.
using pictures. The thirtieth student also used cognitive strategy. Although, she used different way, she still used her cognitive ability. She always imitated her teacher’s English talk, grouped words, elaborating new information with other concept in memory, and memorizing words using pictures.
The three of them almost used their brain in English learning. It is why their learning strategy called cognitive strategy. They really used her brain to get knowledge about English. From three of them, there are only two of them that got good score in achievement test. They are the ninth student and the twenty-seventh student. After getting information, it can be known that the ninth student and the twenty-seventh student also used other strategy. They combined two strategies to get much knowledge about English. They combined cognitive and metacognitive strategies. On the other hand, the thirtieth student only used cognitive strategy in her learning but she used it normally. It is why she only got fair score in achievement test.
4.1.2.2 The Metacognitive Strategy
This strategy consists of seven items. The following scores were computed to determine the percentage of this strategy.
The total value of answers (A): 99 + 106 + 113 + 0 = 318 The total value of ideal answers (B): 30 x 7 x 3 = 630
The percentage of the metacognitive strategy: X B A
: X 630 318
100 %
: 50.5 %
The computation above shows that the percentage of the metacognitive strategy was 50.5 %. It was regarded as low. It means that the students used the metacognitive strategy in low frequency. They almost used other strategies.
In analyzing each student, it can be known that three students got very low score, nine students got low score, thirteen students got fair score, three students got high score, and one student got very high score. Students who got high score are seventh, fifteenth, and twenty-seventh students. The student who got very high score is the ninth student. To proof it, it can be seen from what they did.
In achievement test, three of them got good score. They are the ninth, fifteenth, and twenty-seventh students. On the other hand, the seventh student got fair score. It is similar with cognitive strategy analysis that the ninth student and the twenty-seventh student got good score in achievement test. They got good score because they used two strategies. They used cognitive and metacognitive starategies.
In this case, there are two students who used metacognitive strategy and did not use cognitive strategy but got different score in achievement test. The seventh student got fair score but the fifteenth student got good score. Before concluding, it can be seen from their scores in metacognitive strategy questions. In fact, the fifteenth student’s score is higher than the seventh student’s score.
4.1.2.3 The Social Strategy
This strategy consists of three items. The following scores were computed to determine the percentage of this strategy.
The total value of answers (A): 21 + 28 + 50 + 0 = 99 The total value of ideal answers (B): 30 x 3 x 3 = 180 The percentage of social strategy: X
B A
100 %
: X
180 99
100 %
The computation above shows that the percentage of students’ social strategy was 55 %. It means that students used not only this learning strategy but also other learning strategies because 55 % was regarded as fair. They combined both this learning strategy and other learning strategies.
In social strategy, there are twenty students who got very low scores, three students got low scores, and four students got fair scores. There are no students who got high scores. It indicates that students are self-learners. They liked to learn by themselves.
However, after looking at the students who got good score and also used cognitive and metacognitive strategy, it was got that they got fair score in social strategy questions. They are the ninth student and the twenty-seventh student. It means that social strategy can support their learning.
4.1.2.4 The Affective Strategy
This strategy consists of two items. The following scores were computed to determine the percentage of this strategy.
The total value of answers (A): 0 + 8 + 17 + 0 : 25
The total value of ideal answers (B): 30 x 1 x 3 : 90
The percentage of affective strategy: X B A
: X 90 25
100 %
: 27.8 %
The computation above shows that the percentage of students’ affective strategy was 27.8 %. It means that students did not use this learning strategy because 27.8 % was regarded as very low. They completely used other learning strategies.
There are only four students who got fair score and the others got very low score in affective strategy questions. It indicates that students didn’t have interest and motivation in learning English. They might learn English because English is a compulsory subject.
However, it is similar with the social strategy. It also supports other strategies. It can be seen from the students who got high score in cognitive and metacognitive strategies got fair score in this strategy. They used this strategy as an additional strategy. They who used it are the ninth student and the twenty-seventh student.
4.2 Correlation Analysis
In getting the result, this study used Pearson Product Moment formula. It was used to find the correlation between two variables. From the table of scores the following values were found.
N = 30
∑X = 1384
∑Y = 2067
∑X2 = 70154
∑Y2 = 144133
∑XY = 95562
Then, those were put into the Pearson Product Moment formula. The following was the result of the computation.
( )
{
2 2}
{
2( )
2}
) )( ( ) ( Y Y N X X N Y X XY N rxy Σ − Σ Σ Σ Σ Σ − Σ =
( )
(
)
{
2}
{
(
(
)
)
2}
2067 144133 30 1387 70154 30 ) 2067 )( 1384 ( ) 95562 ( 30 − − − − = xy r
{
2104620 1915456} {
4323990 4272489}
2860728 2866860 − − − − = xy r
{
189164}{
51501}
98702 6132 =
xy
r
= 0,062
The computation above shows that the correlation coefficient was 0.062. It means that the coefficient correlation was lower than the critical value ’r’ because ’r’ with 5 % significance level and the subject number was 30 was 0.361. The critical value was higher than the correlation coefficient. It means that the null hypothesis was accepted. Therefore, it could be interpreted that there is no correlation between students’ learning strategies and their English reading achievement test scores.
4.3 Discussion
After looking at the correlation analysis, it was got that there is no correlation between learning strategies and English reading achievement test scores of the eighth graders of MTS N 1 Semarang. It can be proved that there are only two students that got high scores in questionnaire and also got high score in achievement test. They are the ninth student and the twenty-seventh student.
affective strategies because they got fair score in social and affective strategies questions.
46
The last chapter of this final project consists of two parts. The first part is conclusions of the study and the other part is suggestions based on the findings of the study.
5.1 Conclusions
There are many conclusions of this study. First, the percentage of the students’ English learning strategies in MTS N 1 Semarang in the academic year 2009/2010 was 44.3 % that was regarded as low. It means that students did not use these learning strategies that were reviewed in this final project. There was a possibility that they used other strategies.
Second, the average of the students’ English reading achievement test scores was 68.9. It was fair. It means that students got fair scores. There were 8 students got scores that were under the average and the rest of students got scores that were above the average.
their English reading achievement test scores because the coefficient correlation was lower than the critical value that was 0.361.
Fourth, there are many kinds of strategies that can be used by students besides cognitive, metacognitive, social, and affective strategies. Finally, there are many factors that affect students’ achievement test scores besides how they learn. The other factors are their creativity, their intelligence, their environment, their conditions, etc.
5.2 Suggestions
There are many suggestions from the writer. First, teacher should help students how to increase their achievement test scores. The teacher should give direction to students to improve their learning because the learning strategies are just strategies and these can not work without direction.
Second, students should be aware of their duty as students. They have to learn even though students use any kind of strategies because their strategies are important to increase their scores in achievement test.
48
Azwar, S. 2006. Reliabilitas dan Validitas. Yogyakarta: Pustaka Pelajar.
Benson, Phil. 2001. Teaching and Researching Autonomy in Language Learning. London: Pearson Education Ltd.
Brown, H. D. 2000. Principles of Language Learning and Teaching. New York: Longman Inc.
Brown, H. D. 2004. Language Assesment: Principle and Classroom Practices. New York: Longman Inc.
Brumfit, G. J. 1988. English for International Communication. London: Pergamon Press.
Celce-Murcia, M. 2001. Teaching English as a Second or Foreign Language. Boston: Heinle and Heinle, Thomson Learning.
Davies, A. 1977. Testing and Experimental Method. Oxford: Oxford University Press.
Eichelberger, R. T. 1989. Disciplined Inquiry: Understanding and Doing Educational Research. New York: Longman Inc.
Elaine Silver, Rita and Christine C. M. Goh. 2004. Language Acquisition and Development. Singapore: Pearson Education South Asia Ltd.
Ellis, R. 2003. Second language Acquisition. Oxford: Oxford University Press. Estes. 1975. Handbook of Learning and Cognitive Process. New York: Lawrence
Earlbaum.
Gall, M. D., et al. 2003. Educational Research: An Introduction. New York: Pearson Education Inc.
Gronlund, N. E. 1982. Constructing Achievement Test. New Jersey: Prentice Hall Inc.
Healey, J. F. 1996. Statistics: A Tool for Social Research. California: Wadsworth Publishing Company.
Hornby, A. S. 1995. Oxford Advance Learners Dictionary of Current English. Oxford: Oxford University Press.
Hutchinson, T. and A. Waters. 1987. English for Specific Purposes: A Learning Centered Approach. New York: Cambridge University Press.
Kimble, G. A., and Garmezy N. 2001. Principle of General Pshycology. New York: Willey.
Lado, R. 1961. Language Testing: The Construction and Use of Foreign Language Tests. London: Longman.
McKay, H. and A. Tom. 1999. Teaching Adult Second Language Learners. New York: Cambridge University Press.
McNamara, T. 2004. Language Testing. Oxford: Oxford University Press.
O’ Malley, J. M. and A. Uh Chamot. 1990. Learning Strategies in Second Language Acquisition. New York: Cambridge University Press.
Richard-Amato, P. A. 2003. Making it Happen: from Interactive to Participatory Learning Language Teaching. New York: Pearson Education Inc.
Saleh, M. 2005. Introduction to Linguistics research. Semarang: Unnes Press. Skehan, P. 2003. A Cognitive Approach to Language Learning. Oxford: Oxford
University Press.
Soejono. 1990. Pengenalan Kurikulum dan GBPP Bahasa Inggris. Semarang: IKIP Press.
Sudjana, N. 1989. Penelitian dan Penilaian Pendidikan. Bandung: Sinar Baru. Wardraugh, R. 1992. Sociolinguistics. New York: Oxford UK and Cambridge. Weinstein, C. E., and Mayer R. E. 1990. The Teaching Learning Strategies. New
York: Macmillan.
50 Nama :
Class :
Pilihlah jawaban yang sesuai dengan keadaan anda dengan memberi tanda silang pada a, b, c, atau d!
1. Seberapa seringkah anda membuat rencana kegiatan termasuk kegiatan belajar sebelum anda melaksanakan kegiatan tersebut?
a. Selalu c. Kadang-kadang
b. Sering d. Tidak pernah
2. Seberapa seringkah anda mempersiapkan dahulu tempat yang akan anda gunakan untuk belajar?
a. Selalu c. Kadang-kadang
b. Sering d. Tidak pernah
3. Seberapa seringkah anda mendengarkan dan mengoreksi percakapan bahasa Inggris orang lain?
a. Selalu c. Kadang-kadang
b. Sering d. Tidak pernah
4. Seberapa seringkah anda mengukur sendiri kemampuan bahasa Inggris anda misalnya, dengan berlatih menjawab soal-soal bahasa Inggris?
a. Selalu c. Kadang-kadang
b. Sering d. Tidak pernah
5. Seberapa seringkah anda memusatkan perhatian pada apa yang pelajari ketika anda belajar dan tidak menghiraukan gangguan yang ada?
a. Selalu c. Kadang-kadang
b. Sering d. Tidak pernah
6. Seberapa seringkah anda belajar jauh-jauh hari sebelum ujian?
a. Selalu c. Kadang-kadang
7. Seberapa seringkah anda mempelajari lagi di rumah pelajaran yang telah anda dapat di sekolah?
a. Selalu c. Kadang-kadang
b. Sering d. Tidak pernah
8. Seberapa seringkah anda membaca buku, novel, buku cerita atau yang lainnya yang berbahasa Inggris?
a. Selalu c. Kadang-kadang
b. Sering d. Tidak pernah
9. Seberapa seringkah anda mencoba menirukan kata-kata bahasa Inggris yang diucapkan oleh guru?
a. Selalu c. Kadang-kadang
b. Sering d. Tidak pernah
10.Seberapa seringkah anda membuat ringkasan atau catatan khusus setelah anda belajar?
a. Selalu c. Kadang-kadang
b. Sering d. Tidak pernah
11.Seberapa seringkah anda mencoba menerjemahkan kata, kalimat ataupun teks berbahasa Inggris yang anda temui?
a. Selalu c. Kadang-kadang
b. Sering d. Tidak pernah
12.Seberapa seringkah anda mencoba mengelompokkan kata-kata bahasa Inggris yang anda temui ke dalam kelompok kata misalnya, kata benda, kata kerja, kata sifat dll?
a. Selalu c. Kadang-kadang
b. Sering d. Tidak pernah
13.Seberapa seringkah anda mencoba membuat kalimat dari kata-kata bahasa Inggris yang anda temui?
a. Selalu c. Kadang-kadang
14.Seberapa seringkah anda mencoba membuat kalimat bahasa Inggris sesuai dengan struktur kalimat yang tepat?
a. Selalu c. Kadang-kadang
b. Sering d. Tidak pernah
15.Seberapa seringkah anda menghafalkan kata-kata bahasa Inggris yang baru anda temui?
a. Selalu c. Kadang-kadang
b. Sering d. Tidak pernah
16.Seberapa seringkah anda menghubungkan pengetahuan yang baru saja anda dapat dengan pengetahuan yang telah anda dapat?
a. Selalu c. Kadang-kadang
b. Sering d. Tidak pernah
[image:62.595.110.515.149.637.2]17.Seberapa seringkah anda menghafalkan kata-kata bahasa Inggris dengan gambar yang sesuai dengan arti kata-kata tersebut?
a. Selalu c. Kadang-kadang
b. Sering d. Tidak pernah
18.Seberapa seringkah anda membuat kelompok belajar dalam belajar bahasa Inggris?
a. Selalu c. Kadang-kadang
b. Sering d. Tidak pernah
19.Seberapa seringkah anda bertanya pada guru, orang tua atau orang yang lebih berpengetahuan tentang kesulitan anda dalam mempelajari bahasa Inggris?
a. Selalu c. Kadang-kadang
b. Sering d. Tidak pernah
20.Seberapa seringkah anda belajar bahasa Inggris dari orang yang menggunakan bahasa Inggris dalam percakapan sehari-hari, misalnya mencoba berkomunikasi dengan mereka menggunakan bahasa Inggris?
a. Selalu c. Kadang-kadang
Appendix 2
ENGLISH READING ACHIEVEMENT TEST
Name : Class :
Choose the correct answer by crossing a, b, c, or d! The question no. 1 – no. 3
Indonesia is located between two continents, Asia and Australia. It is also located between two oceans, the Indonesian and the Pacific Ocean. It extends to the north until 60 degrees latitude and to the south until 110 degrees latitude. To the east, it reaches until go degrees longitude and to the west, it is until 141 degrees. Indonesia is 5.120 kilometers wide from west to east, and 1.770 kilometers wide from north to south.
Indonesia consists of 13.667 islands. Some of the islands are stretch on the equator line. They are Kalimantan, Sumatra, Sulawesi, and Halmahera. The islands get a lot of sunshine. The five large islands are Sumatra, Java, Kalimantan, Sulawesi and Irian Jaya or Papua.
The land width of Indonesia is 1.904.345 square kilometers. Most of the area is covered by forests. They are about 120 million hectares. The forests comprise low land and high land.
1. “It is also located between two oceans …” (see paragraph 1). What does the word “it” refers to?
a. Indonesia c. Australia
2. Which islands are stretched on the equator line? a. Sulawesi, Sumatra, Java, and Halmahera b. Kalimantan, Java, Sulawesi, and Halmahera c. Sumatra, Java, Sulawesi, and Kalimantan d. Kalimantan, Sulawesi, Halmahera and Sumatra 3. What is the main idea of paragraph three?
a. Indonesia is between two continents b. The location of Indonesia
c. Indonesia’s land area d. The widht of Indonesia
4. Irfan : I have ever seen hippopotamus before. I … it at the zoo last holiday.
a. See c. Have seen
b. Saw d. Will see
Mr. Ruhadi drove the family to Cilacap’s mile center. There, they met Mr. Harjono. The dairy farmers in Cilacap milk their cows. “But, we don’t sell the milk” explained Mr. Harjono, “instead; we send it to the laboratory. The milk is pasteurized elt the laboratory. Then, the lab sells the milk”.
Mr. Ruhadi and the family had a wonderful time at the farm. They are very interesting. They even tried to milk a cow.
5. Who is Mr. Harjono? He is … a. Mr. Ruhadi’s brother b. The owner of the dairy farm c. Mr. Ruhadi’s son
6. What do the dairy farmers do after they have milked their cows? a. They sell the milk
b. They pasteurize the milk
c. They send the milk to the laboratory d. They send the milk to the government 7. A: … did the students arrive?
B: They arrived at seven o’clock.
a. How c. What time
b. What d. Where
8. The boy… to my party two days ago.
a. Comes c. Came
b. Come d. Has came
9. Baby : “What time did you hear the explosion last night? Banu : “I … it at 11.45 p.m”.
a. Hear c. Heard
b. Hears d. To hear
10.A: … does your brother clean his bicycle? B: twice a week.
a. How many c. How often b. How much d. How long
11.The animal that people usually look after and as a hobby is called … a. Breeding animal c. Wild animal
b. Domestic animal d. Pet
The question no.12 – no.14
Guest : Good morning, Sir. What can I do for you? Receptionist : Good morning. Is there any room?
Guests : A single room, please. Is there a bank near here? I want to change my money.
Receptionist : We have restaurant. You must order food and drink, and then we will prepare them for you.
12.What kind of room does the guest want? He want … a. Single room c. A single and double room b. Double room d. not any
13.How far is the bank from the hotel? It is about … a. 200 m c. 400 m
b. 300 m d. 500 m 14.Does the hotel have a restaurant?
a. Yes, it does b. Yes, they do c. No, it doesn’t d. No, they don’t
15.To keep our money. We could save it in the … a. Hospital c. Drugstore
b. Restaurant d. Bank 16.A: Can you help me?
B: ….
a. I’m sorry to hear that b. By all means
c. I’m very happy d. Thank you very much
17.A: This is a present for your birthday party. B: Thank you very much.
A: …
The question no.18 – no.19
Once upon a time, there was a little girl named Snow White. She lived with her aunt and uncle because her parents were died.
One day, she heard her uncle and aunt talking about leaving. Snow White in the castle because they both wanted to go to America and they didn’t have enough money to take Snow White.
Snow White did not want her uncle and aunt to do this so she decided it would be best if she ran way. The next morning, she ran away into woods.
18.With whom did Snow White live? She lived with her …
a. Parent c. Brother
b. Uncle and aunt d. Grandmother
19.Where did Snow White run way? She ran away into … a. Castle c. Mountains
b. Woods d. America 20.The classical music is … modern music.
a. As popular as c. Most popular b. More popular d. Not popular 21.A: Who is the boy over there?
B: Oh, he is Yulianto. He is the … boy in my class. a. Clever c. Cleverest
Appendix 3
The Computation of Validity of the Questionnaire for Item Number 1
∑
21
Y = 4,900
∑
2t = 8,100
N = 30
1. St2 = N
Y
∑
21
St2 =
30 900 , 4
St2 = 163.3
2. Sx2 = N
t
∑
2Sx2 =
30 100 , 8
Sx2 = 270
1. 1
xy
r = (St2/Sx2)
1
xy
r = (22.5/30)
1
xy
r = 0.75