DOI: 10.12928/TELKOMNIKA.v13i4.2272 1376
Poisson Clustering Process on Hotspot in Peatland
Area in Sumatera
Annisa Puspa Kirana*1, Imas Sukaesih Sitanggang2, Lailan Syaufina3
1,2Department of Computer Science, Faculty of Natural Science and Mathematics, Bogor Agricultural
University, Indonesia
3Department of Silviculture, Faculty of Forestry, Bogor Agricultural University, Indonesia
*Corresponding author, email: [email protected], [email protected], [email protected]
Abstract
The increase in peatland fire’s intensity has encouraged people to develop methods of preventing wildfire. One of the prevention methods is recognizing the distribution pattern of hotspot as one of forest and land fire indicators. We could determine the area that has high fires density based on distribution patterns so any early prevention steps could be performed in that area. This research proposed to recognize the distribution pattern of hotspot clusters in the peatland areas in Sumatera in the year 2014 using Kulldorff’s Scan Statistics (KSS) method with Poisson model. This approach was specifically designed to detect clusters and assess their significance via Monte Carlo replication. Results showed that the method is reliable to detect the clusters of hotspots which have the accuracy of 95%. Riau and South Sumatera province have the highest density of cluster distributions of the hotspot. Based on the maturity level of peat, cluster distributions of hotspot were mostly found in ‘hemic’ maturity level. Based on peatland thickness, cluster distribution of hotspot was mostly found in ‘very deep’ thickness.
Keywords: clustering, hotspot, peatland, Poisson process, scan statistics
Copyright © 2015 Universitas Ahmad Dahlan. All rights reserved.
1. Introduction
Indonesia faces a serious problem of forest and land fire every year. That kind of fire produces massive smog and carbon pollutions which lead to the decrease of health and the environmental damage [1]. There are two kinds of factors which trigger the occurrence of that fire: human factors and natural factors. Based on the data [2], in most of the fires cases are caused by human factors, whereas a small fraction of the cases is caused by the natural factors. Considering the bad impact on forest and land fire and its various triggering factors, it is very important to develop an early warning system to prevent forest and land fire. However, in order to develop the system, we first need to recognize the distribution pattern of hotspots as one of forest and land fire indicators. By recognizing that pattern, we able detect the area that has high fires density so any early prevention steps can be performed in that area. Several studies have been conducted on developing an early warning system for fire prevention. Sitanggang et al (2014) in [3] applieda spatial decision tree algorithm on spatial data of forest fires for predicting hotspots occurrences. Hotspot occurrence as an indicator of forest and land fires is essential in developing an early warning system for fire prevention.
beneficial to develop a method that takes into both spatial and temporal domain information on hotspot clustering.In this research, we apply statistical approach to recognize the distribution pattern of hotspot in both spatial and temporal domain using Kulldorff’s Scan Statistic (KSS) method with Poisson model [9]. The basic idea is that there is scanning windows that moves across space and/or time. For each location and size of the window, the number of observed and expected cases is noted. Every circular scanning a window will find the likelihood ratio using Poisson model. Then evaluation of the statistical significance of the cluster calculated using Monte Carlo simulation. The region with the highest value of likelihood ratio is the area that has the most potential clusters. There are several related researches about detecting clusters of spatial and temporal dimension data, especially in the forestry field. For example Devis et al (2008) in [10] applied scan statistic method to identify and analysed spatiotemporal clusters in 1997–2003 fire sequences of Tuscany region.
The purpose of this research is to recognize the distribution pattern of hotspot clusters in peatland areas in Sumatera in the year 2014 using KSS method with Poisson models. We analysed the recognized distribution pattern of hotspot clusters based on physical characteristics of peatland. The physical characteristic of peatland that we use is the maturity level of peat, thickness of peat, and land use of peat. Peatland in Sumatera categorised according to the level of maturity consist of three kinds there are fibric, hemic, and sapric. Fibric is the early stage of peat decomposition where recognizable plant fires dominate. Hemic is intermediate stage of peat decomposition, between fibric and sapric. Then, sapric is the advanced stages of peat decomposition into organic-matter rich ’earth’ without visible fires [11]. The maturity level of peat and thickness indicated in the category of peat. Suppose, ’Hemic/Sapric (60/40), very deep’ means that Hemic/Sapric is the maturity level of peat. Value (60/40) shows the area covering 60 percent of hemic and 40 percent of sapric. ’Very deep’ means that in the category of the thickness of peat with a depth 400-800 cm. The thickness of peat can be grouped to: 1) Very shallow thickness (D0) (having a thickness <50 cm) with maturity level Hemic/Sapric, Hemic/Minerals and Sapric/Hemic, 2) Shallow thickness (D1) (50-100 cm with maturity level Fibric/Sapric, Hemic/Sapric, Hemic/mineral, Sapric/Hemic and Sapric/Mineral, 3) Moderate thickness (D2) (100-200 cm) with maturity level of peat are Hemic/Sapric, Hemic/Mineral, Sapric, Sapric/Hemic and Sapric/Mineral, 4) Deep thickness (D3) (200-400 cm with maturity level of peat are Hemic/Sapric, Sapric and Sapric/Hemic, 5) Very Deep thickness (D4) (400-800 cm) with maturity level of peat are Hemic/Sapric and Sapric/Hemic [11]. The kind ofland uses detected in peatland area in Sumatera consist of 25 types [11].
The benefits of this research are as early warning system and early detection of forest and land fire, especially in the peatland area in Sumateraby providing illustrations of clustering pattern of hotspot based on the spatial and temporal aspect. We visualised the result of clustering pattern by developing prone area map. The remainder of this paper is organized as follows. In section 2, we describe the methodology and algorithm used in this research. In section 3, we discuss the analysis of the results obtained from applying these methodologies in the given datasets. Finally, we conclude this paper in section 4.
2. Research Method
2.1. Study Area and Forest Fires Data
This work clusters hotspot dataset on peatland area in Sumatera in the year 2014 by considering both spatial and temporal domain. Total peatland in Indonesia is about 20.6 million hectares which 35% of peatland are located in Sumatera [11]. Datasets that we use in this research is hotspot data, especially in the peatland area in Sumatera Island in the year 2014. Hotspot data are obtained from FIRMS MODIS Fire/Hotspot, NASA/University of Maryland. Peatland distribution data obtained from Wetland International. Spatial domain of hotspot data refers to the location of hotspot fire from longitude and latitude fields. While, temporal refers to the occurrence time of fire from date fields.
occurrence. The second step of preprocessing data is selecting of hotspots in the non-peatland area and hotspot in the peatland area. The third step of preprocessing is selecting the distribution location of the hotspot in each district or city. The final step is loading information into the database. Preprocessing of peatland datais calculate the areal per kilometre square based on the physical characteristic information of peat, including the maturity level of peat,the thickness of peat, and land use of peat.
2.2. Kulldorf’s Scan Statistic Method
Scan statistic can detect increases of cases in the local temporal and (or) spatial dimensions, examine whether this increase is due to random variation and detect the existence of clustering in a certain region as well as the precise position the cluster [12]. KSS method is the extension of scan statistic. KSS uses large collections of overlapping scan windows to detect clusters, both the location and the size, and evaluate their significance [9]. Scanning windows are collections in the area that potentially contains groups of hotspots on it. Basically, scan statistics works by comparing a set of events occurring inside a scanning window with those that lie outside. KSS employs a large collection of circular scanning windows to detect clusters, as illustrated in Figure 1. G is the whole area of study, Z is a circular scanning window,
µ(Z) is the total population which is located in a circular scanning window, µ(G) is all the total population which are in the area of study, nz is the number of cases in a circular scanning window Z, nG is the number of cases in the study area of G, p is the average rate of occurrence event in a circular scanning a window and q is the rate of the event outside a circular scanning window [13].
Figure 1. Study area and circular window illustration in KSS method [13]
In this research, we use the KSS method with a Poisson model to determine the value of the possibility scanning window ratio (likelihood ratio) [9]. KSS with a Poisson model used to compare the number of case occurrences in and out scanning window. It used to search for clusters of hotspot in this research and following the process inhomogeneous Poisson. Under the null hypothesis of spatial and temporal randomness, these events are distributed according to a known discrete-state random process (Poisson or Bernoulli), which parameters can be estimated. Given this assumption, it is possible to test whether or not the null hypothesis holds in a specific area [9].
Equation 1 is used to calculate the function of the ratio of the possibility for each a circular scanning window Z with Poisson model. The nz is the number of cases in the circular
scanning window Z, ez is the expected cases in the circular scanning window Z, nG is the number of cases in the study area of G [15].
λ Z nZ
eZ nZ
. nG-nZ nG-eZ
nG-nZ
, if nZ>eZ (1)
1, otherwise
eZ μ Z
nG
μG (2)
The most likely cluster is calculated for each simulated dataset in exactly the same way as the real data.Statistical significance is evaluated using Monte Carlo hypothesis testing [9]. Monte Carlo simulation was performed with at least 999 replications under the null hypothesis. If the cluster of interest contains more than 95% of the replications, the cluster is said to be significant at the 95 % level [9]. In the implementation of this research, we utilized clustering packages of data in R statistical tools, and Postgre SQL for database management. We use ‘spatialepi’ R package developed by [14] to cluster dataset.
3. Results and Discussion
3.1. Distribution of Hotspot in the Peatland Area in Sumatra in the Year 2014
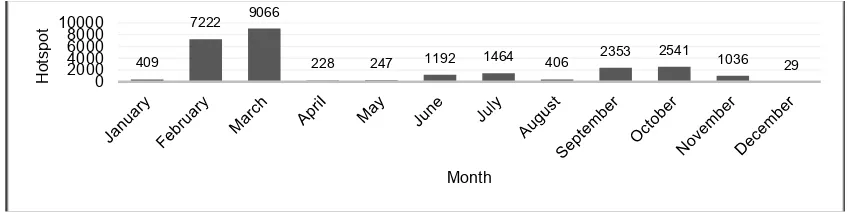
The number of hotspots in the year 2014 amounted to 39 407 hotspots. While in the peatland area amounted to 26 193 hotspots. The number of hotspots is scattered in an area of peatland in the year 2014 in Sumatra can be seen in Figure 2.The highest density of hotspot based on the maturity level of peat in Sumatera in the year 2014 located in the maturity level of ’Hemic/Sapric (60/40), very deep’ with average density value 7.913/km2. The highest density based on the thickness of peatland in Sumatera from 2001 to 2014 dominated by very deep thickness which reached 4.016/km2. Land use that detected in the peatland area in Sumatera there are 25 types. The highest density based on the land use of peatland in Sumatera in the period of 2014 dominated by swamp forest which reached 1.425/km2.
Figure 2. Number of hotspot non-peatland areas in Sumatera in the year 2014
3.2. Cluster Distributions of Hotspot in Sumatera in the Year 2014
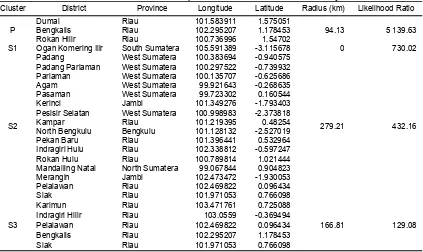
Hotspot spread in 39 districts in Sumatera with total areas of peatland distribution reached 77 832 km2. Locations which have the most distribution of hotspot during the year 2014 are Riau province (Rokan Hilir: 5 793 hotspots, Bengkalis: 5 343 hotspots, Siak: 3 010 hotspots, Indragiri Hilir: 1 910 hotspots, Dumai: 1 295 hotspots and Pelalawan: 671 hotspots), South Sumatra province (Ogan Komering Ilir: 4 463 hotspots). Clustering hotspots with KSS method in peatland area in Sumatera can detect where the occurrence of cluster hotspots, when cluster hotspot held, and the geographical size of cluster hotspots. KSS clusters and measure their significance via Monte Carlo replication. Results showed that the method is reliable to detect the clusters of hotspots which have the accuracy of 95%.
Table 1 shows the cluster distributions in the peatland area in Sumatera that held inthe year 2014.In the year 2014 consists of 4 clusters. As shows in Table 1 most likely cluster (P) in Dumai, Bengkalis, and Rokan Hilir district in Riau province. The radius of most likely cluster is defined 94.13 km. The cluster is resulted from scanning a window that it is centred on the latitude and longitude coordinates (101.583911, 1.575051). The secondary cluster I (S1) is in Ogan Komering Ilir in South Sumatera province. Cluster centre of secondary cluster II (S2) is Padang district in West Sumatera province. A location which has the most distribution of hotspot is Siak district in Riau province. As shows in table 1 the radius of secondary cluster II is defined 432.16 km. The secondary cluster III (S3) is in Siak, Bengkalis, Indragiri Hilir, Pelalawan and
409
7222 9066
resulting from scanning a window centred on the latitude and longitude coordinates (103.471761, 0.725088). The p-value for this cluster is 0.00000001 that was obtained using the 999 Monte Carlo simulations.
Table 1. The cluster distributions in peatland area in Sumatera in the years 2014
Cluster District Province Longitude Latitude Radius (km) Likelihood Ratio
P
Dumai Riau 101.583911 1.575051
94.13 5 139.63
Bengkalis Riau 102.295207 1.178453
Rokan Hilir Riau 100.736996 1.54702
S1 Ogan Komering Ilir South Sumatera 105.591389 -3.115678 0 730.02
S2
Padang West Sumatera 100.383694 -0.940575
279.21 432.16
Padang Pariaman West Sumatera 100.297522 -0.739932
Pariaman West Sumatera 100.135707 -0.625686
Agam West Sumatera 99.921643 -0.268635
Pasaman West Sumatera 99.723302 0.160544
Kerinci Jambi 101.349276 -1.793403
Pesisir Selatan West Sumatera 100.998983 -2.373818
Kampar Riau 101.219395 0.48254
North Bengkulu Bengkulu 101.128132 -2.527019
Pekan Baru Riau 101.396441 0.532964
Indragiri Hulu Riau 102.338812 -0.597247
Rokan Hulu Riau 100.789814 1.021444
Mandailing Natal North Sumatera 99.067844 0.904823
Merangin Jambi 102.473472 -1.930053
Pelalawan Riau 102.469822 0.096434
Siak Riau 101.971053 0.766098
S3
Karimun Riau 103.471761 0.725088
166.81 129.08
Indragiri Hilir Riau 103.0559 -0.369494
Pelalawan Riau 102.469822 0.096434
Bengkalis Riau 102.295207 1.178453
Siak Riau 101.971053 0.766098
*Note: P = Most likely clusters (primarily cluster) and S = Secondary clusters
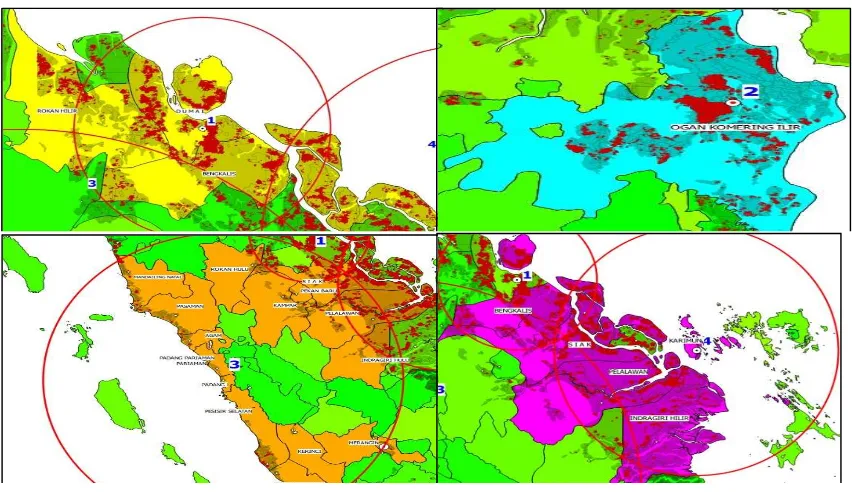
Figure 3 shows cluster distributions of hotspots in peatland areas in Sumatera in the year 2014 which are consist of 4 clusters detected (1 cluster as most likely cluster and 3 clusters as secondary cluster). The location that has most likely cluster is in Riau province, especially in Rokan Hilir, Bengkalis, and Dumai. Ogan Komering Ilir district in South Sumatra province is the location that has the highest density of secondary cluster. Figure 4 shows most likely cluster and secondary cluster distributions of hotspot in the peatland area in Sumatera.
Figure 3. Cluster distributions of hotspots in peatland area in Sumatra in the year 2014
Figure 5. Cluster distributions of hotspots based on the maturity level of peat in the year 2014
Based on Figure 5, many hotspots found in peatland with the maturity level of ’hemic’ and the thickness level of ’moderate’ that generally located in the dome of peat and close from residential. When ‘hemic’ maturity levels of peat dominated on the outskirts of peat domes indicated the damage of the peat dome very high. Combined with the drainage to overcome dryness of peat it makes excretion of water that is in the dome pea. If the water at the dome of peat missing, hence peat experienced leakage so function hydrology peat being broken [2].
Figure 6 shows cluster distributions of hotspots based on the thickness of Portland in Sumatera in the year 2014. Cluster distributions of hotspot are dominated by ’very deep thickness (D4) (400-800 cm)’ and ’moderate thickness (D2) (100-200 cm)’. The location that has the highest density of cluster hotspot with ’very deep thickness (D4) (400-800 cm)’ be in Riau province, especially in the district of Rokan Hilir, Siak, Indragiri HIlir and Bengkalis. While the locations that have the highest density of cluster hotspot with ’moderate thickness (D2) (100-200 cm)’ be in South Sumatera province, especially in the district of Ogan Komering Ilir; in Riau province especially in the district of Bengkalis, Siak, and Indragiri HIlir. As demand by an Indonesian government regulation number 32 years 1990, peatland area that have ’deep’ and ’very deep’ thickness (>300 cm) should not be opened for agriculture development. Based on RTRWN that in line with constitution number 21 years 1992 regarding areas planning (UUTR),the protection against the peat should be done to control hydrological areas, serves as a fastening water, flood prevention, and protecting the ecosystem that is typical of the area [16].
Figure 6. Cluster distributions of hotspots based on the thickness of peat in the year 2014
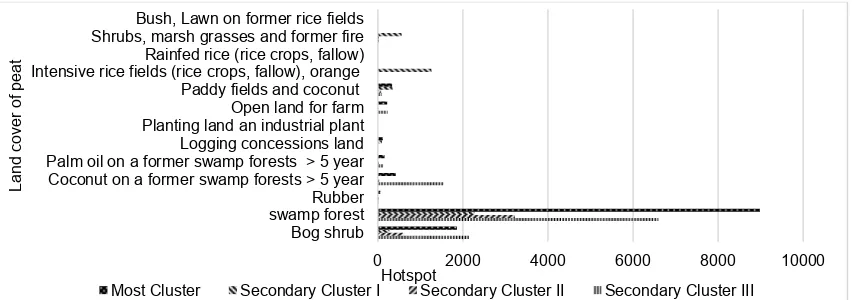
Figure 7 shows cluster distributions of hotspots based on the land use of peatland in Sumatera in the year 2014. The distribution clusters of hotspot based on the land use of peatland are dominated by swamp forest. The location that has the highest density of cluster
0 1000 2000 3000 4000 5000 6000 7000
Fibrists/Saprists (60/40),moderate
Most Cluster Secondary Cluster I Secondary Cluster II Secondary Cluster III
0
hotspot is in Riau province, especially in the district of Rokan Hilir, Bengkalis, and Siak; South Sumatera province especially in the district of Ogan Komering Ilir. The swamp forests are to be an area of forest fires on the drought and in the dry season. The damage caused by forest fire in the swamp forest aims serious negative impact.
Figure 7. Cluster distributions of hotspots based on the land cover of peat in the year 2014
4. Conclusion
This work applied Kulldorff’s Scan Statistic (KSS) on the spatial temporal forest fires dataset. The dataset consists of the spatial aspect (longitude, latitude) of the hotspot, temporal aspect (date of occurrence) of hotspot, and peatland physical characteristics that may influence the distribution pattern of hotspot clusters in the study area Sumatera province, Indonesia. KSS method uses circulars scanning windows to detect the clusters of hotspots. Every circular scanning window will find the ratio of the possibility using Poisson model. The test statistic is determined as the maximum likelihood ratio over all circular windows. Evaluating the statistical significance is calculated by generating a large number of random datasets under the null hypothesis of no clustering. Next step is calculating the value of the test statistic for each of those datasets. The region with the highest value of likelihood ratios is the area that has the most potential clusters. Clustering hotspots with KSS method can detect where the occurrence of cluster hotspots, when cluster hotspot held, and the geographical size of cluster hotspots.
Clustering hotspot in the peatland areas in Sumatera in the year 2014 with the KSS method discover patterns of hotspot distribution which consist of 4 clusters. The radius of most likely cluster is defined 94.13 km. The provinces with the occurrences of the highest hotspot cluster are located in Riau province and South Sumatera province, especially in Dumai, Bengkalis, Rokan HIlir and Ogan Komering Ilir district. Based on the maturity level of peat, cluster distributions of hotspot were mostly found in ‘hemic’ maturity level. Based on peatland thickness, cluster distribution of hotspot was mostly found in ‘very deep’ thickness. Based on land use of peatland, cluster distributions of hotspot were mostly found in ’swamp forests’.
References
[1] Glover D, Jessup T. Mahalnya Harga Sebuah Bencana. Bandung (ID): ITB. 2002.
[2] Syaufina L. Kebakaran Hutan dan Lahan di Indonesia. Malang: Bayumedia Publishing. 2008.
[3] Sitanggang IS, Yaakob R, Mustapha N, Ainuddin AN. A Decision Tree Based on Spatial Relationships for Predicting Hotspots in Peatlands. TELKOMNIKA Telecommunication, Computing, Electronics and Control. 2014; 12 (2): 511-518.
[4] Han J, Kamber M, Pei J. Data Mining Concept and Techniques Third Edition. United of States (US): Elsevier Inc. 2012.
[5] Madhulata T. An Overview on Clustering Methods. IOSR Journal of Engineering. Apr. 2012; 2(4): 719-725.
[6] Sitanggang IS, Fuad T, Annisa. K-Means Clustering Visualization of Web-Based OLAP Operations for Hotspot Data. IEEE. 2010; 978-1-4244-6716-7/10/$26.00.
0 2000 4000 6000 8000 10000
Bog shrub swamp forest Rubber Coconut on a former swamp forests > 5 year Palm oil on a former swamp forests > 5 year Logging concessions land Planting land an industrial plant Open land for farm Paddy fields and coconut Intensive rice fields (rice crops, fallow), orange Rainfed rice (rice crops, fallow) Shrubs, marsh grasses and former fire Bush, Lawn on former rice fields
Hotspot
Land cover of peat
[7] Usman M, Sitanggang IS, Syaufina L. Hotspot Distribution Analyses based on Peat Characteristics using Density-Based Spatial Clustering. The 1st International Symposium on LAPAN-IPB Satellite for Food Security and Environmental Monitoring. Procedia Environmental Sciences. 2015; 24: 132 – 140.
[8] Sitanggang IS, Yaakob R, Mustapha N, Ainuddin AN. Burn Area Processing to Generate False Alarm Data for Hotspot Prediction Models. TELKOMNIKA Telecommunication, Computing, Electronics and Control. 2015; 13(3): 1037-1046.
[9] Kulldorff M. A Spatial Scan Statistic. Communications in Statistics: Theory and Methods. 1997; 26: 1481-1496.
[10] Devis T, Fréderic R, Rosa L, Luciano T, Mikhail K. Scan statistics analysis of forest fire clusters.
ELSEVIER Communications in Nonlinear Science and Numerical Simulation. 2008; 13(80): 1689– 1694
[11] Wahyunto, Ritung S, Suparto, Subagjo H. Sebaran Gambut dan Kandungan Karbon di Sumatera dan Kalimantan. Bogor (ID): Wetlands International IP. 2005.
[12] Cao CX, Xu M, Chen JQ, Wu YS, Xie X. Space-Time Scan Statistic Based Early Warning of H1N1 Influenza A in Shenzhen, China. International Archives of the Photogrammetry, Remote Sensing and Spatial Information Science. Kyoto: Japan. 2010; 28(8).
[13] Wen S, Kedem B. A semiparametric Cluster Detection Method a Comprehensive Power Comparison with Kulldorffs Method. International Journal of Health Geographics. BioMed Central. USA. 2009 [14] Kim AY, Wakefield J. R Data and Method for Spatial Epidemiology: The Spatial Epi Package. Dept of
Statistics, University of Washington. 2010.
[15] Kulldorff M. 2014. SaTScan User Guide [downloaded at 2014 July 2]. Available at http://www.satscan.org/.