Development of a New System Approach to Land
Use Sustainability with Various Interfaces
Tien-Yin Chou, ChihYuan Chien, ChihWei Kuan, YaWen Chang, MeiLing Yeh, YuChen Lai Geographic Information System Research Center
Dept. Crop, Forest and Environ. Sciences University of Basilicata
Potenza, Italy E-mail: [email protected]
Abstract—SALUS (System Approach to Land Use Sustainability) model is developed from CERES and DSSAT is designed to simulate the impact of agronomic management on yield and environmental impact. SALUS model has new approaches and algorithms for simulating soil carbon, nitrogen, phosphorous, tillage, soil water balance and yield components. In the past, the use of the crop model was not easy for general users like farmers and officers because of the detailed input data and complex setup. In order to increase the usage of crop model, we develop a web-based applications, SALUS Simple Interface and SALUS-WEBGIS system, besides the existing SALUS desktop version. SALUS Simple Interface is a user friendly application interface without cumbersome steps. People could know what the sensible management practice for their fields is by using the SALUS Simple Interface. SALUS-WEBGIS helps people to know the spatial variability of crop yield and soil condition. Users could improve their management strategies according to the simulation. SALUS Simple Interface and SALUS-WEBGIS could assess the impacts on the environments under different management practices through the spatial and temporal variability. The simple operations could engage more people to understand the importance of sustainable development and try to improve on agronomic management.
Keywords-Crop Model; GIS; Sustainable Development
I. INTRODUCTION
Agricultural activity is the most important industry for humans from ancient times to now. It provides the energy and the nutrition that humans need for existence. For decades, humans started being aware of the importance of sustainable development because the environmental destruction which was due to the rapid increase of population and excessive consumption of resources has influenced the living space of them. The sustainable development in agriculture is one of the most important parts of sustainable development. The development of precision agriculture and digital agriculture bring about many positive effects in sustainable development of agriculture.
SALUS (System Approach to Land Use Sustainability) model is developed from CERES and DSSAT is designed to
simulate the impact of agronomic management on yield and environmental impact. SALUS model has new approaches and algorithms for simulating soil carbon, nitrogen, phosphorous, tillage, soil water balance and yield components. In the past, the use of the crop model was not easy for general users like farmers and officers because of the detailed input data and complex setup. We have simplified the interface of SALUS program and developed a web based version of SALUS model. Users can use this model via the Internet to understand what the sensible management practice for their fields is.
Crop growth model and Geographic Information System (GIS) are essential to achieve the sustainable development of agriculture. These two technologies can help to assess the sustainable use of agricultural land in different ways. Crop growth model can assess if the management practice is proper the fields or not. GIS is a kind of useful tool to process, analyze and display the spatial data. [3] Global change impact on agricultural activities extensively. In order to take the advantages of crop growth models to assess and analyze the environment problems extensively, in this study, we used SALUS model to integrate with GIS and design an integrated system, SALUS-WEBGIS which combine crop growth model with GIS. Users can simulate with different agricultural management practices and display the simulation result with thematic maps in SALUS-WEBGIS. It can help researchers to analyze and comprehend the spatial variation through the thematic maps. SALUS-WEBGIS improves on the abilities to process spatial data and to visualize the simulation results.
The objectives of this paper were i) to illustrate the SALUS model; ii) to introduce SALUS with simple interface and SALUS-WEBGIS; iii) to demonstrate the workflows of the these two systems.
II. METHODOLOGY
A. Brief overview of the SALUS model
strategies may have various crop rotations, planting dates, plant populations, irrigation and fertilizer applications, and tillage regimes. The program will simulate plant growth and soil conditions every day (during growing seasons and fallow periods) for any time period when weather sequences are available. For any simulation run, a number of different management strategies can be run simultaneously. By running the different strategies at the same time we can compare this effect on crops and soil under the same weather sequences. This also provides a framework whereby the interaction between different areas under different management practices can be easily compared.
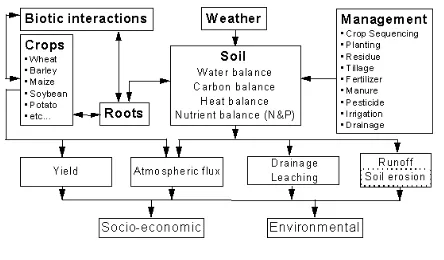
Every day, and for each management strategy being run, all major components of the crop-soil-water model are executed. These components are management practices, water balance, soil organic matter, nitrogen and phosphorous dynamics, heat balance, plant growth and plant development. The water balance considers surface runoff, infiltration, surface evaporation, saturated and unsaturated soil water flow, drainage, root water uptake, soil evaporation and transpiration. The soil organic matter and nutrient model simulates organic matter decomposition, N mineralization and formation of ammonium and nitrate, N immobilization, gaseous N losses and three pools of phosphorous. The development and growth of plants considers the environmental conditions (particularly temperature and light) to calculate the potential rates of growth for the plant. This growth is then reduced based on water and nitrogen limitations.
The biophysical model is composed of three main structural components: i) a set of crop growth modules; ii) a soil organic matter and nutrient cycling module and; iii) a soil water balance and temperature module.
The crop growth modules are derived from the CERES [1] and IBSNAT [2] family of crop production models that were originally developed for single year, monoculture simulations. The crop growth algorithms from these were extracted and restructured into crop growth modules that are linked to the soil water, nutrient and management sub-models. SALUS has been programmed in the "C" language to make the memory allocation more dynamic and program code more platform independent. Current operational crop growth modules include maize, wheat, barley, sorghum and millet. A generic grain legume module (e.g., soybean, dry
beans) and alfalfa growth modules are being added to the system. The basic controls on production processes are the same as in the original models. Physic development is controlled by environmental variables (e.g., degree days, photoperiod) governed by variety-specific genetic coefficients. Carbon assimilation and dry matter production are a function of potential rates (controlled by light interception and parameters defining the variety-specific growth potential) which are then reduced according to water and/or N limitations. The main external inputs required for the crop growth routines are the genetic (variety-specif) coefficients and daily solar radiation as a driving variable.
The soil organic matter (SOM) and nitrogen module is derived from the Century model, with a number of modifications incorporated. The model simulates organic matter and N mineralization/immobilization from three SOM pools (active, slow and passive) which vary in their turnover rates and characteristic C:N ratios. There are two crop residue/fresh organic matter pools (structural and metabolic), for representing recalcitrant and easily decomposable residues, based on residue lignin and N content. A surface active SOM pool associated with the surface residue pools was added to better represent conservation tillage systems and perennial crops. The soil phosphorous (P) model incorporates inorganic and organic phosphorous dynamics. Inorganic P is divided into three pools i) labile; ii) active; and iii) stable.
The soil water balance module is based on that used in the CERES models but incorporates a major revision in calculating infiltration and runoff. In SALUS, a time-to-ponding (TP) concept is used to replace the previous runoff and infiltration calculations which were based on SCS runoff curve numbers.
The SALUS model does not explicitly include sub-models to predict pest and disease outbreaks or the occurrence of extreme weather events (e.g., hail). We recognize that these factors can have a major impact on crop production and yield and the sustainability of a particular management system. However, the multitude of potential pest species and disease-causing organisms of major crop species in the U.S. precludes the inclusion of pest dynamics sub-models explicitly within a general cropping systems model such as SALUS. Similarly, it is unrealistic to attempt to predict the occurrence of extreme weather events within the model structure. It can be downloaded at http://www.salusmodel.net.
B. Web-based system design
a) SALUS with simple interface
Existing desktop version of SALUS model has powerful ability to simulate plant growth and soil conditions. In order to prepare a complete simulation, users have to input detailed information include weather data, soil data, crop data, planting events, irrigation events, residue events, fertilizer events and harvest events. Each event needs implement date, amount and methods etc. For general users, it is not easy to provide minimum input data of SALUS model. In order to increase the usage of crop model, we developed a web-based application, SALUS with simple interface. It is designed for
Figure 1. The Components of SALUS
Figure 2. The architecture of SALUS with simple interface
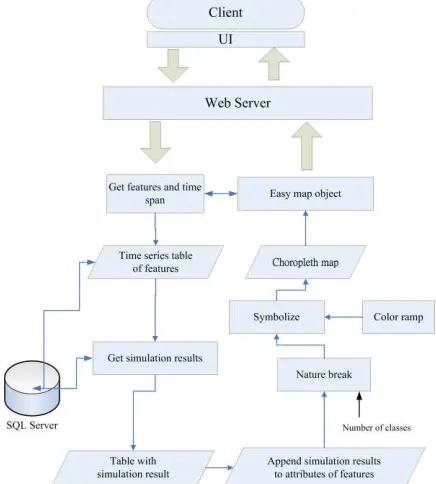
Figure 3. The architecture of SALUS-WEBGIS
Figure 4. The integration of polygons and SALUS data
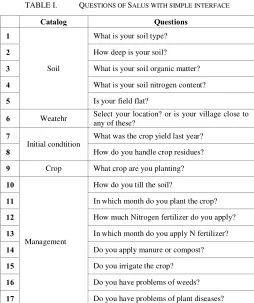
the beginners of environmental model with a friendly user interface and is easy to use. Compare to the desktop software, users do not have to install any software by using web application. There are 17 questions (Table I.) which users have to answer in the user interface to acquire the minimum input data of model. The outputs consist of crop yield, nitrate leaching into the groundwater, CO2 emission from soil and soil organic carbon. After simulating, this system extracts the average value, the best value and the worse value from the simulation results of many years for each output besides soil organic carbon. Soil organic carbon is the difference of the amount of soil organic carbon from the first day to the last day of simulation.
TABLE I. QUESTIONS OF SALUS WITH SIMPLE INTERFACE
Catalog Questions
1
Soil
What is your soil type?
2 How deep is your soil?
3 What is your soil organic matter?
4 What is your soil nitrogen content?
5 Is your field flat?
6 Weatehr Select your location? or is your village close to any of these?
7
Initial condtition
What was the crop yield last year?
8 How do you handle crop residues?
9 Crop What crop are you planting?
10
Management
How do you till the soil?
11 In which month do you plant the crop?
12 How much Nitrogen fertilizer do you apply?
13 In which month do you apply N fertilizer?
14 Do you apply manure or compost?
15 Do you irrigate the crop?
16 Do you have problems of weeds?
17 Do you have problems of plant diseases?
SALUS with simple interface is a three tier architecture system (Fig. 2.). On the client side, Macromedia Flash was used to build a Rich Internet Application (RIA) to meet the needs of a simple interface. On the server side, a web service receives the input data from the client side and starts to simulate SALUS model. After simulating, the web service will store the results into the SQL server database and pass the results to the client side.
b) SALUS-WEBGIS
ARCHITECTURE
SALUS-WEBGIS is an integration system follows a tight coupling strategy integrated SALUS model [4] with Easy map object1 into a web application. SALUS model is converted into a dynamic link library that can be called from the new application and linked to it at runtime. This allows a smooth integration between GIS and the simulation models.
SALUS-WEBGIS was deployed in a windows environment, and is built around IIS and the SQL server relational database management system, which was chosen due to its ability to efficiently store, search, and retrieve data in large databases (Fig. 3.). The user interface was built by using ASP.NET and AJAX technology. Web server receives the requests from client side and retrieves data from SQL server and maps from Easy map object according to the requests.
DATA
SALUS-WEBGIS adopted ESRI Shapefile to be the data source of spatial data. The geometry type of features was limited to polygons. Polygon features were used to display the spatial variability of simulations. A management practice is called an experiment in SALUS-WEBGIS. Experiments record weather data, soil data and the strategies of cultivation including planting, irrigation, tillage, residues, fertilizer and
1
Figure 5. The workflow of crop growth simulation module
Figure 6. The workflow of data management module
Figure 7. The workflow of thematic map module
Figure 8. The dialogue boxes of SALUS with simple interface
Figure 9. The simulation results of SALUS with simple interface
harvest. Each polygon was linked to a unique experiment. Similarly, the simulation results of experiments were appended to the attributes of polygons (Fig. 4.).
SALUS-WEBGIS has the same model kernel as SALUS model. There are some differences between them. To reduce the complexity of using SALUS-WEBGIS, input data were decreased or some data were set default values. Output data also were reduced because only a few simulation results are suitable for mapping.
FEATURES
SALUS-WEBGIS is designed for the advisors of farmers or agricultural officers. It assumed to be a tool for precision agriculture. There are three main features in SALUS-WEBGIS. They are crop growth simulation module, data management module and thematic map module. The following is the details of each module.
Crop growth simulation module is the controller of SALUS model (Fig. 5.). It receives requests from the client. Then it lists all features that are selected. Finally it starts to simulate all experiments correspond to features.
Data management module consists of all functions relating to data management include spatial data and non-spatial data (Fig. 6.). Spatial data was controlled by Easy map object. Users can view, create and edit maps through Easy map object. Non-spatial data include input data and simulation results were accessed through ADO.NET.
Figure 10. Comparative table of simulation results
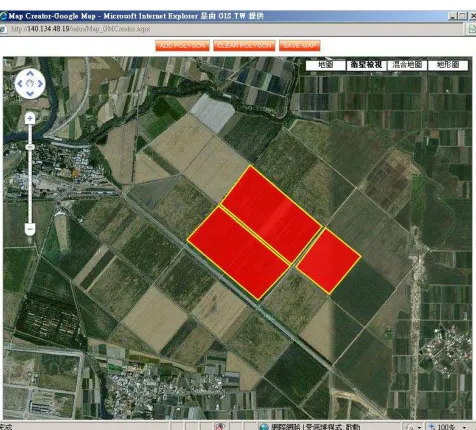
Figure 11. Users can use Google map to create new map for SALUS-WebGIS
Figure 12. The main page of SALUS-WEBGIS
Figure 13. Soil data and weather data can be create by importing DSSAT or SALUS data.
Figure 14. The time series thematic map of simulation reuslts
Thematic map module creates thematic maps from spatial data which were linked to simulation results (Fig. 7.). Before creating a thematic map, users have to select a result that will be appended to the attributes of features. In SALUS-WEBGIS, simulation results may have multiple years. Thematic map module can build a time series map of a particular result. After retrieving all simulation results of features, module appends all results to the attributes. Jenks' natural breaks classification was used to classify the values of all features in a map in order to create a choropleth map.
III. SYSTEM IMPLEMENTATION
A. SALUS with simple interface
SALUS with simple interface has four dialogue boxes with 17 questions to acquire the input data from users (Fig. 8). After simulating, this system will show the results were extracted from many years. If the average of nitrate leaching into the groundwater exceed one thirds of the amount of fertilizer and the soil organic carbon is negative, this system will tell users the management is not environmentally friendly, and vice versa (Fig. 9.). The results of every simulation are comparable. This system preserves maximum ten simulation results. The latest simulation will replace the oldest one (Fig. 10.).
B. SALUS-WEBGIS
any simulations without maps and experiments. In the service of map, users can upload their own shapefiles or digitize the area of interest on Google map (Fig. 12.). In the service of experiment, users can create, edit, and delete the experiment. Soil data and weather data can be created by uploading DASST format data (.sol or .wth) or SALUS format data (.sdb or .wdb) (Fig. 13.). In the service of project, users can organize a simulation project from maps and experiments. Each project has a unique map that covrs the area of interest. Each feature of a map is linked to a particular experiment. SALUS model is used to simulate all experiments in a project. After simulating, results can be displayed in a time series thematic map or charts (Fig. 14).
IV. CONCLUSION
. SALUS is a powerful model to assess sustainability of land use. SALUS with simple interface could engage more people to understand the importance of sustainable development and try to improve on agronomic management. SALUS-WEBGIS overcomes the limits of point-based data in visualization and displays spatial variations and temporal variations of the results. Each user has their own maps and
data in database. Decision makers have the responsibility to minimize the environmental impacts of land management policies. SALUS-WEBGIS can help decision makers understand the applicability of various management practices to relevant regions. These new tools can help environmental managers to achieve the sustainable use of the agricultural land.
REFERENCES
[1] Ritchie J.T., Godwin D.C., Otter-Nacke S. CERESWheat:A simulation model of wheat growth and development.Texas A&M University Press, CollegeStation, TX. 1985.
[2] Ritchie J.T., Singh U., Godwin D.C., Hunt L. Auser’s guide to CERES Maize-V.2.10. Muscle Shoals,AL. International Fertilizer Development Center. 1989.
[3] Chang, K. T. Introduction to Geographic Information Systems, McGrawHill. 2004
[4] Karimi, H. A., & Houston, B. H. Evaluating strategies for integrating environmental models with GIS: current trends and future needs, Computers, Environment and Urban Systems, 20(6), 413-425. 1996