17 CHAPTER 3 METHODOLOGY
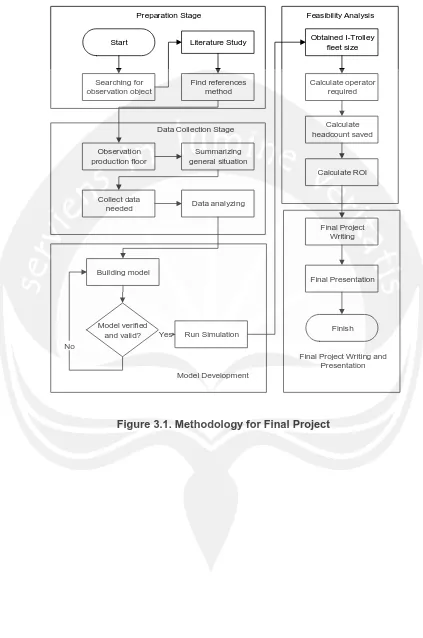
For solving the problem, there are five main stages from data preparation stage until final project writing stage. Preparation stage become the first stage of final project writing. After preparing data, data collection stage will be started. Next stage will be processing the data and verify that the solution feasible and valid. Final project writing will become the last stage of this project.
3.1. Preparation Stage
The first phase on this research is preparation stage. There are several steps should be done in preparation stage. The purpose of this stage is to have clear perception and understanding on the research project, brainstorming on possible method to solve the problem, and prepare necessary tools to finish the research. The first step is problem identification. There was a problem to determine fleet size in designing phase automated material handling system in the shop floor of hard disk manufacturers and numbers of operators can be saved after implementation to analyze profitability of investment. After problem identification, previous research about fleet sizing was searched. All of previous research was mapped and all of the features were summarize. The features of previous research will be compared with features arise in I-Trolley usage in production floor and search best method to solve the problem.
18 3.2. Data Collection Stage
After preparation stage, the second stage will be collecting data that necessary in this research. Observation was taken in the production floor to have clear situation on current situation, automated material handling system planning, and I-Trolley concept. Process flow diagram is needed to depict situation occurred in observation object.
All data which are important to solve this project should be recorded. Distance between process that connected by automated material handling and also cycle time of prototype in transporting material will be recorded to determine the average cycle time of I-Trolley. Holding cost of WIP also will be recorded. Another primary data that will be taken are the features of I-Trolley that implemented in production floor. I-Trolley operational cost and capacity become another data that will be useful to become inputs in the model. Cycle time of processes that will be connected with automated material handling will be recorded due to stochastic nature. Cycle time of work center that also become loading point of I-Trolley will become inter-arrival time of product and cycle time of work center that become unloading point of I-Trolley also recorded in order to calculate possible minimum waiting time. Cycle time is taken during 100 percent shop floor operated because the result of fleet sizing is expected to support factory when fully operated.
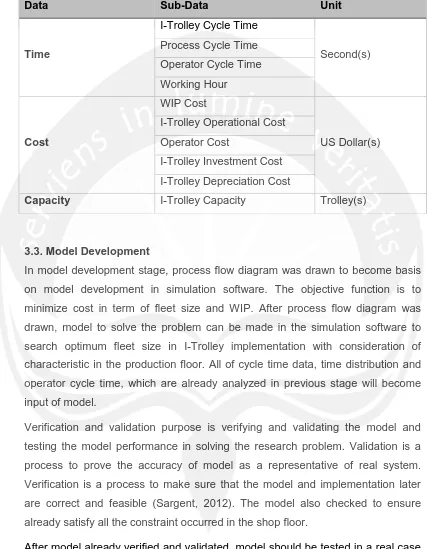
Data of operator cycle time for each work element to operate I-Trolley prototype also recorded. For initial research, 30 data of operator cycle was recorded. Operator cost will be recorded to see savings from previous conditions before implementing automated material handling. Lastly, work hour of production floor also recorded to determine worker capacity. Summary of data taken will be shown in Table 3.1.
19
Table 3.1. Summary of Data Taken
Data Sub-Data Unit
Time
I-Trolley Cycle Time
Second(s) Process Cycle Time
Operator Cycle Time Working Hour
Cost
WIP Cost
US Dollar(s) I-Trolley Operational Cost
Operator Cost
I-Trolley Investment Cost I-Trolley Depreciation Cost
Capacity I-Trolley Capacity Trolley(s)
3.3. Model Development
In model development stage, process flow diagram was drawn to become basis on model development in simulation software. The objective function is to minimize cost in term of fleet size and WIP. After process flow diagram was drawn, model to solve the problem can be made in the simulation software to search optimum fleet size in I-Trolley implementation with consideration of characteristic in the production floor. All of cycle time data, time distribution and operator cycle time, which are already analyzed in previous stage will become input of model.
Verification and validation purpose is verifying and validating the model and testing the model performance in solving the research problem. Validation is a process to prove the accuracy of model as a representative of real system. Verification is a process to make sure that the model and implementation later are correct and feasible (Sargent, 2012). The model also checked to ensure already satisfy all the constraint occurred in the shop floor.
20 3.4. Feasibility Analysis
Feasibility analysis purpose is to analyze investment feasibility on I-Trolley in production floor for material handling activity. Savings from I-Trolley project is in form of headcount reduced after implementation. Therefore, calculation of operator required to operate I-Trolley system should be made and compared with current situation when manual material handling still implemented. Calculation of operator required is based on cycle time operator in operating I-Trolley prototype. Standard time sample for operators to operating prototype of I-trolley will be analyzed to satisfy the assumption of uniformity and data sufficiency so data can be said as valid data. Software Minitab and Microsoft Excel can be used to analyze. After the standard time is satisfy all of the requirement, cycle time of operating I-Trolley will be calculated with considering of allowance standard from company and compared with working hours of the operators to determine the amount of operators. Therefore, number of operators required and number of operator in current situation can be seen and savings in headcount reduced can be calculated.
Return of Investment (ROI) can be calculated to see investment feasibility of I-Trolley system. There are many method to do feasibility analysis as mentioned before in previous chapter and conclusion of feasibility analysis can be made. Sensitivity analysis is also done to support decision making in I-Trolley investment.
3.5. Final Project Writing and Presentation
21 Start
Searching for observation object
Literature Study
Find references method
Observation production floor
Summarizing general situation
Collect data
needed Data analyzing
Building model
Run Simulation Model verified
and valid?
Calculate ROI Calculate headcount saved Calculate operator
required
Finish Obtained I-Trolley
fleet size
Final Project Writing
Final Presentation Preparation Stage
Data Collection Stage
Model Development
Feasibility Analysis
Final Project Writing and Presentation No
[image:5.595.87.510.98.736.2]Yes