Comparative study on preliminary breakdown pulse trains observed
in Johor, Malaysia and Florida, USA
Z.A. Baharudin
a,⁎
, Noor Azlinda Ahmad
a, M. Fernando
b, V. Cooray
a, J.S. Mäkelä
c aDivision for Electricity, Department of Engineering Sciences, Ångström Laboratory, Uppsala, SwedenbDepartment of Physics, University of Colombo, Sri Lanka cNokia Oyj, Salo, Finland
a r t i c l e
i n f o
a b s t r a c t
Article history:
Received 1 February 2011
Received in revised form 26 January 2012 Accepted 26 January 2012
Available online xxxx
In this paper, the preliminary breakdown (PB) pulse train preceding the negative first return stroke (RS) is recorded using a broad band antenna system. These analyses were carried out in Johor Bahru, Malaysia and Florida, United States. This is a novel initiative at examining and identifying the characteristics of the PB pulse trains in the negative cloud-to-ground flashes observed in Malaysia. The arithmetic mean of the total pulse train duration is 12.3 ms and the weighted arithmetic mean of the pulse durations and interpulse intervals are 11μs and 152μs, respectively. The arithmetic mean ratio between the maximum peak
am-plitude of the PB pulse and the peak RS electric field was 27.8%, and the corresponding value in Florida was 29.4%. The arithmetic mean of the time duration between the most active part of the pulse train, and the RS was 57.6 ms in Malaysia and 22 ms in Florida. A qualitative compar-ison of our results with those obtained earlier in Sri Lanka, Sweden and Finland supports the hypothesis that the PBP/RS ratio is higher in the northern regions compared to the tropical regions.
© 2012 Elsevier B.V. All rights reserved. Keywords:
Preliminary breakdown pulses PB/RS ratio
PB-RS separation
1. Introduction
The first electric field signature generated by a ground lightning flash sometimes produces a pulse train of relatively large microsecond-scale electric field pulses known as the preliminary breakdown (PB) pulse train. The characteristic features of PB pulse trains in negative cloud-to-ground flashes have been reported byClarence and Malan (1957), Kitagawa and Brook (1960), Beasley et al. (1982), Brook (1992), Cooray and Scuka (1996), Gomes et al. (1998), Cooray and Jayaratne (2000), Gomes and Cooray (2004), Mäkelä et al. (2008), and Nag and Rakov (2009). These pulse trains may provide information concerning the first event that led to the electrical breakdown in the cloud. Any differences in the PB pulse trains in different geographical regions may indicate differences in the initial breakdown
processes in the clouds. For this reason, it is important to an-alyze and compare the features of these pulse trains in differ-ent geographical regions.
Gomes et al. (1998)andCooray and Jayaratne (2000) an-alyzed and compared the ratios of the amplitude of electric field peaks of the initial half-cycle of the largest PBP train and the corresponding first return strokes (RS) in Sweden and in Sri Lanka. They observed that the ratio is much higher in Sweden than in Sri Lanka. They suggested that the reason for this difference is the weaker positive charge pocket in tropical thunderclouds compared to those observed in higher latitudes.Mäkelä et al. (2008)duplicated the study with a larger data sample and came to the same conclusion. Howev-er, the data available in the literature on PB pulses from trop-ical thunderclouds is scarce, and there is a need to gather more data from tropical thunderclouds. In the present study we have recorded the electric fields, including the PB pulse trains generated by lightning flashes in Johor and Florida. To the best of our knowledge this is the first time in Malaysia that the electromagnetic fields generated by the whole flash
Atmospheric Research xxx (2012) xxx–xxx
⁎Corresponding author. Tel.: + 6065552365; fax: +46 18 4715810.
E-mail address:zikri.baharudin@angstrom.uu.se(Z.A. Baharudin).
0169-8095/$–see front matter © 2012 Elsevier B.V. All rights reserved.
doi:10.1016/j.atmosres.2012.01.012
Contents lists available atSciVerse ScienceDirect
Atmospheric Research
occurring with several nanosecond temporal resolutions have been recorded. The thunderstorms that generated the lightning flashes recorded in this study occurred approxi-mately at distances of 10–100 km from the measuring station.
2. Data
In Malaysia, the measurements were recorded from April to June 2009 during the southwest monsoon period in the Johor state. Johor is located at the southern part of Peninsular Malaysia, in close proximity to the equator (1°N, 103°E). The measuring station was located on land at a location which is 132 m above sea level and approximately 30 km away from
the Tebrau Straits. Measurements were also recorded during the summer of 2009, i.e. July and August, in Florida. The mea-suring station was located at Florida Institute of Technology, in the vicinity of the eastern coast of Florida (27°N, 80°W). The measurement set up in Florida was identical to that used in Malaysia.
We used fast electric field measuring antenna system which is identical to the one described by Cooray and Lundquist (1982). The vertical electrical field was sensed by a flat plate antenna. The plane of the antenna is oriented per-pendicular to the electric field vector or parallel to the ground in order to avoid the horizontal component of electric field. The effective height of the antenna is 0.25 m and the physical height is 1.5 m. A 60 cm long coaxial cable (RG58) was used
to connect the antenna to the electronic buffer circuit. After passing through the electronic buffer circuit, the signal from the antenna is fed by 10 m long coaxial cables (RG-58) into 12-bit digital transient recorder (Yokogawa SL1000 equipped with DAQ modules 720210) with 50 ns resolution. The sam-pling rate was set to 20 MS/s with the total length of recorded waveforms being 1 s. The trigger setting of the oscilloscope was such that signals of both polarities could be captured. The trigger level is set either 50 mV to 500 mV for the far flashes or 500 mV to 2 V for the close flashes. The transient recorder was operated at a 300 ms pre-trigger mode. The rise time of the broadband antenna system (fast field) for step input pulses was less than 30 ns, while the decaying time constant was set to approximately 15 ms.
3. Result and discussion
3.1. Characteristics of the PB pulse train
The PB pulse trains preceding negative first return strokes were recorded from five convective thunderstorms in Johor, Malaysia in 2009 (on 21, 23, 26, 29, and 30 May). In the data set obtained in Malaysia, PB pulse trains preceding first return strokes were detectable in 97 out of 100 recorded flashes. Out of these 97 flashes, 88 flashes (91%) were charac-terized as typical PB pulse trains, with the initial polarity of bipolar pulses being the same as that of return stroke pulses. However in 9 flashes (9%) the initial polarity of bipolar pulses in the train was opposite to that of the succeeding return strokes. Even though the same instrumentation was used, it appeared that the number of detectable PB pulse trains in our study is inconsistent withGomes et al. (1998). This may due to the different geographical location specifically by oce-anic location. The PB pulse trains preceding the negative first return stroke in Florida were obtained from four thunder-storms in 2009 (on 22, 24, 25, and 29 August). In the Florida data set, all 100 flashes had detectable PB pulse trains and were identified as typical PB pulse trains preceding the nega-tive first return stroke.
We present an analysis of the PB pulse train with the ob-jective of providing a detailed description of the criteria for the identification and selection of the PB pulse train in our data set as mentioned above. The analysis include pulse shape, pulse train duration, individual pulse duration, inter-pulse duration and‘B, I, L’description (defined byClarence and Malan, 1957). We performed this analysis specifically for the data set in Malaysia, considering that to date there is no available literature concerning locations in proximity to the equator. Our Florida data set, however, is found to be sim-ilar to other findings and available literature as reported by Beasley et al. (1982)),Rakov et. al. (1996), Nag and Rakov (2008)andNag and Rakov (2009). The criteria used for the identification of the PB pulse train in the negative cloud-to-ground flash are based on the features described in the intro-duction byNag and Rakov (2008). To satisfy the selection set for the PB pulse train in the negative cloud-to-ground light-ning flash in our data set, we used the same methodology as reported byNag and Rakov (2008), andNag and Rakov (2009). We assumed that any other lightning events, such as hybrid flashes with regular intracloud (IC) discharges oc-curring prior to the negative cloud-to-ground flash, as
anomalous cases, which are not used in our study. In addi-tion, we also assumed that the pulses in the train are bipolar as reported by many investigators (as described in Introduc-tion). Furthermore, the pulses with peak-to-peak amplitudes should exceed twice that of the average noise level. We con-sidered the pulse as belonging to the pulse train if the separa-tion from the last pulse is less than 2 ms.
The definition of pulse train duration, individual pulse du-ration, and interpulse duration as described by Nag and Rakov (2008)andNag and Rakov (2009)are as follows:
i. Pulse train duration: the time interval between the peaks of the first and last pulses in the train.
ii. Individual pulse duration: the full width of the pulse. iii. Interpulse duration: the time interval between the
peaks of two consecutive pulses.
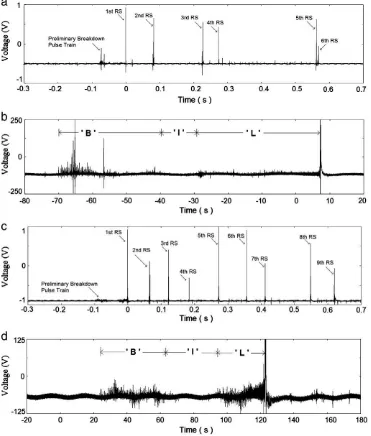
The‘B, I, L’(B: breakdown, I: intermediate and L: leader) description, which is also known as the BIL model as defined byClarence and Malan (1957)is used to identify the pattern of electric field changes preceding the first negative cloud-to-ground flashes. The BIL model is an important tool for our analysis as it reflects the determination of the pulse train and the interpulse durations. From a total of 97 flashes with detectable PB pulse trains in the data set obtained in Malay-sia, 45 flashes (47%) were found to be consistent with the ‘B, I, L’form.Fig. 1shows two examples of typical patterns of electric field changes preceding the first negative cloud-to-ground flashes. In the‘B, I, L’form, 24 (24%) out of 97
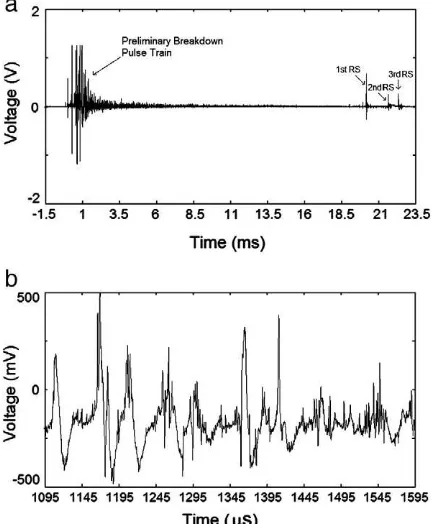
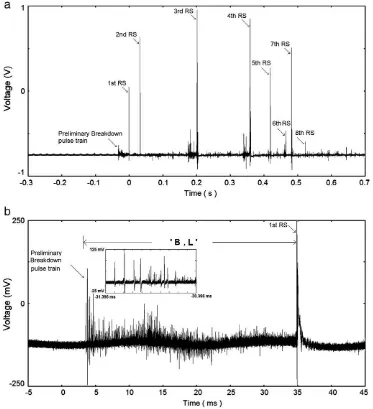
flashes are characterized as regular pulses in the PB pulse train, inside the B section. Another 21 (22%) cases of the‘B, I, L’form were characterized as having irregular pulses with complicated shapes in the PB pulse train inside the B section. The irregularity features of the pulses in the PB pulse train (seeFig. 2b) are found to display small pulses, either unipolar or bipolar, that were superimposed on other distinct bipolar pulses in the train. These features portrayed some confusion in our attempt to recognize the correct type of pulses, as well as the polarity. We also identified 52 flashes (54%) as having the‘B, L’form, suggesting the possibility that the‘I’ section might have a duration of zero. The‘B, L’form features are depicted inFig. 3. The flashes which are profiled inFigs. 2 and 3were considered as complicated cases, which require complex methods of analysis, especially for parameters such as the pulse train duration, individual pulse duration and interpulse duration. It is for this very reason that we decided to focus our analysis on 24 of the most-known typical flashes
(i.e., consistent with the‘B, I, L’description) which are char-acterized as regular pulses in the PB pulse trains.
Figs. 4 and 5show ranges of variations and (vertical bars) of pulse duration and interpulse intervals in individual pulse trains, respectively.Fig. 4notes that the range of variations and the weighted (by number of pulses in the train) arithmet-ic mean of pulse durations for all 24 flashes were 1–92μs and
11μs. All the pulse trains were found to have minimum pulse
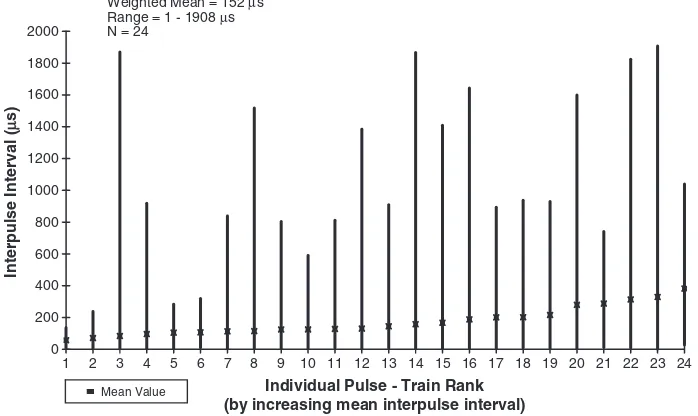
durations in the range of 1–2μs (seeFig. 4). For interpulse in-tervals,Fig. 5indicates that the parameter varies from 1 to
1908μs with the weighted (by number of interpulse intervals
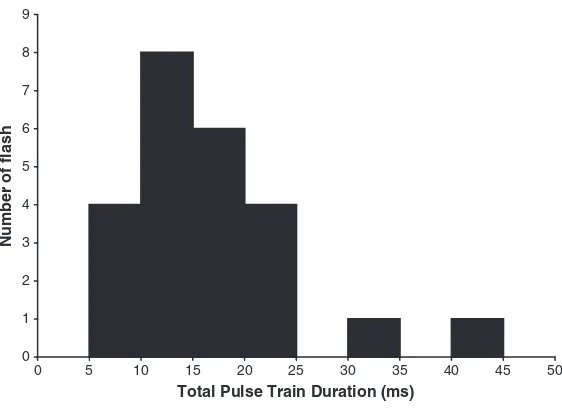
in the train) arithmetic mean of 152μs. A histogram of the total pulse train duration is shown inFig. 6. Note that the total of pulse train duration varies from 2 to 37 ms. The arith-metic mean and geometric mean of the total duration of pulse trains were 12.3 and 10.1 ms, respectively.
For the comparative study, the available results obtained byNag and Rakov (2008)andNag and Rakov (2009)whose
data set were recorded in Gainesville, Florida are summa-rized inTable 1. The work ofNag and Rakov (2009) com-pared the PB pulses in attempted cloud-to-ground leaders noted that the initial polarity of pulses was positive (atmo-spheric electricity sign convention), which is the same as that of the PB pulses in the negative cloud-to-ground flashes. The weighted arithmetic mean of the interpulse interval obtained by Nag and Rakov (2008) and Nag and Rakov (2009) were 73μs and 65μs, respectively. The arithmetic and geometric means of the total duration of the pulse train obtained byNag and Rakov (2008)were 2.7 ms and 2.3 ms, respectively. Nag and Rakov (2009) found the arithmetic and geometric means of the total duration of the pulse train to be 3.4 ms and 3.2 ms. It is noted that the weighted arith-metic mean of the interpulse interval and the means
(arithmetic and geometric) of the total durations of the pulse trains obtained by Nag and Rakov (2008) and Nag and Rakov (2009)are similar to each other. However, the weighted arithmetic mean of the interpulse interval and the means (arithmetic and geometric) of the total durations of pulse trains from our study were greater than that of the two studies mentioned above by more than a factor of 2 and 3, respectively.
Besides this,Nag and Rakov (2008)on one hand found the weighted arithmetic mean of the pulse duration to be 17μs which is comparable with our result (seeTable 1). On the other hand our result is different from the work ofNag and Rakov (2009). The result ofNag and Rakov (2008)showed the weighted arithmetic mean of the pulse duration associat-ed with the attemptassociat-ed leaders to be greater than the PB 0
Individual Pulse Train Rank (by increasing mean pulse duration)
Pulse Duration (
Fig. 4.Ranges of variation (vertical bars) and mean values (square) of pulse duration in individual PB pulse trains.
0
Individual Pulse - Train Rank (by increasing mean interpulse interval)
Interpulse Interval (
pulses in the negative cloud-to-ground flashes (4.8μs) inNag and Rakov (2009)by a factor of 3. FromTable 1the data sets were measured and analyzed using the same methodology. However the different locations played a significant role, in-dicating differences in characteristics of PB processes. One possible explanation for the differences in the characteristics of PB pulse trains in our study may be due to the differing meteorological conditions, region, and latitude effect. The mean duration of individual pulse still remains less than the lower bound of the 20–40μs range of typical durations previ-ously reported byRakov and Uman (2003)for“classical”PB pulses.
3.2. Relationships between the PB pulse and thefirst RS
The methodology in this analysis refers to the work of Gomes et al. (1998), Cooray and Jayaratne (2000),Gomes and Cooray (2004), Mäkelä et al. (2008), and Nag and
Rakov (2009). The PB/RS is the amplitude ratio between the maximum peak of the electric field in the PB pulse train and the peak of the RS. The PB–RS separation is defined as the time interval between the maximum peak of electric field in the PB pulse and the peak of the RS. Figs. 7 and 8depict two PB pulse trains with pulse polarities identical to that of 0
1 2 3 4 5 6 7 8 9
0 5 10 15 20 25 30 35 40 45 50
Total Pulse Train Duration (ms)
Number of flash
Fig. 6.Histogram of the total duration of PB pulse trains for 24 cloud-to-ground flashes.
Table 1
Comparison of PB pulse trains characteristics in Florida and Malaysia.
Parameter Nag and
Rakov (2008),
Florida
Nag and
Rakov (2009),
Florida
This study (2010), Malaysia
Pulse duration
1. Weighted arithmetic mean (μs)
17 4.8 11
2. Range (μs) 1–91 0.5–49 1–92
3. Sample 35 12 24
Interpulse intervals
1. Weighted arithmetic mean (μs)
73 65 152
2. Range (μs) 1–530 0.6–1585 1–1908
3. Sample 35 12 24
Total of pulse train duration
1. Arithmetic mean (ms) 2.7 3.4 12.3
2. Geometric mean (ms) 2.3 3.2 10.1
3. Range (ms) 0.8–7.9 1.1–5 2–37
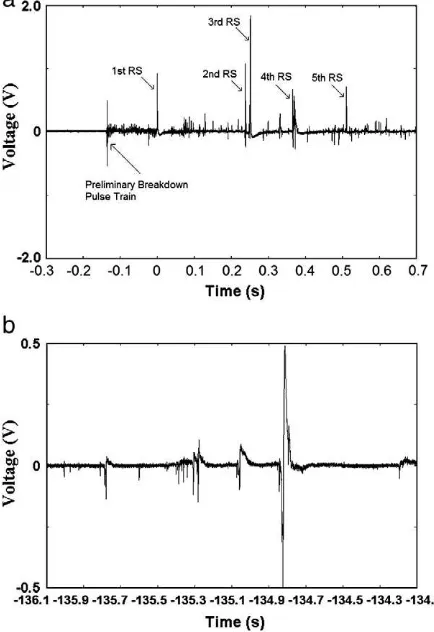
4. sample 35 12 24 Fig. 7.Highest PB/RS in Malaysia (a) Time frame: 100 ms, (b) time frame:
the return strokes recorded in Malaysia.Fig. 7shows an event where the amplitude of the largest preliminary breakdown pulse exceeds that of the return stroke.Fig. 8shows an exam-ple where the amplitude of the preliminary breakdown pulses is much smaller than that of the return strokes. In fact, this is the only event that produced the smallest prelim-inary breakdown pulse train observed in this study. However, the preliminary breakdown pulse activity above the noise level can be clearly observed.
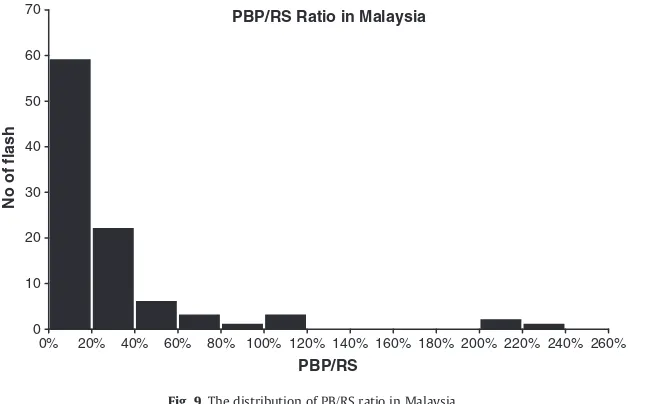
The distribution of PB/RS ratio of flashes observed in Ma-laysia is given inFig. 9. The arithmetic mean, the geometric mean, and the standard deviation of the PB/RS ratio obtained in Malaysia are 27.8%, 14.6%, and 42.2%, respectively. The minimum and maximum values of the ratios observed are 2.6 to 228%, respectively.Fig. 9shows that there were six Fig. 8.Lowest PB/RS in Malaysia (a) Time frame: 0.5 s, (b) Time frame:
100 ms.
PBP/RS Ratio in Malaysia
0 10 20 30 40 50 60 70
0% 20% 40% 60% 80% 100% 120% 140% 160% 180% 200% 220% 240% 260% PBP/RS
No of flash
Fig. 9.The distribution of PB/RS ratio in Malaysia.
0 5 10 15 20 25 30 35
0% 10% 20% 30% 40% 50% 60% 70% 80% 90% 100%110%120%130%140%150%160%
PBP/RS
No of flash
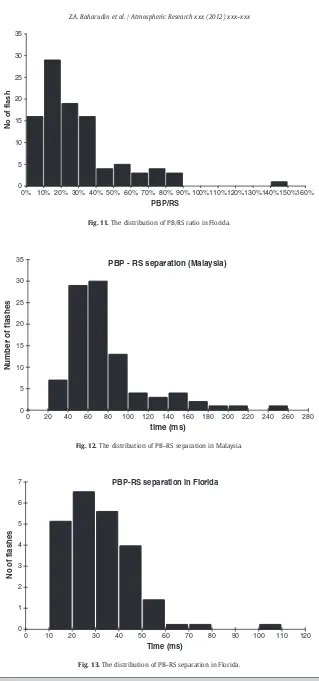
Fig. 11.The distribution of PB/RS ratio in Florida.
PBP - RS separation (Malaysia)
0 5 10 15 20 25 30 35
0 20 40 60 80 100 120 140 160 180 200 220 240 260 280
time (ms)
Number of flashes
Fig. 12.The distribution of PB–RS separation in Malaysia.
PBP-RS separation in Florida
0 1 2 3 4 5 6 7
0 10 20 30 40 50 60 70 80 90 100 110 120
Time (ms)
No of flashes
PB pulse trains, where the amplitude of the largest bipolar pulse exceeded that of the first return. The arithmetic mean and geometric mean of the noise amplitude to the return stroke ratio (N/RS ratio) at our measuring site are 0.7% and 0.6%, respectively. Observe that the minimum PB/RS ratio measured in the study is greater than the mean of N/RS by an approximate factor of 3.7. This indicates that the ambient noise has not affected the results significantly. Two PB pulse trains observed in Florida are depicted in Fig. 10. These pulse trains have the same general features as those observed in Malaysia (Figs. 7 and 8).
The histogram inFig. 11provides the distribution of the PB/RS ratio observed in Florida. It was found that the PB/RS ratio in Florida varies from 2.9 to 149%. The arithmetic mean, geometric mean, and standard deviation of the PB/RS ratio are 29.4%, 22.3%, and 23.6%, respectively. The two mean values of the N/RS ratios are 2.3% and 2%. These values are not much higher than the minimum PB/RS ratio, but still lower than the lowest value. We have also evaluated the time
interval between the initiation of the PB pulse trains and the initiation of the return stroke in both regions. The results are shown inFigs. 12 and 13. In Malaysia, the arithmetic mean, geometric mean and standard deviation of this time interval was 57.6, 47.2, and 40 ms, respectively. The minimum and maximum values observed were 8.3 and 227.3 ms, respec-tively. The corresponding values in Florida were, 22, 17.7, and 14.5 ms, respectively. The maximum value observed was 92.5 ms and the minimum, 3.3 ms. The results from both countries are summarized inTable 2.
The histograms of the PB/RS ratio from both locations (Figs. 9 and 11) indicate that in both locations the RS ampli-tude exceeds the PB pulses in more than 90% of the cases. However, there are slight differences in the geometric mean as indicated inTable 2. The geometric mean of the PB/RS ratio in Florida is higher than the Malaysian ratio by a factor of 1.5. Moreover, as tabulated inTable 2, the PB–RS separation in Malaysia is greater than the value obtained in Florida.
Table 2
Statistical results for observations made in Malaysia and Florida.
Location Total
PB/RS ratio (%) N/RS ratio (%) PB-RS separation (ms)
Arith.
Malaysia 100 97 27.8 14.6 2.6–228.1 12.2 42.2 0.7 0.6 57.6 47.2 8.3–227.3 47.4 40
Florida 100 100 29.4 22.3 2.9–149 21.5 23.6 2.3 2 22 17.7 3.3–92.5 22 14.5
Table 3
Comparison with earlier studies.
Location No. of detectable
PB pulse train
PB/RS ratio (%) PB-RS separation (ms) Pre-return stroke duration
Arith. mean Geo. mean Range Arith. mean Geo. mean Range Arith. mean Geo. mean
This study (Malaysia) 1° North 97 27.8 14.6 2.6–228.1 57.6 47.2 8.3–227.3 62 51
This study (Florida) 27° North 100 29.4 22.3 2.9–149 22 17.7 3.3–92.5 23 19
Florida (2009) 30° North 59 62 45 16–510 – – – – –
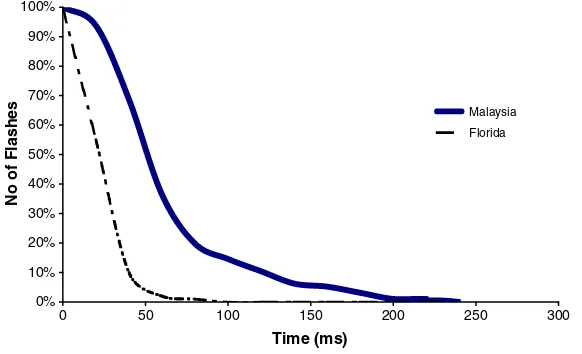
In this analysis, we have defined the pre-return stroke du-ration as the time interval between the first detectable pulse in the PB pulse train and the peak of the return stroke pulse. InTable 3, note that the arithmetic mean, geometric mean of the pre-return stroke durations obtained in Malaysia are 62 ms and 51 ms, respectively, with individual values lying in the range of 9 to 230 ms. The arithmetic mean and geo-metric mean of pre-return stroke obtained in Florida are 23 ms and 19 ms, while the minimum is 4 ms and the maxi-mum is 93 ms.
Observe that the average value measured in Malaysia is twice the value observed in Florida. The cumulative distribu-tions of the pre-return stroke duration from Malaysia and Florida data are given inFig. 14. The application of a Stu-dent'st-test to the two distributions inFig. 14indicates that there is less than a 0.1% (0.013%) probability that these two distributions had a common parent distribution. Furthermore the Student'st-test is significantly supported our results in Section 3.1, concluded that the characteristics of PB pulses trains in Malaysia and Florida are not similar to each other (seeTable 1).
We summarized and compared the results obtained earli-er byGomes et al. (1998)andMäkelä et al. (2008)andNag and Rakov (2009)inTable 3. Note that the observations in temperate regions such as in Sweden (59.8°N) and Finland (60.4°N) indicate that the means of the PB/RS ratio are rela-tively high in higher latitudes. The results reported byNag and Rakov (2009)in Florida (30°N) also similar to that of two studies. However, as the latitude decreases or as we move closer to equatorial region, the mean of the PB/RS ratio also decreases. It is fair to note that the number of ob-servations that were reported byGomes et al. (1998)is rath-er small (9) and this could affect the statistical data. We also found that the PB–RS separation is short at the high latitude region while having long durations in the tropical region. This could be due to the higher altitude of charge centers in tropical regions.
The information concerning the location of thunder-storms was obtained by radar and satellite data provided by the Malaysian Meteorology Department. The data allowed us to identify the location of the most active thunderstorms to an accuracy of a few kilometers during our measurements. We summarized this information inTable 4. Notice that the thunderstorm event on 26/05/2009 generated the highest PB/RS ratio (average 51.2%) while the lowest (average 16.7%) was generated by the thunderstorm on 29/05/2009. We found that the thunderstorm event on 26/05/2009 took
place in the southwest region (0.74°N, 103°.12 W) over the sea and over some parts of small islands close to Sumatra, In-donesia. The distance to that thunderstorm location was be-tween 30 and 80 km. The thunderstorm on 29/05/2009 took place over land. This thunderstorm was a large isolated one, having a radius of approximately 10–15 km. The distance to the thunderstorm from the measuring station was approxi-mately 5 to 25 km, northwest (1.9°N, 10°W).
Another interesting observation of this study is the light-ning flashes recorded in Malaysia where the polarity of PB trains is opposite to that of the succeeding return stroke. This phenomenon is shown inFig. 15which consists of pulses with positive initial polarity and followed by all negative Table 4
Information from radar and satellite.
Date Data Arithmetic mean
of PBP/RS ratio
Location Condition
21/05/2009 5 54% Not available –
23/05/2009 22 15.8% Not available –
26/05/2009 23 51.2% Overseas, south west (0.74°,103°.12) Surrounding over sea, some parts of small islands close to Sumatra, distance: 30–80 km
29/05/2009 38 16.7% Overland, north west Large isolated thunderstorms approximately
10 km radius, distance: 5–25 km
30/05/2009 11 27.7% (1.9°,10°) Over land and over sea
southwest (1.26°,103°.38) and northeast (1.97°, 104°.14)
Scattered thunderstorms, Location: 20–30 km to the southwest (overseas and overland) and 70–100 km to the northeast (overseas)
bipolar pulses. We noticed that these types of PB trains have the highest pre-return stroke durations and these duration vary (in 9 cases) from 79 to 230 ms. The occurrence of the anomalous polarity PB trains (i.e. negative initial polarity) in the positive lightning flashes have been reported by Gomes and Cooray (2004). We agree with the speculation made byGomes and Cooray (2004)that the PB with the ini-tial polarity being opposite to that of the succeeding return stroke may be caused by a breakdown between the main charge centers and irregularly-located charged regions or screening layers.
4. Conclusions
The relationships between the preliminary breakdown pulse and the first return stroke electric fields have been an-alyzed using high resolution data recorded from Malaysian and Florida thunderstorms. The statistics obtained from our data (Malaysia and Florida) and those obtained earlier in Sri Lanka, Sweden, Finland and Florida, show that the strength of the ground-flash-initiation breakdown process in the cloud, measured with respect to the peak radiation field of the resulting return stroke, is larger at high latitudes com-pared to that of the tropical regions. The characteristics of preliminary breakdown pulse trains in the negative cloud-to-ground flashes observed in Malaysia have been summa-rized inTable 1. We found the duration for the initiation pre-liminary breakdown processes in negative cloud-to-ground flashes in Malaysia is three times greater than in Florida. From our observations in Malaysia, we found that there are differences between flashes that occur over the land and over the sea. However, further investigations addressing the effects of thunderstorms over the land and over the sea is re-quired to speculate regarding the initiation process of cloud to ground flash. The phenomenon of opposite polarity of the PB pulse to that of the succeeding return stroke still re-mains an open question.
Supplementary data
Supplementary data associated with this article can be found in the online version, atdoi:10.1016/j.atmosres.2012. 01.012. These data include Google maps of the most impor-tant areas described in this article.
References
Beasley, W., Uman, M.A., Rustan, P.L., 1982. Electric fields preceding cloud-to-ground lightning flashes. J. Geophys. Res. 87 (C7), 4883–4902. Brook, M., 1992. Breakdown electric fields in winter storms. Res. Lett. Atmos.
Electr. 12, 47–52.
Clarence, N.D., Malan, D.J., 1957. Preliminary discharge processes in light-ning flashes to ground. Q. J. R. Meteorol. Soc. 83, 161–172.
Cooray, V., Jayaratne, R., 2000. What directs a lightning flash towards ground? Sri Lankan J. Phys. 1, 1–10.
Cooray, V., Lundquist, S., 1982. On the characteristics of some radiation fields from lightning and their possible origin in positive ground flashes. J. Geophys. Res. 87 (C13), 11203–11214.
Cooray, V., Scuka, V., 1996. What attracts a lightning to ground? Proceedings of the 10th International Conference on Atmospheric Electricity, Osaka, Japan.
Gomes, C., Cooray, V., 2004. Radiation field pulses associated with the initia-tion of positive cloud to ground lightning flashes. J. Atmos. Sol. Terr. Phys. 66, 1047–1055.
Gomes, C., Cooray, V., Jayaratne, C., 1998. Comparison of preliminary break-down pulses observed in Sweden and Sri Lanka. J. Atmos. Sol. Terr. Phys. 60, 975–979.
Kitagawa, N., Brook, M., 1960. A comparison of intracloud and cloud-to-ground lightning discharges. J. Geophys. Res. 65, 1189–1201. Mäkelä, J.S., Porjo, N., Mäkelä, A., Tuomi, T., Cooray, V., 2008. Properties of
preliminary breakdown process in Scandinavian lightning. J. Atmos. Sol. Terr. Phys. 70, 2041–2052.
Nag, A., Rakov, V.A., 2008. Pulse trains that are characteristic of preliminary breakdown in cloud-to-ground lightning but not followed by are not fol-lowed by return stroke pulses. J. Geophys. Res. 113, D01102. Nag, A., Rakov, V.A., 2009. Electric field pulse trains occurring prior to the
first stroke in negative cloud-to-ground lightning. IEEE Trans. Electro-magn. Compat. 51 (1), 147–150.
Rakov, V.A., Uman, M.A., 2003. Lightning–Physics and Effects. Cambridge University Press, Cambridge.