PERFORMANCE OF INFORMATION AND COMMUNICATION
TECHNOLOGY (ICT) COMPANIES IN ASEAN AND EAST ASIA
MOHD FAZLI MOHD SAM
A Dissertation Submitted to the
Graduate School of Business Administration
Aichi University
Nagoya, Japan
in Partial Fulfillment of the Requirements for
the degree of
Doctor of Philosophy in
Business Administration
Supervisor
PROF. DR. YASUO HOSHINO
i
ACKNOWLEDGEMENT
In the name of Allah, the most gracious and the most merciful. My gratitude and gratefulness go to the only God, who gave me courage, strength and a piece of mind to make this piece of work possible.
This dissertation is a tribute to all the people who supported me throughout the entire course of my Ph.D. experience. First and foremost, I would like to express my deep appreciation to my mentor, Professor Dr. Yasuo Hoshino, for his patience, support, guidance, and encouragement mentally and morally. He has constantly encouraged me to improve and his uncountable support and delicate consideration inspired me to complete this dissertation.
I also would like to express my heart-felt thanks to the Graduate School of Business Administration staff for their assistance during my years in the University. To all friends and colleagues, Md Nor Hayati, Ariffudin, Fajar, Hana, Kamaruddin, and many others who have given me support and friendship.
I also wish to thank to the Malaysia Ministry of Education (MOE) and Universiti Teknikal Malaysia Melaka (UTeM) which provide me the financial scholarship to pursue this Ph.D program in Aichi University, Japan.
ii
TABLE OF CONTENTS
ACKNOWLEDGEMENT……….……….i
TABLE OF CONTENTS………...ii
LIST OF FIGURES………v
LIST OF TABLES……….…vi
LIST OF ACRONYMS AND ABBREVIATIONS………..vii
ABSTRACT………...…ix
CHAPTER: 1 INTRODUCTION………...………1
1.1 Background………..……1
1.2 Research Objective………...………...……2
1.3 Research Contribution………...………..3
1.4 Dissertation Structure………..4
1.5 Theoretical Background………..5
1.5.1 Information and Communication Technology (ICT)……….…….5
1.5.2 Technology Adoption……….6
1.5.2.1 Technology Adoption in ICT/IT……….7
1.5.3 SME in Malaysia……….8
1.5.4 Sales and Profit Maximization ...………..……10
1.5.5 Financial Ratio………...11
1.5.6 ORBIS Database………12
2 THE ADOPTION OF COMPUTERIZED ACCOUNTING SYSTEM……...….15
IN SMALL MEDIUM ENTERPRISES IN MELAKA, MALAYSI 2.1 Introduction………...15
2.2 CAS Adoption Factors………...17
2.2.1 Relationship between Adoption of CAS and ………20
CEOs Characteristic 2.3 Methodology………..21
2.4 Findings……….22
2.4.1 Respondent Profile………...…….…22
2.4.2 Preparation of Company Account……….22
2.4.3 Characteristic of CEO………...23
iii
2.5 Conclusions………...26
2.6 Recommendations……….30
3 SALES GROWTH, PROFITABILITY AND PERFORMANCE: ………….….32
EMPIRICAL STUDY ON JAPANESE ICT INDUSTRIES WITH THREE ASEAN COUNTRIES 3.1 Introduction………...32
3.2 Theoretical Background and Hypotheses………..33
3.2.1 Information and Communication Technology Performance…….33
3.2.2 Sales & Profit Maximization……….35
3.3 Financial Performance………...37
3.5 Discussion and Empirical Results……….41
3.6 Conclusion……….45
4 PERFORMANCE OF ICT INDUSTRY IN SIX ASIAN COUNTRIES……….47
4.1 Introduction………...…47
4.2 Theoretical Background and Hypotheses………..48
4.2.1 Information and Communication Technology Performance…….48
4.2.1.1 Malaysia……….49
4.2.2. The Networked Readiness Index………...……51
iv
4.3 Discussion and Empirical Results………...56
4.4 Conclusion……….67
5 CONCLUSIONS AND IMPLICATION………..70
5.1 Conclusions………..…….70
5.2 Implications………...……76
5.3 Limitations of Study and Future Research………77
References……….……79
Appendix A………..…….97
Appendix B………..103
Appendix C………..…107
Appendix D………..110
v
LIST OF FIGURES
Figure 1.1: A Model of Five Stages in the Innovation-Decision Process………...7
Figure 1.2: Data collection process by BvDEP……….13
Figure 3.1: The Networked Readiness Index: The framework………..34
Figure 3.2: Baumol’s Sales-Maximization Model………....36
Figure 3.3: Conceptual Framework………...…39
Figure 3.4: Utilization Rate of Semiconductor Manufacturing Facilities……….44
Figure 4.1: Conceptual Framework………...54
Figure 4.2: Number of internet users in China………..60
Figure 4.3: Company Experience for Six Countries……….67
vi
LIST OF TABLES
Table 1.1: Definition by Size of Operation……….9
Table 2.1: Relationship between CEO innovativeness and usage of CAS………24
Table 2.2: Relationship between Perceive of use and usage of CAS……….…………...25
Table 2.3: Relationship between Perceive of usefulness and usage of CAS……….25
Table 2.4: Business competitions influence the adoption of CAS in SMEs.………26
in Melaka Table 3.1: The Networked Readiness Index rankings………..…….35
Table 3.2: Definitions of Financial Statement Ratios ………...…41
Table 3.3: Mean Output for Sales Growth Ratio………...…42
Table 3.4: Output for Profitability Ratio 2006-2010……….42
Table 3.5: Buyer sophistication rankings………..…44
Table 4.1: The Networked Readiness Index rankings………..51
Table 4.2: Number of listed and non-listed ICT companies……….55
Table 4.3: Definitions of Financial Statement Ratios ……….…………55
Table 4.4: Correlations among all the variables ASEAN and East Asia group…………57
Table 4.5: Correlations among all the variables for each country………..57-58 Table 4.6: Mean output for sales growth ratio by using t-test……….59
Table 4.7: Mean output for sales growth ratio by using ANOVA………..59
Table 4.8: Mean Comparisons for sales growth ratio by using ANOVA………..…….60
Table 4.9: Output for financial statement ratio 2006-2010 by using t-test………...61
vii
LIST OF ACRONYMS AND ABBREVIATIONS
ASEAN Association of Southeast Asian Nations
BvDEP Bureau van Dijk Electronic Publishing
CAGR Compounded Annual Growth Rate
CAS Computerized Accounting System
CEO Chief Executive Officer
CMBP Composite Measure of Business Performance
DCs Developed Countries
EBITDA Earnings before interest, taxes, depreciation and amortization
EIU Economist Intelligence Unit
GAAP Generally Accepted Accounting Principles
GDP Gross domestic product
GRS Growth Rate of Sales
ICT Information and Communication Technology
IDC International Data Corporation’s (IDC)
INSEAD Institut Européen d'Administration des Affaires
IT Information Technology
ITU International Telecommunication Union
IFRS International Financial Reporting Standards
MFP Multi-factor productivity
MYOB Mind Your Own Busines
NICs Newly Industrializing Countries
NRI Networked Readiness Index
OECD Organization for Economic Co-operation and Development
PC Personal Computer
R&D Research and development
ROA Return on total assets
ROI Return on Investment
ROCE Return on capital employed
ROS Return on Sales
ROSF Return on shareholder funds
SME Small Medium Enterprise
viii
UBS Union Bank of Switzerland
UN United Nations
ix
ABSTRACT
Development of the ICT industry has become a major factor of economic growth. Previous ICT researchers have examined the importance of growth and performance in ICT development, ICT diffusion, ICT investment and ICT production. However, very few studies has been conducted to measure the performance of ICT industry using both questionnaires and financial ratios.
1
CHAPTER 1
INTRODUCTION
1.1 Background
Information and communications technology (ICT) refers to all the technology used to handle telecommunications, broadcast media, intelligent building management systems, audiovisual processing and transmission systems, and network-based control and monitoring functions. Since 20 years ago, ICT technological innovation which has changed extremely and comprised of several players in this industry. The rapid growth of the world’s economy is driven by the advancement in ICT technology, which is widely recognized around the globe.
ICT is pervading all parts of business and society revolution with faster economic growth (Oliner and Sichel, 2000; Timmer and Ark, 2005). According to Khalil and Kenny (2008), the World Bank surveys on approximately 50 developing countries suggest that firms had faster sales growth, higher productivity and faster employment growth by using ICT.
Porter and Millar (1985) mentioned that due to ICT competitive advantage, over the years, information technology plays a major role in changing the nature of business. With the introduction of new technologies and more user friendly software, the computerized accounting system (CAS) appears to reduce the problems in book record-keeping practice. The first study investigates the Small Medium Enterprise (SME) practice of computerized accounting system (CAS) and identifies the factors affecting the adoption of CAS among SMEs in Melaka, Malaysia. Small business owners who have the ability and competency in ICT will implement its training by themselves (Delone, 1988; Raymond, 1988).
2
Previous ICT researchers have examined the importance of measuring ICT developments (Hilbert and Vásquez, 2010), ICT diffusion (Wu and Chu, 2010; Vicente and López, 2006), ICT investment in growth performance (Colecchia and Schreyer, 2002; Jorgenson, 2001;), ICT production and productivity (Sam, et.al, 2012; Jorgenson, 2003; Oliner and Sichel, 2002; Bharadwaj, 2000; Powell and Dent-Micallef, 1997; Mata, et.al, 1995; Nault and Dexter, 1995;), ICT business owners and their characteristics (Thatcher and Perrewe, 2002; Attewell, 1992; Delone, 1988). Lee and Blevins (1990) compared 400 companies in manufacturing and non-manufacturing industries between two developed countries (DCs) and two newly industrializing countries (NIC's) using financial data, but none measured the performance of ICT industry by using profitability ratio and sales growth rate. The present study is the first of its kind.
1.2 Research Objective
This study attempted to examine the importance of ICT, which is not limited to the technology itself but also to enhance information and communication for further usage and application. Organizations which are look into engaging in the digital economy are adopting ICT as part of the strategic planning. Determining the performance of ICT companies can also be done by analyzing the financial data from the company’s financial statement. More specifically, the objectives of this study were:
i. To observe related issues on the application of CAS with the CEOs of SME in Melaka. The objectives are to determine whether CEO’s innovativeness influences the adoption of CAS, to determine the perceived ease of use and perceived usefulness in the adoption of CAS and to determine whether business competition influenced the adoption of CAS in SMEs in Melaka.
ii. To investigate the performance of ICT companies by analyzing the sales growth ratio and profitability ratio in the ICT industry between Japan and three ASEAN countries.
3
iv. To investigate the performance of ICT companies by analyzing the sales growth ratio and profitability ratio in the ICT industry among six Asian countries and between two major groups, namely ASEAN and East Asia regions.
1.3 Research Contribution
This dissertation is divided into two parts. The first study was conducted using interview and questionnaire research method, whereby this research project aimed to investigate SME practice of CAS and to identify the factor affecting the adoption of CAS among SMEs in Melaka, Malaysia. The findings indicate that CEO innovativeness, perceived usefulness and business competitiveness are negatively correlated but only perceived ease of use significantly and positively correlated to CAS adoption. Therefore, it can be deduced that CAS adoption among SMEs in Melaka is caused by its ease of use. Research results do show that the performance of the companies depends on the usage of ICT tools such as CAS in their firms operation.
The second study was done using quantitative research method and using a financial database to determine the performance of ICT companies by analyzing sales growth ratio and profitability ratio in ICT industry between Japan and three ASEAN countries. This study also looked into the sales and profit maximization model, which support the findings of this study. The results of this study reveal that Japan had better performance in sales growth rate compared to ASEAN countries, but low profitability. Japanese consumers see the total product as consisting of tangible and intangible components. The tangible value is placed on the product by the purchaser and it is considered as an image associated with the use of the product. The determination includes the relationship between cost and quality. International ICT companies can be expected to first broaden the total number of their products as they penetrate the markets in the international stage and then focus on selected products as they enter the global alignment stage (Douglas and Craig, 1989).
4
Growth rate compared to other countries because of the rapid development in their ICT sector. Meanwhile, Malaysia has a low performance in profitability ratio, return on shareholder funds (ROSF), return on capital employed (ROCE) and Korea with its return on total assets (ROA), profit margin and earnings before interest, taxes, depreciation and amortization (EBITDA) margin mean values.
1.4 Dissertation Structure
This dissertation is divided into five parts and begins with the introduction in Chapter 1 and is distributed into the following subsections: background, research objective and research contribution for all three studies. The next part, Chapter 2 consists of the qualitative research, which investigated SME practice of CAS and the factor affecting the adoption of CAS among SMEs in Melaka., Malaysia. We analyzed whether CEO innovativeness influences the adoption of CAS, determined the perceived ease of use and its influence on the adoption of CAS, determined the perceived usefulness in the adoption of CAS and determined whether business competition influences the adoption of CAS in SMEs in Melaka, Malaysia.
In Chapter 3, through a quantitative study method, we made a comparative study between Japan and three ASEAN countries involving Malaysia, Thailand and the Philippines in the ICT industry using a financial database from ORBIS. We evaluated financial data for the ICT industry from Japan and three countries from the ASEAN region to investigate the performance by analyzing the sales growth ratio and the profitability ratio. In addition, from the findings, we examine whether the result from analyzing sales growth ratio and profitability ratios support the Sales Maximization or Profit Maximization model.
5
In the last part, Chapter 5, we conclude all the studies that had been conducted and present the implications, limitations and directions for future research associated with the research findings.
1.5 Theoretical Background
1.5.1 Information and Communication Technology (ICT)
Information and Communication Technology (ICT) is a term used to describe technologies in operating and interactive information. Internet was born in the late 1960s, beginning with e-mail in the late 1970s, followed by the domain name system in the 1980s, the World Wide Web in the 1990s, and portal/repository concepts in the 2000s, which are popular applications of ICT that have been powerful tools for business and development. The comparable development in computer communications in business and science has driven the merging of computing technology and telecommunications, and has become the leading data communications system in use today. Takaya (2008) mentioned in his study that the increase in the digital divide reduces ICT investments and interrupts the innovation of ICT from a macroeconomic point of view.
After the Second World War era, ICT became the most prevalent technical innovation which gives rise to a wide range of new products and services, and generates strong industrial attention as a means for competitive advantage and profitability (Avgerou, 1998). By providing sufficient information at a minimum cost and time, ICT can give significantly through the economic development of a region, whereby it can enhance the productivity of different sectors in an economy (Kraemer and Dedrick, 1999; Pohjola, 2000).
6
ICTs represent a wide range of technologies, services and applications using several types of hardware and software, often running over telecom networks. ICT does not include only the internet, but it includes various sets of technological tools and resources to store, distribute, create, bring value-added and manage information. The significance of ICTs is not just on the technology itself, but also on the permitting role to
enrich information and communication to further distances. ICT is believed to be a key
driver which encourages faster growth in productivity by increasing investment if reducing barriers to access the information (Levine, 1997).
The importance of ICT in social transformation and a country’s economic growth show the strength of country participation into the global economy. Lam and Shiu (2008) proved that the efficiency and the productivity of the ICT sector were enriched by privatization and liberalization. The quick and effective way for policy makers to compare their countries’ ICT performance by benchmarking the financial performance progress over time. As a result, firms are under increasing pressure to accomplish above-average performance using ICT technologies.
1.5.2 Technology Adoption
Innovation refers to the degree of a new advanced technology being adopted and adoption refers to an individual or business to acquire and use a new technology. When the new technology is broadly diffused and used, its contribution to economic growth can be recognized. An important factor for technology adoption in some business firms is a secure and constant consumer base. As for high investments in new production technologies, a company needs to be productive that there will be profitable in the future to pay back the investment.
7
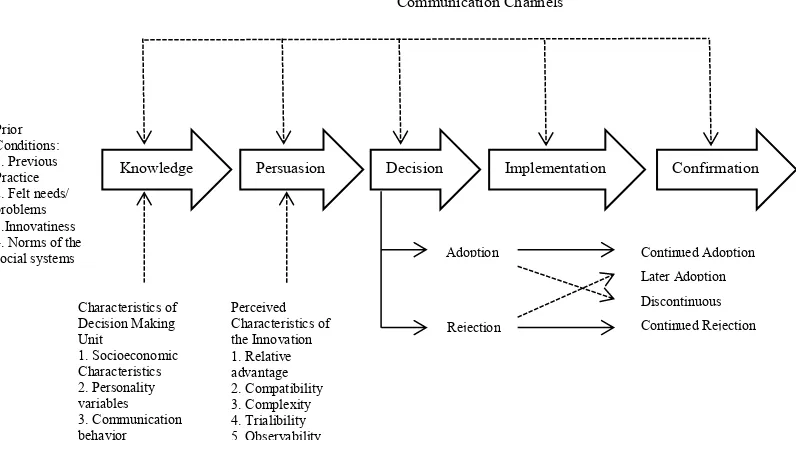
Rogers (2003) stated that the innovation-decision process involves five steps: knowledge, persuasion, decision, implementation, and confirmation. These stages typically follow each other in a time-ordered manner (refer to Figure 1.1).
Figure 1.1: A Model of Five Stages in the Innovation-Decision Process Source: Rogers (2003)
During the knowledge stage phase, the individual tries to determine what the innovation is, and how and why it works. Seemann (2003) in his study mentioned that to create new knowledge, technology and practice should provide not only a how-to experience, but also a know-why experience. The next step is persuasion where someone has a positive or negative approach toward the innovation and does not always lead directly or indirectly to an adoption or rejection of the new technology. At the decision stage in the innovation decision process, the individual chooses to reject or adopt the innovation and at the implementation step, an innovation is put into practice. The final step is the confirmation stage whereby the individual looks for support for his or her decision.
1.5.2.1Technology Adoption in ICT/IT
ICT adoption occurs in a country when organizations invest in technology to support their business activities, and when people begin to use the technology. ICT adoption and the capacity of a geographical region to produce technological innovations
8
are of the top importance when comparing social welfare and economic growth potential between different countries (Sachs, 2008). The main common reasons for most companies to adopt ICT in their firms are to improve survival growth, enhance innovation abilities and stay competitive (Bu´rca et al. 2005; Bruque and Moyano, 2007).
Andries and Debackere (2006) confirmed that companies look into ICT adoption due to internal and external changes. Internal changes include the maturity or the life cycle of the company, while, external changes are the stability or the existence in the market. In a similar context, information technology (IT) adoption is also measured through competitiveness and innovativeness. In SMEs, all decisions come from the management team starting from daily operations to future investment, so their roles directly affect the ICT adoption process (Bruque and Moyano, 2007). The management role also applies to the decision to adopt ICT from planning to maintaining and upgrading the system. This is to make sure that the decision meets the necessity of current ICT technology and satisfies the organizational objectives such as maximizing productivity and maintaining the quality of its products and services (Bruque and Moyano, 2007; Riemenschneider and McKinney, 2001).
Thong and Yap (1995) mentioned that successful managers adopting new Information Technology (IT) in their company have competency in IT background and positive attitude towards IT. Greater more positive perception toward IT leads to higher chances of implementing and adopting IT (Harrison et al. 1997). The IT adoption process requires cooperation and acceptance across all functions within a company. It requires the top management support, clear communication with the employees, and employees acceptance of the changes (Anderson and Huang, 2006; Premkumar and Roberts, 1999; Sarasvathy, 2003; Smith, 2002). IT should provide a source of communication among the employees, and must be linked between partners. Otherwise, one of the parties will be inaccessible.
1.5.3 SME in Malaysia
9
development. According to SMIDEC definition, SME is a company in: 1) the manufacturing sector, with a sales turnover not exceeding RM50 million or full-time employees not exceeding 200 workers, or 2) the services and other sectors (including ICT), with a sales turnover not exceeding RM20 million or full-time employees not exceeding 75 workers (SMIDEC, 2013). Malaysian government offered incentives and benefits for SME companies and with that, technology growth improved and developed the work force quality through experience, education and skills development. Table 1.1 below shows the definition by size of operation of SME in Malaysia.
Category Small Medium
Manufacturing Sales turnover from RM300,000 to less than RM15 million OR full-time employees from 5 to less than 75
Sales turnover from RM15 million to not exceeding RM50 million OR full-time employees from 75 to not
Sales turnover from RM3 million to not exceeding RM20 million OR full-time employees from 30 to not exceeding 75
Table 1.1: Definition by Size of Operation Source: SMIDEC (2013)
In preparation for the global market, SMEs in Malaysia employ a comprehensive product design and new technology activities by implementing developments in distribution and marketing. Saleh and Ndubisi (2006) revealed that by 2020, value-added products from SMEs are expected to worth RM 120 billion or 50 per cent of the total production, especially in the manufacturing sector. SMEs in Malaysia contribute to a large share in GDP because of the huge number of businesses in various sectors. As in many other countries, SMEs in Malaysia are involved in a diverse range of industries.
10
cause of low level of IT usage in Malaysia is that most SME owners are anxious in IT and also because of their unfamiliarity of the technology. Moreover, due to the competitive trend, Malaysian government needs to deliver several guidelines to ensure that SMEs become a global business center. To achieve such standard, many Malaysian SMEs begin to adopt ICT in global business strategies.
1.5.4 Sales and Profit Maximization
The main goal of leaders in large companies is to maximize the revenue and to continue increasing the sales, even at the expense of lower profits, in both short- and long-terms (Baumol, 1959). The basic economic theory is that the goal of all firms is profit maximization, which can come in a number of forms, depending on the managerial philosophy. Targeting sales revenue maximization as a goal is actually a form of profit maximization. The general rule is that firm maximizes profit by producing that quantity of output where marginal revenue equals marginal costs. This strategy is used by companies that wish to maximize long term profits by increasing market share. In order to receive a larger share of the market, the company is willing to forgo current profits by lowering prices below the (short-term) profit maximization level to attract customers from competitors.
The objective of profit maximization is stimulated by (1) disappearance of firms that depart too far from the profit maximization objective and survival of those that conform to it knowingly or unknowingly, and (2) adaptation of behavior of surviving firms by other firms. (Scherer, 1970). Profit maximization is interpreted as the desire to maximize the present value of the firm. Since net revenue, total revenue and assets all expand permanently at the same rate, these are all in the context of the permanent growth maximization model interpretation. Meanwhile, based on a study on Japan industry, the inter-firm relationships among Japanese corporate groups (kigyo keiretsu) and collusion are often portrayed as a barrier for entry into the Japanese market and a major reason for high prices in Japan (Fung, 1991; Lawrence, 1991).
11
used to increase sales revenue by a minimum adequate profit. By increasing the advertising budget and price, the oligopolist continues until a maximum revenue is achieved, which is just equivalent to the total cost plus the minimum suitable profit. The total revenue curve increases throughout the relevant range because of the assumption that increased advertising expenditure can always increase physical volume, though after a certain point, a sharp diminishing returns may be expected to set in. Therefore, an increase in advertising outlay must necessarily increase the total revenue.
Baumol (1959) noted the importance of a minimum profit constraint: profits must be at least acceptable to satisfy shareholders and to provide funds for growth. Scherer (1970) argued that although firms in highly competitive markets are constrained to maximize profits, firms in less competitive markets earn enough profits to pursue goals other than profit maximization.
1.5.5 Financial Ratio
Assessing a firm’s performance using financial ratio has been a powerful tool for decision-makers, creditors, business analysts, investors, and financial managers. Financial managerial performance is defined in terms of profitability, debt management, and asset management. Debt management is measured by the total debt to equity and the long-term debt to equity. National accounting standards are the task of a country’s legal, political, social, cultural, and economic environments. Often, they reflect the needs of the anticipated end-user of the financial statements and are heavily influenced by the accounting principles of other countries (Decker and Brunner, 1997).
Profitability is the greatest concern for every company and is the most significant measure of a company’s financial performance. One of the most commonly used tools in financial ratio analysis is profitability ratios, which are used to define the company's survival. Profitability measures are important for company managers and business owners. If a small business has outside investors who have put their own money into the company, the primary owner certainly has to show profitability to those equity investors (Bernstein and Wild, 2004).
12
industry, between industries, or within a firm itself and even with several countries. Matsumoto, et. al. (1995) discovered that earning per share growth rates is the most important in the analysts rank, followed by valuation, and then profitability ratios. Financial ratios are also used for the purpose of predicting future performance and provide very useful information about the strength and the weakness of an industry by obtaining a better understanding on a firm’s position and performance.
According to Ross, et. al. (2003), from the financial statements, using those financial ratios can provide benefits such as evaluating the performance of managers for the purpose of rewards, measuring competitive positions of competitors, giving information to dealers and creditors, assessing the financial performance of purchases, and projecting the future by supplying historical information to existing or potential investors. Delen, et. al. (2013) mentioned that most research and books provided between 20 to 30 most commonly used ratios, which are to be found acceptable to analyze a company’s performance.
Depending on the industry structure, sales growth may also provide additional market power, which firms can use to increase performance. The sales growth rate denotes the percentage of change in the sales of a company in a given year with respect to the previous year’s sales. It tells whether the company’s sales increase or decrease during a specific year and also tells the size of change. Kaplan and Norton (1992, 1993, 1996) claimed that to reach their financial objectives effectively, firms must use a wide diversity of goals, including sales growth.
1.5.6 ORBIS Database
13
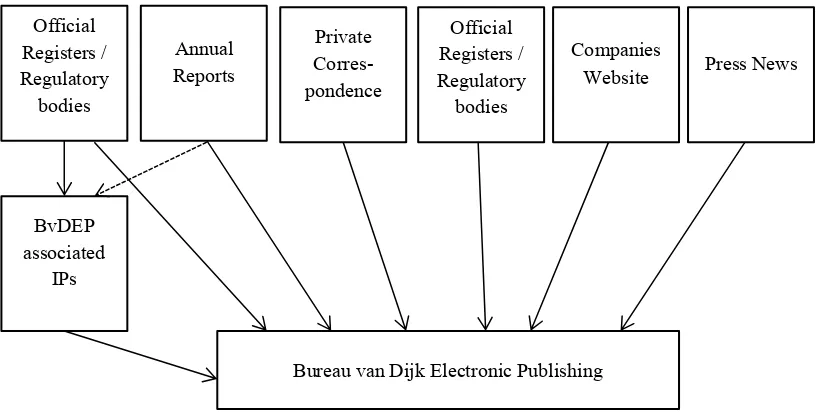
The validity date of the information directly collected by BvDEP in the annual reports of the companies or on Stock Exchanges is respectively the closing date of the annual report or the date mentioned by the Stock Exchange. BvDEP collects ownership information directly from the companies, from official bodies or from the associated information providers (BvDEP, 2008). Laws and rules regarding disclosure of ownership data differ widely between countries. Figure 1.2 shows the data collection process by BvDEP.
Figure 1.2: Data collection process by BvDEP Source: Bureau van Dijk Electronic Publishing (2008)
14