A STUDY ON SUSTAINABILITY OF SMALL HOLDER
DAIRY FARMING ON AGROFORESTRY SYSTEM: CASE
STUDY IN LEMBANG WEST JAVA PROVINCE, INDONESIA
WINDI AL ZAHRA
GRADUATE SCHOOL
STATEMENT
I, Windi Al Zahra, herby stated that this thesis entitled:
A Study on Sustainability of Small Holder Dairy Farming on Agroforestry System: Case Study in Lembang West Java Province, Indonesia
Is a result on my own work under the supervisor advisory board during the period February 2012- April 2013 and that it has not been published before. The content of the thesis has been examined by the advising advisory board and external examiner.
Bogor, April 2013
Windi Al Zahra
iv
RINGKASAN
WINDI AL ZAHRA. KAJIAN KEBERLANJUTAN USAHA
PETERNAKAN RAKYAT SAPI PERAH PADA SISTEM AGROFORESTRY: STUDI KASUS LEMBANG, JAWA BARAT. Di bimbing oleh BAGUS P. PURWANTO, M. FAIZ SYUAIB, and MASAKAZU KOMATSUZAKI
Usaha peternakan sapi perah mempunyai peranan penting dalam memenuhi kebutuhan gizi manusia, karena susu yang di hasilkan merupakan pangan lengkap yang sempurna. Perkembangan usaha peternakan sapi perah di Pulau Jawa akan menghadapi permasalahan serius, terkait dengan kelangkaan pakan. Sistem agroforestry dapat menjadi salah satu jalan dalam memenuhi kebutuhan hijauan untuk keberlanjutan usaha peternakan sapi perah. Lebih jauh, informasi mengenai potensi sistem agroforestry perlu diketahui lebih jauh, oleh karena itu penelitian ini dilakukan. Penelitian ini dilakukan di Agroforestry area, Lembang, Jawa Barat dan laboratorium lapang di Insitut Pertanian Bogor, Indonesia. Hasil penelitian menunjukkan adanya penurunan produktivitas secara signifikan dengan meningkatnya kerapatan pohon dan tinggi nya intensitas naungan (p<0.05). Hasil penelitian di laboratorium lapang juga menunjukkan adanya pengaruh naungan, pemberian pupuk organik dan pengaturan waktu panen terhadap kuantitas dan kualitas hijauan. Sebesar 31.1% produksi hijauan pada P. purpureum menurun dengan bertambahnya intensitas naungan. Kualitas hijauan seperti produksi bahan kering, abu, lemak dan protein secara dramatis dipengaruhi intensitas naungan (p<0.05). Berdasarkan hasil penelitan ini, dilakukan simulasi dengan beberapa skenario. Hasil simulasi menunjukkan adanya kemungkinan peningkatan TDNA (Ketersediaan TDN sebesar 34.09% dibandingkan dengan kondisi tanpa adanya management (penambahan pupuk organik dan pengaturan waktu panen). Nilai ini akan mampu memberikan tambahan pakan untuk 2311 (Unit standar) sapi perah di Lembang. Penilaian ekonomi juga di lakukan, dan menunjukkan tenaga kerja meliputi 15.12% dari total produksi, dan 17.63% sebagai gross margin. Sistem Agroforestry juga layak secara ekonomi. Sebesar keuntungan peternak per unit dan harga meningkat sebesar 18.38% dengan adanya perbaikan management.
SUMMARY
WINDI AL ZAHRA. A Study on Sustainability of Small Holder Dairy Farming on Agroforestry System: Case Study in Lembang West Java Province, Indonesia. Under the supervision of BAGUS P. PURWANTO,M. FAIZ SYUAIB, and MASAKAZU KOMATSUZAKI
Dairy farming practices is one of the empowerment agriculture sectors in Asia, due to Labor and nutrition fact on milk. The fastest dairy farming development found in Java island, noted as the most populated island in Indonesia. Todays, farmers conduct endeavor varied ways in filling forage demand for the dairy cattle, one of them by Agroforestry system. An appropriate management on Agroforestry system is highly required in enhancing forage production. However, the information of potency that might be occuring not clearly understood, therefore the broad objection of this research is to explore the potency of Agroforestry system due to sustainability of small scale dairy farming.
The observation of Agroforestry system was conducted in Lembang (West Java). Several plots have been designed West Java and As 78 of farmers have been involved. We observed, more than 36% of dairy farmers attempted the forage by utilizing forest area. We calculate the highest forage yield was gained in low-density forage (21.01 Mg/ha, 12% shading level). The lower forage yield (7.09 Mg/ha) was found in middle density plot, since it higher levels of shade (78%). In general discussion, it could be seen that in higher density plot showed higher nutrients compound specially in DM, fiber, protein and fat.
Experimental field has been design to understand the effect of shading treatment to the forage. In field experiment research there were two kinds of variety forage used; P. purpureum (King Grass) and S. Splendida. Pointed on the influence of shading levels, we were stressing on several treatments; un-shaded (0%) and shade treatments. The artificial shading treatment (60% and 80%) was applied for this research. Organic fertilizer was used as the secondary factor. As 30 Mg/ha, 20 Mg/ha and 10 Mg/ha of organic fertilizer were conducted. We were simulating for 40d, 50d and 60d of the harvest time. Therefore, totally 81 plots have been designed for this research. As 31.1% of forage yield was slowly decreasing as increasing shading intensities.Underneath shading condition such as 60% and 80%, the forage yield required higher organic fertilizer. In 40 and 50 days of plantation, the additional 30 Mg/ha organic fertilizer presences the highest forage yield underneath limitation of sun availability. The plant height was gradually increasing with the higher number of levels of shade. Chlorophylls content were the other respond showed by plant as the effect of shading treatment. It could be obtained that as 29.03% and 23.41% of chlorophyll content was increasing rapidly on P. purpureum, and S. splendida respectively.
vi S. splendida. There was a trend on the increment of crude fiber content influenced by Levels of shade and Defoliation management.
We calculated TDNA (Total Digestible Nutrient Available), that provided in forest in supplying TDN amount for the feed of dairy cattle in Lembang. The calculation of TDNA (Mg/yr) was carrying in two varied ways. The first was the actual TDNA in agroforestry system (TDNA without management improvement). In addition we also acquired the information regarding TDND (Total Digestible Nutrient Demand). We gained that as totally 15782 LSU was requiring approximately 35.895,15 TDN Mg/yr. It was gained that as 7.012,04 Mg/yr of TDN in the Agroforestry system in Lembang. In another hand, it affirmed that TDNA without management improvement supported 19.53% of totally TDND of the dairy cattle. Moreover, we also verified the amount of TDNA with management improvement. Likewise, the additional organic fertilizer and defoliation management has been conducted in order to improve forage production and its quality. We also obtained the number of carrying capacity (C) for 3100 LSU amounts of dairy cattle. This number increases with management improvement for 5411 LSU. We calculate that as 19.760,74 IDR/ days did dairy farmers issue the daily feed cost. The daily feed cost will be lower for 15.16% or as 21.561 IDR/days since farmers do some management improvement. Highlighted on the farmers income, we also obtained that profit was higher for 17.63%.. It was gained, as 18.38% of cost per unit and its price were getting higher with better improvement management.
Copyright @2013, Bogor Agricultural University Copyright are protected by law
1.It is prohibited to cite all part of this thesis without referencing to and mention the source :
a. Citation only permitted for the sake education, research, scientific writing, report writing, critical writing or reviewing scientific problems
b. Citation does not inflict the name and honor of Bogor Agricultural University
A STUDY ON SUSTAINABILITY OF SMALL HOLDER DAIRY FARMING ON AGROFORESTRY SYSTEM: CASE STUDY IN LEMBANG WEST JAVA
PROVINCE, INDONESIA.
WINDI AL ZAHRA D151110091
A thesis submitted for the Degree Programs of Master of Science in Animal Production and Technology
GRADUATE SCHOOL
x
A thesis submitted for the Degree Programs of Master of Science in Animal Production and Technology
Research Title : A Study on Sustainability of Small Holder Dairy Farming on Agroforestry System: Case Study in Lembang West Java Province, Indonesia
Name : Windi Al Zahra Student ID : D151110091
Study Program : Animal Production and Technology
Sign
Supervisor Comitee
Dr. Ir. Bagus P. Purwanto, M.Sc. Agr Supervisor
Dr. Ir. M. Faiz Syuaib, M.Sc. Agr Co Supervisor
Dr. Masakazu Komatsuzaki Co Supervisor
Program Coordinator
Prof. Dr. Ir. Muladno, M.SA
Dean of Graduate School
ACKNOWLEDGEMENT
In the name of Allah, the Most Gracious and the Most Merciful Alhamdulillah, all praises to Allah for the strengths and His blessing in completing this thesis entitled a study on sustainability of small holder dairy farming on agroforestry system: case study in Lembang west java province, Indonesia. This thesis submitted for the Degree Programs of Master of Science in Master of Science in Animal Production and Technology.
I would like to express my gratitude to Dr. Ir. Bagus P. Purwanto, M.Sc. Agr who served as my major advisor for the useful comments, remarks and engagement through the learning process of this master thesis. I am also grateful to my other committee members, Dr. Ir. M. Faiz Syuaib. M.Sc. Agr and Dr. Masakazu Komatsuzaki from Ibaraki University Japan, as for their constructive guidance, valuable advice and cooperation. This research is conducted as the part of Double Degree Program both Bogor Agriculture University and Ibaraki University, Japan.
TABLE OF CONTENTS
Page
Table of Contents ... xi
List of Table ... xiii
List of Figure ... xv
List of Appendices ... xvii
CHAPTER I ... 1
General Introduction ... 1
CHAPTER II. Agroforestry system supported Sustainability of Dairy Farming; Case study, Agroforestry system in Lembang district Area, West Java, Indonesia ... 4
2.1 Introduction ... 4
2.2 Method ... 5
2.3 Data Collection and Procedur ... 5
2.3.1 The calculation of carrying capacity on Agroforestry system .... 6
2.3.2 The analytical framework on economic calculation ... 7
2.4 Results and Discussion ... 8
CHAPTER III. An Experimental Treatment, A learnt from Actual Condition; The effect of shading and organic fertilizer on forage production ... 12
3.1 Introduction ... 12
3.2 Method ... 13
3.3 Soil and Fertilizer Analysis Measurement ... 15
3.4 Sampling Procedur and Data Collection ... 16
3.4.1 Plant Production ... 16
3.4.2 Forage layer height and leaf area ... 17
3.4.3 The measurement of Chlorophylls Content. ... 17
3.4.4 The analyses of forage quality. ... 18
3.3.4.1 Dry Matter Analysis ... 18
3.3.4.2 Ash Analysis ... 19
3.3.4.3 Fat Analysis ... 19
3.4.4.5 Fiber Analysis ... 22 3.4.5 Statistical Analysis. ... 22 3.4 Result and Discussion ... 24
3.4.1 Plant Responses due to the level of irradiance, organic fertilizer and Defoliation Management ... 24 3.4.2 The Nutrient Analysis of P. Purpureum and S. Splendida ... 44 CHAPTER IV
General Discussion ... 62 CHAPTER V
Conclusion and Recommendation ... 73 CHAPTER V
LIST OF TABLES
Number Page
1. Measurement of forage yield on varied plot designed (low, middle and
high density) ... 10 2. Biomass Production (kg/m2) obtained with the different distance (1 m to
5 meter) from the tree ... 10 3. The measurement of forage quality in Agroforestry System, in three
different plots (low, middle and high density plot) ... 11 4. The analyses of Fertilizer and Soil Sample ... 16 5. The Information of Component of Organic Fertilizer Analysis measured
in Field Center Experimental Research Faculty of Animal Science,
Bogor Agriculture University. ... 16 6. The Information of Soil Quality measured in Field Center Experimental
Research Faculty of Animal Science, Bogor Agriculture University ... 16 7. The Measurement forage yield (Mg/ha) P. Purpurem on different levels
of shade, organic fertilizer and defoliation management treatments. ... 25 8. The Measurement fresh weight production (Mg/ha) of S. Splendida on
levels of shade, organic fertilizer and defoliation management
treatments ... 27 9. The Measurement plant layer height (cm) P. Purpureum on Levels of
Shade, organic fertilizer and defoliation management treatments ... 30 10.The Measurement plant height (cm) on S. Splendida on Levels of Shade,
organic fertilizer and defoliation management treatments ... 32 11.The Measurement of leaf size (mm2) on P. Purpureum on Levels of
Shade, organic fertilizer and defoliation management treatments ... 34 12.The Measurement of leaf size (mm2) on S.Splendida on Levels of Shade,
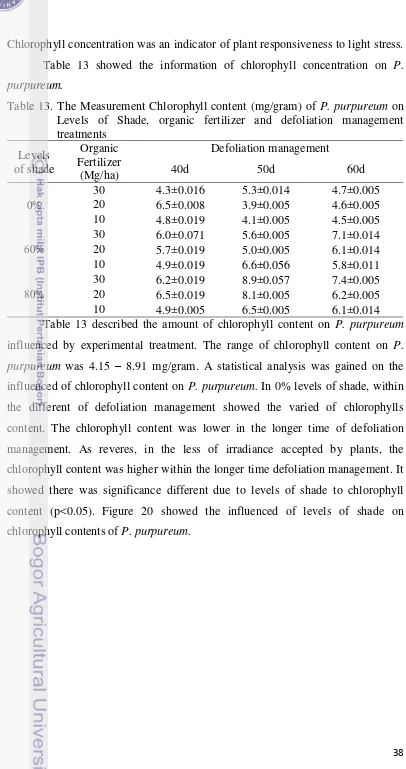
organic fertilizer and defoliation management treatments ... 36 13.The Measurement Chlorophyll content (mg/gram) of P. Purpureum on
Levels of Shade, organic fertilizer and defoliation management
treatments ... 38 14.The Measurement Chlorophyll content (mg/gram) of S.Splendida on
Levels of Shade, organic fertilizer and defoliation management
15.The Measurement Chlorophyll-a and chlorophyll-b (mg/gram) of P. Purpureum on Levels of Shade, organic fertilizer and defoliation
management treatments ... 41 16.The Measurement Chlorophyll-a and Chlorophyll-b (mg/gram) of S.
Splendida on Levels of Shade, organic fertilizer and defoliation
management treatments ... 43 17.The Measurement dry matter (DM) production (Mg/ha) of P.
Purpureum on Levels of Shade, organic fertilizer and defoliation
management treatments ... 45 18.The Measurement dry matter (DM) production (Mg/ha) of S. Splendida
on Levels of Shade, organic fertilizer and defoliation management
treatments ... 47 19.The Measurement ash content (%) of P. Purpureum on Levels of Shade,
organic fertilizer and defoliation management treatments ... 49 20.The Measurement ash content (%) of S. Splendida on Levels of Shade,
organic fertilizer and defoliation management treatments ... 50 21.The Measurement fat content (%) of P. Purpureum on Levels of Shade,
organic fertilizer and defoliation management treatments ... 52 22.The Measurement fat content (%) of S.Splendida on Levels of Shade,
organic fertilizer and defoliation management treatments ... 53 23.The Measurement protein content (%) of P. Purpureum on Levels of
Shade, organic fertilizer and defoliation management treatments ... 55 24.The Measurement protein content (%) of S.Splendida on Levels of
Shade, organic fertilizer and defoliation management treatments ... 56 25.The Measurement fiber content (%) of P. purpureum on Levels of
Shade, organic fertilizer and defoliation management treatments ... 58 26.The Measurement fiber content (%) of S.Splendida on Levels of Shade,
organic fertilizer and defoliation management treatments ... 60 27.Distribution of Dairy cattle in Indonesia (Java, Sumatra and others
island during 2007-2011 ... 63 28.The information of dairy cattle population and TDND based on its
30.Nutrient content from feeding composition of the dairy cow ... 68 31.The economic calculation of dairy farming enterprises in Lembang,
LIST OF FIGURES
Number Page
1. Site of Agroforestry research, Lembang West Java. ... 5 2. Sampling plot on agroforestry system in Lembang, West Java ... 6 3. The outspreading of household condition due to forage provision in
Lembang, West Java ... 8 4. Two kinds variety were used in the research (1) P. Purpureum, (2)
S.Splendida ... 13 5. The trend of solar irradiance on different of the level of shades ... 14 6. Defoliation management introduced in this research ... 14 7. Showed the microclimate condition among the research field at Field
Work Center, Faculty of Animal Science, Bogor Agriculture University,
(a) Temperature, (b) humidity, (c) rainfall, (d) solar irradiance. ... 15 8. Plot Design ... 23 9. The main effect levels of shade on forage yield P. Purpureum.
Subscripts with the same letter showed the significant different test by
Least Square Determination (LSD) in P<0.05... 26 10.The interaction both fertilization and defoliation management on forage
yield P. purpureum ... 27 11.The main effect defoliation management on forage yield (Mg/ha)
S.Splendida. Subscripts with the same letter showed the significant
different test by Least Square Determination (LSD) in P<0.05 ... 28 12.The interaction both fertilization and levels of shade measurement on
fresh weight production of S.Splendida ... 29 13.The main effect levels of shade measurement on plant height (cm) of P.
Purpureum. Subscripts with the same letter in the same column showed the significant different test by Least Square Determination (LSD) in
P<0.05 ... 31 14.The interaction both defoliation and fertilization treatment measured on
plant height of P. Purpureum ... 32 15.The main effect levels of shade measurement on plant height (cm) of S
Splendida. Subscripts with the same letter showed the significant
16.The main effect (1) levels of shade on leaf size (mm2) of P. Purpureum. Subscripts with the same letter in the same column showed the significant different test by Least Square Determination (LSD) in
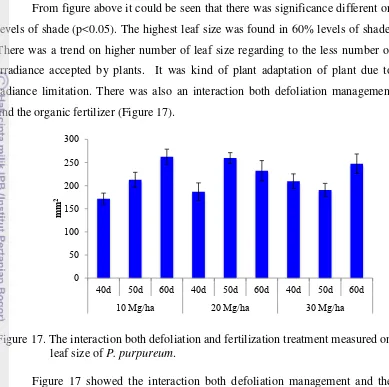
P<0.05. ... 34 17.The interaction both defoliation and fertilization treatment measured on
leaf size of P. Purpureum ... 35 18.The main effect (1) levels of shade and (2) defoliation management on
leaf size (mm2) of S.Splendida. Subscripts with the same letter in the same column showed the significant different test by Least Square
Determination (LSD) in P<0.05 ... 36 19.The interaction both defoliation management and levels of shade
measurement on leaf size of S.Splendid ... 37 20.The main effect levels of shade on Chlorophyll content (mg/gram) of P.
Purpureum. Subscripts with the same letter in the same column showed the significant different test by Least Square Determination (LSD) in
P<0.05 ... 39 21.The main effect levels of shade on Chlorophyll content (mg/gram) of
S.Splendida. Subscripts with the same letter in the same column showed the significant different test by Least Square Determination (LSD) in
P<0.05 ... 40 22.The mean effect levels of shade and measurement on (1) Chlorophyll-a
(mg/gram) and (2) Chlorophyll-b (mg/gram) of P. Purpureum. Subscripts with the same letter in the same column showed the
significant different test by Least Square Determination (LSD) in p<0.05 42 23.The mean effect levels of shade and measurement on (1) Chlorophyll-a
(mg/gram) and (2) Chlorophyll-b (mg/gram) of S. Splendida. Subscripts with the same letter in the same column showed the significant different
test by Least Square Determination (LSD) in p<0.05 ... 43 24.The main effect (1) levels of shade and (2) defoliation management of
P. Purpureum on DM production. Subscripts with the same letter in the same column showed the significant different test by Least Square
Determination (LSD) in p<0.05 ... 45 25.The interaction both defoliation management and the additional organic
fertilizer on leaf size of P. Purpureum ... 46 26.The main effect levels of shade of S.Splendida on DM production.
Subscripts with the same letter in the same column showed the
significant different test by Least Square Determination (LSD) in p<0.05 47 27.The interaction both levels of shade and the additional organic fertilizer
28.The main effect levels of shade of P. Purpureum on ash content (%). Subscripts with the same letter in the same column showed the
significant different test by Least Square Determination (LSD) in p<0.05 50 29.The mean effect levels of shade of S.Splendida on ash content (%).
Subscripts with the same letter in the same column showed the
significant different test by Least Square Determination (LSD) in p<0.05 51 30.The mean effect levels of shade of P. Purpureum on fat content
(%).Subscripts with the same letter in the same column showed the
significant different test by Least Square Determination (LSD) in p<0.05 53 31.The main effect levels of shade of S.Splendida on fat content (%).
Subscripts with the same letter in the same column showed the
significant different test by Least Square Determination (LSD) in p<0.05 54 32.The main effect levels of shade of P. Purpureum on protein content (%).
Subscripts with the same letter in the same column showed the
significant different test by Least Square Determination (LSD) in p<0.05 56 33.The mean effect levels of shade of S.Splendida on protein content (%).
Subscripts with the same letter in the same column showed the
significant different test by Least Square Determination (LSD) in p<0.05 57 34.The main effect (1) levels of shade and (2) defoliation management of
P. Purpureum on fiber content (%). Subscripts with the same letter in the same column showed the significant different test by Least Square
Determination (LSD) in p<0.05... 59 35.The main effect defoliation management of S.Splendia on fiber content
(%). Subscripts with the same letter in the same column showed the
significant different test by Least Square Determination (LSD) in p<0.05 60 36.Overview the dairy cattle population and milk production in Indonesia. .. 62 37.The comparisons both TDND and TDNA without and with management
improvement in Agroforestry system in Lemban ... 66 38.The comparisons of daily feed cost paid by farmers in low, middle and
high density respectively. ... 68 39.The comparisons of additional cost for renting land paid by farmers in
low, middle and high density respectively ... 69 40.The comparisons of daily feed cost issued by farmers without and with
1
CHAPTER I.
1. 1. General Introduction
The elevated of Indonesian‘s civilization-more than 237 million people with the growing rate for 1.49% (National Statistic 2011), less number of agriculture area, and the high number of food imports are major problems occuring now a days. Food staple- rice is no doubt required for human, wherase it does not support at all. However, the human trend consumption is change. People realize, milk contains important nutrients such kinds of vitamin, protein and mineral that could not be found in others food, therefore the awarness of people for consuming milk is rising.
Dairy products contribute 15–20% of human intake of total fat, 25–33% of saturated fat and about 15% of dietary cholesterol in the USA (Havel, 1997). In moderate economic growth, per capita consumption of temperate fruit, poultry, beef, other meat, baked products and dairy goods will grow most rapidly. In general, awarness of importance of milk consuming is enlarging with the escalation of household income. Despite the majority of people still regareded milk as luxurious beverage, but it recorded that the share of milk in monthly per capita food expenditure was 16.3% and 14.8% in urband and sub urban areas respectively (Sulastri 2005).
It is assessed that the amount of dairy cattle reachs 597.000 heads, that producing 925.775 tonnes of milk. It covers 30% of national milk production. Regrettably, this amount is insufficient in filling milk demand, consequently Indonesia goverment supposed to do import. Now a days, as 70% of milk production supplies from others country such as Australia, New Zealand Ect. Government is trying to improve National milk production, considering 90% of dairy farming is running by small scale enterprises, only 10% is proceeding by industrial scale. They are trying to improve milk production by varied ways, for example fixing dairy cattle performace, reproduction, Ect. Unfrotunatley, feeding problem unsolved quitely.
Island, where the microclimate condition was the best situated for dairy cattle; temperature 27-28 0C and RH 70-80%. East Java, Central Java and West Java were the location for the development of the dairy cattle (Director General Of Livestock And Animal Health 2011). Unfortunately, those areas were the most populated province in Indonesia, where also the fastest growing economic, industrial, and business.
In the future, the development of dairy farming will force serious problem. Limitation of farming area, and forage scarcity are the major problems in Java Island. Forage scarcity highly related with the land availability. Therefore, sustainability of dairy farming is needed to be considering. Forage is the main feed for the dairy cattle. Access to fresh, high quality pasture seems to be the most significant variable in the nutrition equation, regardless of organic or conventional production systems. It requires for maintenancing and growing for the dairy cattle. Forages are unique compared with other dietary ingredients. In fact, it provide long fibrous particles that are retained in the rumen longer and tend to ferment more slowly than smaller feed particles. It provides a consistent source of fuels to microbes in the rumen as well as a basal supply of fuels to the liver and mammary gland over time, allowing greater milk yield.
Now days, forage is limit, because of poor growing conditions and insufficient land base on individual farms that effected on milk production. Zemmling (2002) stated that whilst demand for livestock products is expanding, the total area of naturally occurring forages is declining as the more favorable areas are converted into arable land, leaving only the poorest land for grazing or gathering of feed for animals.
Todays, farmers conduct endeavor varied ways in filling forage demand for the dairy cattle. They are attempting for meeting its requirement by planting forage, purchasing forage or finding in the open area, Ect. Moreover, now a days the government and the farmers are collaborating to solve this problems. Planting forage is the most movement suggested for filling forage demand. Forage cultivation is conducting in any area that could be used for planting forage.
3
demand. Moreover, this system is well known as the Agroforestry system. Agroforestry system has a huge potency in supporting forage demand in West Java. Agroforestry defined as a farming system that integrates crops or livestock with trees and shrubs. This system is an effort as sustainability forage production for small scale dairy farming.
CHAPTER II.
Agroforestry system supported Sustainability of Dairy Farming; Case study, Agroforestry system in Lembang district Area, West Java, Indonesia
2.1 Introduction
Agroforestry is very important in particularly dairy farming practices. It roles in providing forage, which collaborated with forest plantation. In many parts of the world, this system has been recommended as a technique to ensure sustainability in animal production systems (Paciullo et al.2010). In dairy farming practices, Agroforestry viewed on ecological aspect, carried some benefits including to its environment and livestock sectors. Furthermore, others values together with biodiversity conservation (Pagiola et al. 2004), atmospheric carbon sequestration (Andrade et al., 2008; Soto-Pinto et al. 2010) and the mitigation of greenhouse effect gases (Kaur et al. 2002; Schoeneberger 2009), increased soil fertility and conservation (Power et al. 2003).
Agroforestry technologies enhance ultimate the quality of life for people (Young 1989). Highlighted among the benefits of the utilization of such system depends on the balance among pasture, trees and animal, as competition for growth and production resources, such as radiation, water and nutrients can render the system's sustainability unfeasible (Pacuillo et al. 2011). Smallholder farmers have traditionally used naturally occurring grasses, legumes, herbs, shrubs and tree foliage as the primary feeds for ruminants. Apart from some labor inputs, these feed resources were available at no cost and had little or no commercial value.
Additionally, the majority of dairy farming system was smallholder, where located mainly in Java Island, on the highland area, more than 700 meters above sea level, which the environment was better suited for dairy farming development.
1x1
Sampling Plot
1
2
3
4 5
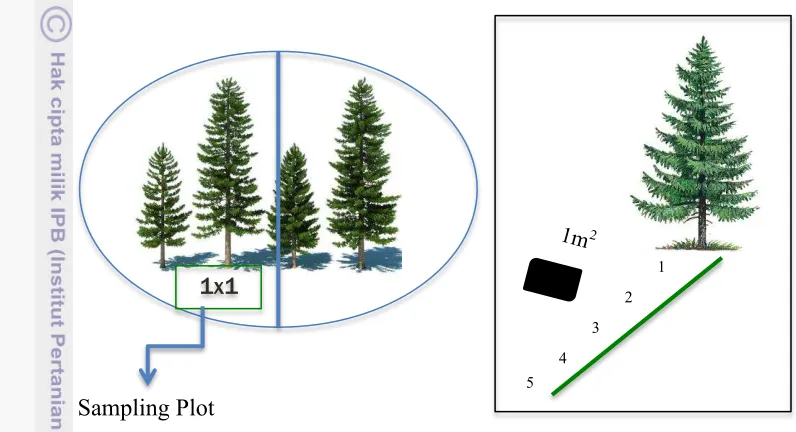
by using lux meter and fresh weight production was measured by using electrical balance. The data beneath the tree directly also obtained. The sample quadrats used of 1 x 1 m2 on each site with the distance 1m, 2m, 3m, 4m, 4m, and 5m respectively. Also, the measurement of lux intensity and fresh weight production were conducted (Figure 2).
Figure 2. Sampling plot on agroforestry system in Lembang, West Java
2.3.1 The calculation of carrying capacity on Agroforestry system
Carrying capacity was defined as the capacity of an ecosystem, which could maintain its productivity, adaptability, and capability of renewal (IUCN/UNEP/WWF 1991). In this study, the number of livestock that land resources in the study area could support has been considered as the carrying capacity, which was determined using following equation.
∑
7
2.3.2 The analytical framework on economic calculation
The analytical framework on economic calculation was designed to obtain the data regarding economic aspect of dairy farming system in Lembang. The interview method was conducted in order to get any further information with the respondent (dairy farmers). The determination of respondents were counted by the proportion estimation by using this equation (Rae 1994) :
n=
̂ ̂n = sample
̂ = estimated value for p
̂ = (1- estimated value for p) e = error
= normal distribution
The calculation of economic aspect on small-scale dairy farming was conducted. It was given the variable farm inputs as Xi and fixed farm input K are
used in agroforestry farm to produce output Yj. The relationship both he quantities
of input employed and quantities of output produced could be expressed as :
Y
j= f (Xi, K)
or explicity as :
Y
j= f (X
i, X
2, ….X
n, K) ………(X)
∑
∑
………..
(X)
Dairy farmers regarding the benefit aspect on Agroforestry system. As 78 of farmers have been involved in turn to obtain further information of Agroforestry system. We observed, that more than 36% of dairy farmers attempted the forage by utilizing forest area.
The dairy farmers, under any condition who were utilizing forest area for foraging might acquired with many benefits, either ecological or economic. It could explain easily; they were using the land that available for planting forage, further it supported for forage production for the dairy cattle. The land that available in forest was providing by renting to household. However, we also gained that the price for renting was inexpensive. Farmers issued approximately 245.000 IDR per Ha per yr. This amount was lower compared than they have to purchase forage. We averaged that household were belonging the land for 5.513,15 m2 in the forest. In figure 3 described clearly the spreading information regarding farmers condition due to filling forage demand.
Figure 3. The outspreading of household condition due to forage provision in Lembang, West Java
9
guided to the good impact on sustainability of dairy farming. We observed that there was a cooperative relationship both the farmers and the government. However, since the government officially regulated the household for planting forage in 2005, harmonized relation occurred on both side. Household had their awareness for keeping the forest, as the area for planting forage and for the natural conservation. Since the regulation was issued, some hazards were decreasing dramatically. For example, the fire accident was lower, the wood criminal harassment also depleted. However, co-management, activity that involving community has been proved successfully in maintaining the forest.
In Indonesia forest management is recognized by State Owned Forestry Enterprise (Perum Perhutani). Perum Perhutani has been established since 1961. The primary job is managing forest resources in Java and Madura Island. Their strategic programs are supporting balancing economic, Forest Eco-community system that had collaboration either Perhutani and Forest community or others
stakeholder. Forest area in Lembang is managed by ―Badan Kesatuan Pemangkuan Hutan Lembang‖ (BKPH). Forest has potency as the income‘s
source of community; planting forage, water resources, etc.
Furthermore, some problems facing by the household due to in utilizing forest area for foraging were also gained. The information were collected from deeply discussion, with the dairy farmers in Lembang. The farmers were facing low productivity of forage that planted beneath the tree.
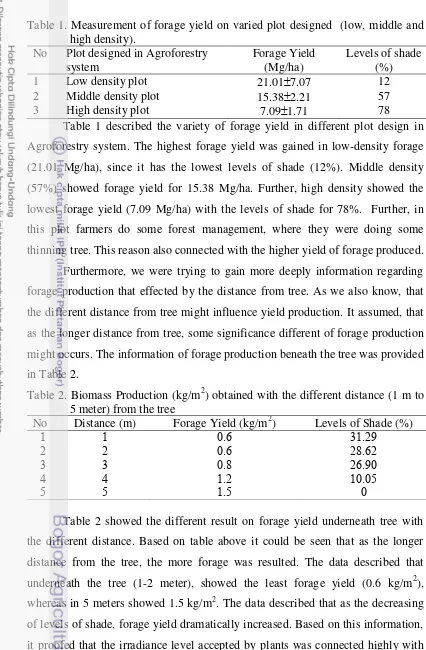
Table 1. Measurement of forage yield on varied plot designed (low, middle and high density).
No Plot designed in Agroforestry system Agroforestry system. The highest forage yield was gained in low-density forage (21.01 Mg/ha), since it has the lowest levels of shade (12%). Middle density (57%) showed forage yield for 15.38 Mg/ha. Further, high density showed the lowest forage yield (7.09 Mg/ha) with the levels of shade for 78%. Further, in this plot farmers do some forest management, where they were doing some thinning tree. This reason also connected with the higher yield of forage produced.
Furthermore, we were trying to gain more deeply information regarding forage production that effected by the distance from tree. As we also know, that the different distance from tree might influence yield production. It assumed, that as the longer distance from tree, some significance different of forage production might occurs. The information of forage production beneath the tree was provided in Table 2.
11
affected forage yield. The relationship was also occurring on forage yield, levels of shade and the distance, in Agroforestry system. In general speaking, it could be inferred that as the higher number of shading ratio, it showed the less number of production. Figure 4 also described the correlation both forage yield and the distance measured (R2). It could be inferred that R2 number was 0.91. On the other hand, it could be stated that as 91% of forage yield measured was affected by distance, and the rest influenced by others factors.
However, it also observed the quality of forage yield in Agroforestry system. We intended deeply information about the quality of forage yield in different density type. The information regarding the quality of forage could be seen in Table 3.
Table 3. The measurement of forage quality in Agroforestry System, in three different plots (low, middle and high density plot).
Table 3 described the measurement on forage quality in different type plot observation. The higher density plot showed higher nutrients compound specially in DM, fiber, protein and fat. It described that underneath canopy, the quality of forage was increasing. In middle density (78%) of levels of shade, showed the higher nutrient compound compared with low (12%) and high-density plots (54%). Moreover, the quality on grass also explained by Ludwig et al. (2004), who stated that in older trees tend to be more widely spaced than the smaller ones. These trees in medium density show an optimal effect on herbaceous layer productivity compared to more densely, where grasses have been inferior competitors for resources as a light, water and nutrients. Anna et al. (2007) more over also explained that in sub canopy of tree reflect a high Nitrogen and Phosphor value, as the facilitative effect of trees prevails.
An Experimental Treatment, A learnt from Actual Condition; The effect of shading and organic fertilizer on forage production
3.1 Introduction
Agroforestry system was known briefly as an effort for providing forage, elaborated with forest plantation. However, agroforestry system was complicated because it involved many factors, such as solar radiation, tree growth, density, sloping, rainfall etc. Those factors were quite hard to understand in estimating forage production. Simplification of those factors was required in estimating forage availability in forest. In order we could understand the potency of agroforestry as the source of forage plantation. Therefore, the research was conducted, several factors were involved to understanding the Agroforestry system related to the small-scale dairy farming in Indonesia. A learn from actual condition was introduced in field experiment research. The using of P. purpureum as the most used forage variety used by farmers, whereas discover the potency of S. splendida as the other variety for animal feed also conducted. S. splendida has been known as the one of forage that used as a feed for animal. Wilson and Minson (1980) also proofed that the leaf of plant has a more the organic matter digestible than the steam. S. splendida, consist more leaves than the steam. Further, we would like also gained about the endurance of S. splendida underneath the levels of shade.
Level of irradiance (shading) was used as the first factor assumed might affect forage production. It became the primary limiting factor because levels of shade would curb growth in biomass accumulation. Organic fertilizer was used as the secondary factor. Using organic fertilizer was very important for sustainability dairy farming. Since the organic fertilizer has been known widely as the factor that might increase SOM (Soil Organic Matter). SOM was also known as the indicator for soil health. Defoliation management also affected forage production substantially. Defoliation, whether by hand or by animals reduced leaf area and induced a carbon shortage in plants through reduction in light interception. The objection of this research is to gain the information about the forage yield due to shading affect and its quality.
0
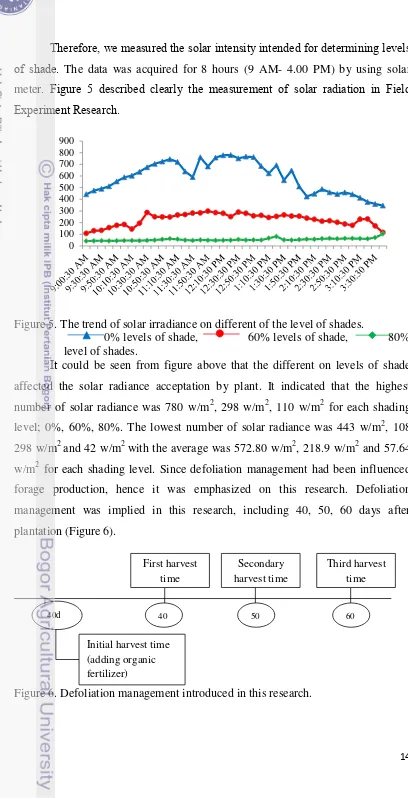
Therefore, we measured the solar intensity intended for determining levels of shade. The data was acquired for 8 hours (9 AM- 4.00 PM) by using solar w/m2 for each shading level. Since defoliation management had been influenced forage production, hence it was emphasized on this research. Defoliation management was implied in this research, including 40, 50, 60 days after plantation (Figure 6).
Figure 6. Defoliation management introduced in this research.
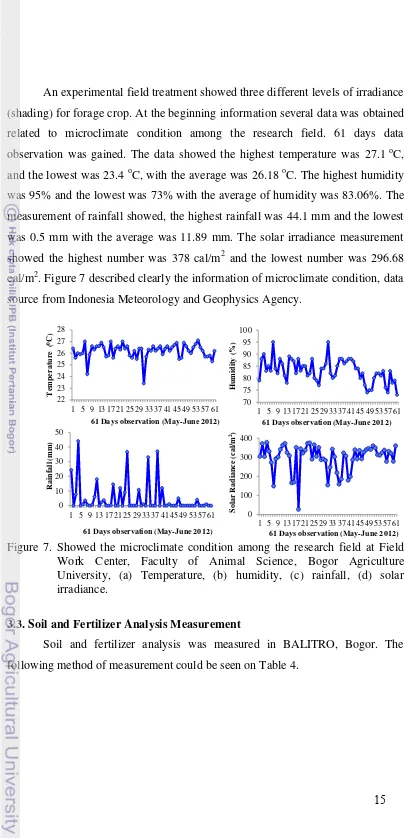
15 An experimental field treatment showed three different levels of irradiance (shading) for forage crop. At the beginning information several data was obtained related to microclimate condition among the research field. 61 days data observation was gained. The data showed the highest temperature was 27.1 oC, and the lowest was 23.4 oC, with the average was 26.18 oC. The highest humidity was 95% and the lowest was 73% with the average of humidity was 83.06%. The measurement of rainfall showed, the highest rainfall was 44.1 mm and the lowest was 0.5 mm with the average was 11.89 mm. The solar irradiance measurement showed the highest number was 378 cal/m2 and the lowest number was 296.68 cal/m2. Figure 7 described clearly the information of microclimate condition, data source from Indonesia Meteorology and Geophysics Agency.
Figure 7. Showed the microclimate condition among the research field at Field Work Center, Faculty of Animal Science, Bogor Agriculture University, (a) Temperature, (b) humidity, (c) rainfall, (d) solar irradiance.
3.3. Soil and Fertilizer Analysis Measurement
Table 4. The analyses of Fertilizer and Soil Sample was used. The information regarding component of organic fertilizer used soil quality analysis provided in Table 5 and 6.
Table 5. The Information of Component of Organic Fertilizer Analysis measured in Field Center Experimental Research Faculty of Animal Science, Bogor Agriculture University.
Table 6. The Information of Soil Quality measured in Field Center Experimental Research Faculty of Animal Science, Bogor Agriculture University Levels of
3.4 Sampling Procedure and Data Collection 3.4.1 Plant Production
17
ground whereas S. Splendida was cutting and reminding 5 cm from ground. Remove sample from any roots from plants and brush off dirt particles. Fresh weight was measured and dried in 65 OC for 48 hours and weighted again. Plant biomass was converted into Mg/ha in dry weight basis. Leaves were grinded partially dried sample into fitness desired for analyses.
3.4.2 Forage layer height and leaf area
The measurement of forage layer height (cm) was done by measuring from the soil surface to the highest point of the arch of the uppermost leaf. We were using stick ruler with the maximum length was 3m. We also focused on measurement on leaf area (mm2). It measured by using leaf area meter. Both forage layer height and leaf area were completed in 60 days after plantation.
3.4.3 The measurement of Chlorophylls Content.
The following analysis was performed on chlorophylls content, including chlorophyll a and chlorophyll b. Small sward was cut and used as a sample; the third and forth leaves from the bottom of the ground. Fresh leaf was breaking into simpler form and measured for 1 gram. It was destructed and dissolved by using 80% acetone for 2 ml. Sample was centrifuged and diluted for 5 ml. Sample of chlorophyll were observed by using spectrophotometer (UV-Vis) on the wave length 663 and 645 nm. The calculation of total chlorophyll (the a and b chlorophyll) was counted by using equation (Yoshida 1981):
a chlorophyll = (0,0127 x D663–0,00269 x D645) fp
b chlorophyll = (20,2 x D645 + 8,02 x D663) fp
fp = dilatation factor = d/e x b/c x 1/a x 1.000 Information
A = weight of sample B = initial extract volume
C = the extract volume obtained from the initial extraction D = extract volume after destructed
D663 = spectrophotometer on 633 nm wave length D645 = spectrophotometer on 645 nm wave length
3.4.4 The analyses of forage quality
Since the feed was not only focused on the quantities rather its quality. Moreover the main process of growth from forage was obtained form photosynthesis process. However, the product of photosynthesis would be transferred into the organ for the growth and maintenance. The product of photosynthesis was the dry matter production and others nutrients compound. Hence, the nutrients content analyses were measured on moisture analysis, dry matter production, ash analysis, fat content fiber content and protein content respectively.
3.4.4.1 Dry Matter Analysis
Dry matter analysis was measured based on AOAC method (Association of Official Analytic Chemist). The Total Dry Matter by Oven Drying at 105oC for 16 hr. The principle mechanism was emphasized on the heat treatment (1050 C). Water would evaporated by heat treatment, remaining the rest material (dry matter) that would be weighted formerly. Total dry matter is determined
gravimetrically as residue remaining after drying. Weighing made on hot sample or after cooling in desiccator. The calculation of moisture content (%) could be seen on equation:
Where
W1 = dry weight of sample and container (with cover) in grams
W2 = tare weight of container (with cover) in grams
W3= dry weight of sample in grams
Percent Total Moisture was calculated as:
19
3.4.4.2 Ash Analysis
Ash of Animal Feed. (942.05) Official methods of Analysis. 1990. Association of Official Analytical Chemists, 15th Edition. Ashing is the process of mineralization for preconcentration of trace substances prior to chemical analysis. The ash content is an approximate measure of the mineral content and other inorganic. Remove crucibles with cover which have been dried for at least 2 hr at 100 0C from oven, to desiccator. Cool, and record weight of crucibles with cover to the nearest 0.1 mg (W1). Weigh 1.5 to 2.0 g of sample into the crucible, recording weight of crucible with cover and sample to the nearest 0.1 mg (W2). Ash in furnace at 600 oC for 2 hr after the furnace reaches temperature. Allow crucibles to cool in furnace to less than 200 oC and place crucibles with cover in desiccator with vented top. Cool and weigh crucible with cover and ash to the nearest 0.1 mg (W3).
3.4.4.3 Fat Analysis
Fat analysis was conducted based on AOAC method. It emphasized on the fat extraction measurement. Sample was weight the ground dry sample into the extraction thimble. The extraction thimble was closed with fat free cotton wad, and inserted into the Soxhlet extractor. Fill the solvent into the solvent vessel, and extracted at a temperature of 50 OC for 16 hours. The solvent drained into a suitable container by opening the spigot on the Soxhlet extractor. The solvent vessel was continued for heating until all the solvent has been evaporated and condensed in the Soxhlet extractor. Vessel contained fat residue was placed in a drying oven (105 OC) and heat to constant weight (indicating evaporation of all solvent). The vessel containing the fat was allowed to cool to room temperature (about 30 minutes).
Where
m1 = weight the dry empty vessel (gram)
m2 = weight of the vessel containing fat residue after evaporation of the solvent
(gram)
E = the sample weight (gram)
3.4.4.4 Protein Analysis
Protein (Crude) Determination in Animal Feed: Copper Catalyst Kjeldahl Method. (984.13). Official Methods of Analysis. 1990. Association of Official Analytical Chemists. The Kjeldahl method is the standard method of nitrogen determination dating back to its development in the late 1800's. The method consists of three basic steps: 1) digestion of the sample in sulfuric acid with a catalyst, which results in conversion of nitrogen to ammonia; 2) distillation of the ammonia into a trapping solution; and 3) quantification of the ammonia by titration with a standard solution.
Digestion
Weigh approximately 1g ground sample into digestion flask, recording weight (W)to nearest 0.1 mg. Include reagent blank and high purity lysine HCl as check of correctness of digestion parameters. Weigh a second subsample for laboratory dry matter determination. Add 15 g potassium sulfate, 0.04 g anhydrous copper sulfate, 0.5 to1.0 galundum granules. Place flask on pre heated burner (adjusted to bring 250mL water at25oC to rolling boilin 5 min). Heat until white fumes clear bulb of flask, swirl gently, and continue heating for 90 minfor copper catalyst or 40 min for CuSO4/TiO2 mixed catalyst. Cool, cautiously add 250 mL distilled water and cool to room temperature (<25oC). Note: If bumping occurs during distillation, volume of water may be increased to ca. 275 mL.
Distillation:
21 solution. Add 2 to 3 drops of tributyl citrate or other anti foam agent to digestion flask to reduce foaming. Add another 0.5 to1.0 galundum granules. Slowly down side of flask, add sufficient 45% sodium hydroxide solution (approximately80 mL) to make mixture strongly alkali. (Do not mix until after flask is connected to distillation apparatus or ammonia will be lost.) Immediately connect flask to distillation apparatus and distill at about 7.5 boil rate (temperature set to bring 250 ml at 25 oC to boil in 7.5 min), until at least 150 ml, distillate was collected in titrating flask. Remove digestion flask and titrating flask from unit, rinsing the condenser tube with distilled water as the flask is being removed.
Titration
Titrate excess acid with standard sodium hydroxide solution to orange endpoint (color change from red to orange to yellow) and record volume to nearest 0.01 mL (VNaOH). Titrate the reagent blank (B) similarly.
The calculation of N (%) :
[ ]
VNaOH = mL standard NaOH needed to titrate sample
VHCl = mL standard HCl pipetted into titrating flask for sample
VNaOH = Normality of NaOH
VHCl = Normality of HCl
VBK = mL standard NaOH needed to titrate 1 mL standard HCl minus B B = mL standard NaOH needed to titrate reagent blank carried through method and distilled into 1 mL standard HCl 1.4007 = milliequivalent weight of nitrogen x 100
W = sample weight in grams
Percent Crude Protein (CP)
3.4.4.5 Fiber Analysis
Fiber analysis was conducted based on AOAC method. The understanding principle of this calculation was the organic material that not soluble in liquid concentrated acid and concentrated base heating for 30 minutes. The rest material remaining was fiber. It would be burn into 600 OC, and stated as the fiber content (%).
% Fiber
Where :
x = sample weighed
a = the weight of paper filter
y = sample weight of the cup after heated on liquid concentrated acid and Concentrated base.
Z = sample after heated on 600 OC
3.4.5 Statistical Analysis
Plant production and nutrient analyses data were tested for significant differences using randomize block complete ANOVA. Least significance difference (LSD) post hoc tests were conducted to compare means between treatments. Data were analyzed by using StatView, SAS Institute Inc.
Hypothesis
1. The Hypothesis of treatment factors due to levels of shade H0 = ̅̅̅̅= ̅̅̅̅= ̅̅̅̅
H1 = At least there was a level shade treatment resulting in the effect 2. The Hypothesis of treatment factors due to organic fertilizers
H0 = ̅̅̅̅= ̅̅̅̅= ̅̅̅̅
H1 = At least there was an organic fertilizers treatment has an effect
3. The Hypothesis of treatment factors due to Blocking‘s components
(defoliation management) H0 = ̅̅̅̅= ̅̅̅̅̅̅̅ ̅̅̅̅ H1 = ̅̅̅̅≠ ̅̅̅̅≠ ̅̅̅̅
23
Yijk = Forage production (Pennisetum purpureum and Setaria Splendida )
Influenced by shading level (i) and organic fertilizer (j) µ = Mean Square
KK = Influence of blocking, ie: -k
Ai = Influence of solar radiation ie: -i
Bl = Influence of fertilization ie-l
ABil = Interaction of solar radiation and fertilization
3.4 Result And Discussion
3.4.1 Plant Responses due to the level of irradiance, organic fertilizer and Defoliation Management
Several treatments on Field Experimental research were design and the data regarding forage production was gained. Moreover, the levels of shade were assumed might influence strongly on forage yield. Levels of shade were connected directly with light availability. Light is electromagnetic radiation of
wavelengths to which the human eye is sensitive(λ ≈ 400 to 700 nm). However,
sometimes the word light is also used to refer to other nearby regions of thespectrum: ultraviolet (shorter wavelengths than visible light) and infra-red (longer wavelengths). Light is both a source of energy and a source of information for green plants. It is a sourceof energy for photosynthesis, and a source of information for photoperiodism (night/day length), phototropism (light direction), and photomorphogenesis (light quantity and quality) (Aphlaho 2006). Trees in some ecosystems, for example in forest, savanna, ect have been referred to as
‗islands of fertility‘ (Belsky et al. 1989), because elevated soil nutrients are found beneath their crowns, together with decreased solar radiation, reduced evapotranspiration and reduced soil temperatures (Ludwig et al. 2004).
The use of organic fertilizer such as manure might be useful to increase SOM. Thelen et al. (2010) observed the manure effected to soil organic matter by using corn Stover. Based on the research, they were obtained that adding manure or compost were effective ways to build SOM even with complete removal of corn Stover. Therefore manure (the organic fertilizer) was used on this research.
25
effects of light quality on whole plant mineral nutrient uptake and status have been little studied (Aphlaho 2006).
In actual condition forage plantation was forced by the limitation of sun availability that could be influence forage production. This condition occurred as the impact of competition both the trees and its plant. In general, plants have two main strategies in response to light competition: overgrow and shade the competitors and/or tolerate shade by maximizing growth under reduced light (Humphreys 1981). The former was obviously not a viable strategy for pasture plants growing in association with trees. However, tropical grasses were differing in their tolerance of shade. Several data were gained as its responses regarding to different levels of solar radiance, the utilization of organic fertilizer and defoliation management. The information consists of variations including forage yield, plant architecture (plant layer height), and leaf area also chlorophyll concentration. In the early respond was provided the measurement on forage yield production on P. purpureum.
0 5 10 15 20 25 30 35
0 60 80
M
g
/ha
(%) a
a
b
such as 60% and 80%, the forage yield required higher organic fertilizer. In 40 and 50 days of plantation, the additional 30 Mg/ha organic fertilizer presences the highest forage yield underneath limitation of sun availability. While, in the longer time or harvest time, it required less organic fertilizer to obtain maximum yield. In 60 days after plantation, the organic fertilizer was required for 20 Mg/ha. We calculated that as 31.1 % of forage production was depleting, since it planted on 80% Levels of shade (Figure 9).
Figure 9. The main effect levels of shade on forage yield P. purpureum. Subscripts with the same letter showed the significant different test by Least Square Determination (LSD) in P<0.05.
27
40d 50d 60d 40d 50d 60d 40d 50d 60d
10 Mg/ha 20 Mg/ha 30 Mg/ha
M
g
/ha
Figure 10. The interaction both fertilization and defoliation management on forage yield P.purpureum.
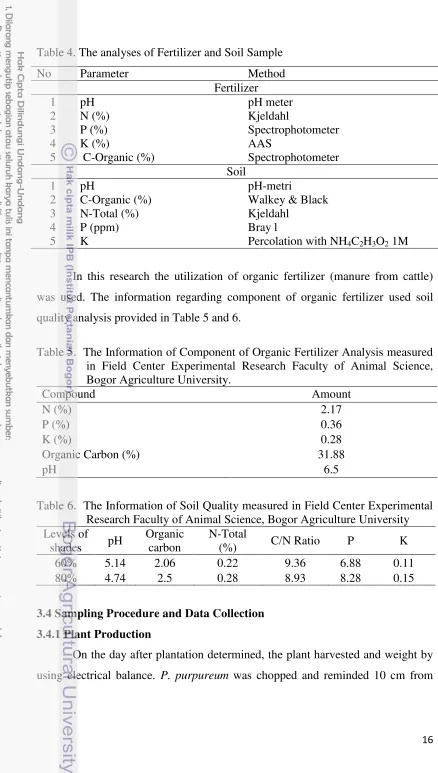
In figure 10, the interaction occurred as the impact of additional organic fertilization and defoliation management on forage yield. Furthermore, it could be understood that the additional fertilizer, compacted with defoliation management. As in the early growing stage on the plant that required additional fertilizer to support plant growth. In the longer time of defoliation management, the amount of fertilizer needed slowly decreasing. We also observed the influenced of treatments on S. splendida. In table 8 was showing the forage yield S. splendida influenced by levels of shade, organic fertilizer and defoliation management. Table 8. The Measurement fresh weight production (Mg/ha) of S. splendida on
levels of shade, organic fertilizer and defoliation management treatments Levels
0
shading highly influenced to forage yield. In S. splendida, within the longer time of defoliation management, it required less organic fertilizer. It could be seen in Table 8 that the optimum forage yield for 0% levels of shade in 40 days after plantation for 30 Mg/ha, and with the longer time of defoliation management (50 and 60 days after plantation), the requirement of organic fertilizer was reducing for 20 Mg/ha. The result quite different with the influence of the limitation of sun availability, whereas in 60% levels of shade showed the higher organic fertilizer requirement for 20 Mg/ha for 40 and 50 days after plantation. The organic fertilizer was required higher for 30 Mg/ha for the longer time defoliation management (60 days after plantation). In this study, defoliation management has a significance effect due to forage yield (Figure 11).
Figure 11. The main effect defoliation management on forage yield (Mg/ha) S. splendida. Subscripts with the same letter showed the significant different test by Least Square Determination (LSD) in P<0.05.
Figure 11 described the influence of defoliation management due to fresh weight of S. splendida. It could be seen that the different time of days after plantation has lead the different amount of fresh weight production. In this study, there was significance different on 60 days defoliation management (p<0.05). It also found that S. splendida did not show the direct effect regarding to shading effect. However, the influenced of levels of shade has seen as the interaction with the additional organic fertilizer (Figure 12).
a a
29
Figure 12. The interaction both fertilization and levels of shade measurement on fresh weight production of S. splendida
Figure 12 described that there was an interaction both fertilization and levels of shade. It could be seen that the additional fertilizer related to the availability of light. Fertilizer has a function in supporting nutrient, specifically when plant in an emerge condition, lack of nutrient or sun availability. Therefore the additional fertilizer was important. On figure 12 described that the additional fertilizer on 80% levels of shade has been encouraged forage yield, event tough it could not be higher compared with 60% levels of shade. Nevertheless, this founding could be useful as the farming management system as the initial information of S. splendida as the forage forest plantation.
The study regarding plant production and the influenced of light has been done by Baruch and Gueni (2007). Based on their observation in understanding forage production and irradiance acceptation by Brachiaria S.p. They declared that the forage production was dramatically decreasing with the lower number of irradiances. The other research also showed by Poorter & Oberbauer (1993) who stated that plants in high light, on the other hand are faced with high radiation loads. Thus, they invest more in root mass, in a way that compensates for higher transportation losses by water uptake.
to low levels of irradiance. It was clearly described that the sun radiance supply was highly influenced on biomass production. It was related to the photosynthetic energy captured, providing green plants with almost all of their chemical energy, and central to their ability to compete and reproduce (Givnish 1998).
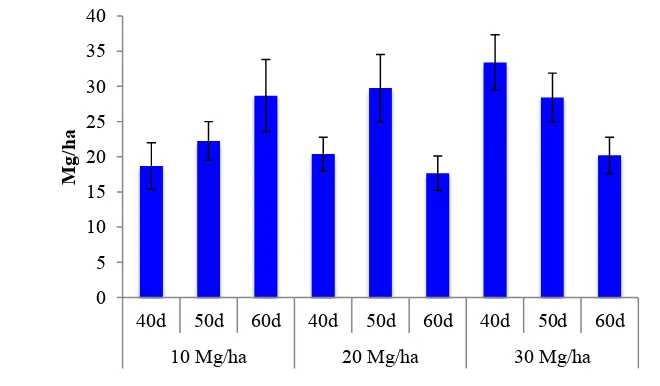
The data in field experimental research showed the similar trend which occurring in Agroforestry system, in Lembang, West Java. In the actual condition the levels of shade were highly influenced forage yield. Further it also observed that the organic fertilizer showed the dramatically change due to yield production. Defoliation treatment also affected due to biomass accumulation. The study showed optimum days after cut was 50d. On 50 days of cut, reflected the optimum fresh weight accumulation both in P. purpureum and S. Splendida. In 40 days after plantation, forage production was not optimum, whereas the yield was slowly decreasing after 50 days after cut. It could be seen that less production was obtained in 60d, compared with 50d. However the data might highly beneficial used for forage management information for sustainability of dairy farming. We also observed the respond of the forage from experimental treatment on the plant height. It was considering as the growth stage of the plant. The data regarding plant height of the plant was obtained on this research showed in Table 9.
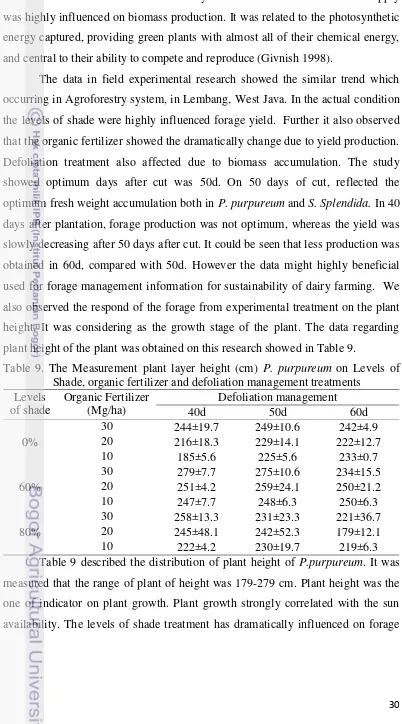
Table 9. The Measurement plant layer height (cm) P. purpureum on Levels of Shade, organic fertilizer and defoliation management treatments
Levels
31
210 220 230 240 250 260 270
0 60 80
cm
(%)
layer height. It could be seen that in Figure 13 showed how levels of shade treatment influenced plant height on P. purpureum.
Figure 13. The main effect levels of shade measurement on plant height (cm) of P. purpureum. Subscripts with the same letter in the same column showed the significant different test by Least Square Determination (LSD) in P<0.05.
In general, the plant height was gradually increasing with the higher number of levels of shade. It could be seen in Figure 13 that, the plant height was higher in 60%, but slowly decreasing to 80% levels of shade. It obtained the average of highest plant height was 254.94 cm and found in 60% levels of shade. It also gained that 0% levels of shade produced the less plant height as 227.39 cm. The different average of plant height was occurring as the kind adaptation mechanism of forage, as the less number of irradiance that accepted by forage for photosynthesis. In this study, it also found the interaction both the additional organic fertilizer and defoliation management. In Figure 14, it could be seen the interaction on both factors (organic fertilizer and defoliation management treatments).
b
a
0
40d 50d 60d 40d 50d 60d 40d 50d 60d
10 Mg/ha 20 Mg/ha 30 Mg/ha
cm
Figure 14. The interaction both defoliation and fertilization treatment measured on plant height of P. purpureum.
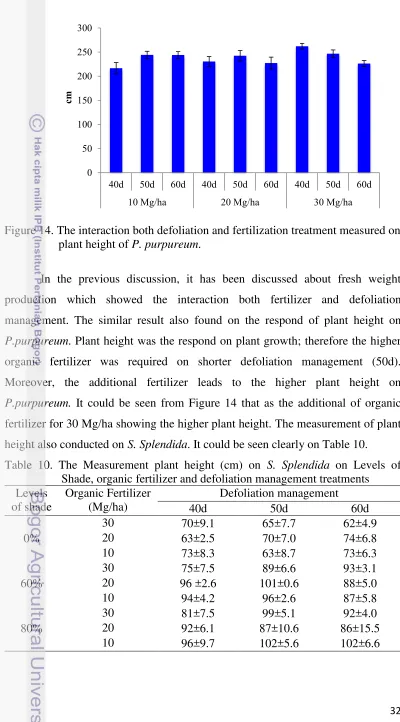
In the previous discussion, it has been discussed about fresh weight production which showed the interaction both fertilizer and defoliation management. The similar result also found on the respond of plant height on P.purpureum. Plant height was the respond on plant growth; therefore the higher organic fertilizer was required on shorter defoliation management (50d). Moreover, the additional fertilizer leads to the higher plant height on P.purpureum. It could be seen from Figure 14 that as the additional of organic fertilizer for 30 Mg/ha showing the higher plant height. The measurement of plant height also conducted on S. Splendida. It could be seen clearly on Table 10. Table 10. The Measurement plant height (cm) on S. Splendida on Levels of
33
Table 10 described that the plant height of S. Splendida. The plant height range of S. Splendida was 63 – 102 cm. The height was varying since the experimental treatment given. Based on the statistical calculation it could be found that there was significance different on plant height due to the defoliation management (p<0.05). The main effect of defoliation management on S. Splendida could be seen on Figure 15.
Figure 15. The main effect levels of shade measurement on plant height (cm) of S. Splendida. Subscripts with the same letter showed the significant different test by Least Square Determination (LSD) in P<0.05
In Figure 15, it could be seen briefly that the different height of S. Splendida affected by the experimental treatment. In S. Splendida, the highest
plant height was 94 cm that found in 80% levels of shade. It was higher compared than 0% levels of shade as 68.93 cm. In this study, it was probably the maximum stage for the respond of S. Splendida. Moreover, the height plant was found slowly decreasing as the higher levels of shade. Underneath limitation of sun availability, the requirement of organic fertilizer was higher. It could be seen that the plant height under 60% levels of shade was required 20 Mg/ha organic fertilizers in 40 and 50 days after plantation. Whereas, the longer time of defoliation management (60 days after plantation), the highest plant layer height was found with the additional 30 Mg/ha.
The data explained that plant height as the one of adaptation mechanism on plant regarding the environmental condition due to the shading affect. It argued by Similarly Paez and Lopez (2000) who observed that plant height increased in the shading effect. Shading treatment extremely affected the plant height as its respond on the less number of the radiance. The other respond of plant respond
b
ab
0
due to experimental research treatment was leaf area of the plant. It was measured on an each piece the leaf. The information of leaf area could be seen in Table 11. Table 11. The Measurement of leaf size (mm2) on P. purpureum on Levels of
Shade, organic fertilizer and defoliation management treatments Levels
Table 11 showed the measurement of leaf size on P. purpureum. Leaf size could be used as the indicator of growth and for the respond of experiment treatments. It related with the ability of leaf for photosynthesis process. Since the shading treatment was given influenced to the leaf size. We observed that defoliation management was significance different due to leaf size (p<0.05). Even though the organic fertilizer was not directly influenced for leaf size, but we observed the higher organic fertilizer was presented the higher leaf size within the higher levels of size. In 50 and 60 days after plantation underneath 60% levels of shade, the organic fertilizer required was 10 Mg/ha, while in 80% levels of shade the organic fertilizer was required for 20 Mg/ha. Figure 16 showed the impact of defoliation management due to leaf size of P. purpureum.