LAND VALUE ZONES AUTOMATION
FOR LAND MARKET INFORMATION
(Case Study of Desa Nagrak Kecamatan Gunungputri
Kabupaten Bogor)
VEVIN S. ARDIWI
J
AYA
STATEMENT
I, Vevin S. Ardiwijaya, here by stated that this thesis entitled:
Land Value Zones Automation for Land Market Information
(Case Study of Desa Nagrak Kecamatan Gunungputri Kabupaten Bogor)
are results of my own work during the period of January until October 2006 and that it has not been published before. The content of the thesis has been examined by the advising committee and the external examiner.
Jakarta, December 2006
ABSTRACT
VEVIN S. ARDIWIJAYA (2006). Land Value Zones Automation for Land Market Information, A Case Study in Desa Nagrak, Kecamatan Gunungputri, Kabupaten Bogor, West Java, Indonesia. Under the supervision of YULI SUHARNOTO and J. P. TAMTOMO.
In Indonesia it is a reality that terminology of valuation is connoted to several institutions attached with their respective interests. For instance, PBB relates to taxation, BPN terms valuation for expropriation, while banks define valuation in term of credits, etc. PBB has collected transaction values from previous years to assign land value zone. These zone are visualized in Zona Nilai Tanah Map (ZNT map), which is nearly similar to a sketch map. This map is produced through delineation of such zonemanually, performed by the expert. Valuation by BPN in general is not yet applied, however there is a prototype produces by Indonesian Land Assessment Project (INLA Project). This prototype uses the analyzing market data and developing the valuation models. Valuation model consist of value maps with value zones and tables or formulas for valuation of each property.
Based on that condition, this research is intended to develop the determination of land value zones by applying the road type approach and its transaction values to produce automatic land value zone map, with study case in Desa Nagrak, Kecamatan Gunungputri, Kabupaten Bogor. It is then expected that this research will provide a lot of benefits not only to BPN and PBB but also to other interested parties.
LAND VALUE ZONES AUTOMATION
FOR LAND MARKET INFORMATION
(Case Study of Desa Nagrak Kecamatan Gunungputri
Kabupaten Bogor)
VEVIN S. ARDIWIJAYA
A Thesis submitted for the degree of Master of Science Of Bogor Agricultural University
MASTER OF SCIENCE IN INFORMATION TECHNOLOGY
FOR NATURAL RESOURCES MANAGEMENT
GRADUATE SCHOOL
ACKNOWLEDGEMENT
There are many people I should thank in regard to this work and no doubt I will not be able to name them one by one. To these I can but beg forgiveness. I wish to thank my supervisor Dr. Yuli Suharnoto and my co-supervisor Drs. J. P. Tamtomo, M.Eng for they guidance, technical comments and constructive criticism through all months of my research.
Research Title : Land Value Zones Automation for Land Market Information (Case Study of Desa Nagrak Kecamatan Gunungputri Kabupaten Bogor)
Name : Vevin S. Ardiwijaya Student ID : G.051020081
Study Program : Master of Science in Information Technology for Natural Resources Management
Approved by, Advisory Board
Dr. Yuli Suharnoto Supervisor
Drs. J. P. Tamtomo, M.Eng Co-supervisor
Endorsed by,
Program Coordinator
Dr. Ir. Tania June, M.Sc
Dean of Graduate School
Prof. Dr. Ir. Khairil A. Notodiputro, MS
Date of examination: December 15, 2006
CURRICULUM VITAE
Vevin S. Ardiwijaya was born in Bandung, West Java, Indonesia at October 30, 1970. She received bachelor degree from Bandung Institute of Technology, Departement of Geodesy, in 1995. From the year of 1996 to 1998, she worked for Urban Land Information System
(SITP) Bappeda Kotamadya Semarang as Geographic Informat ion System Staff in PT. Sarkindo Mulia. Since 1998 to present, she works in
National Land Agency Republic of Indonesia (BPN-RI).
TABLE OF CONTENTS
Page
STATEMENT i
ACKNOWLEDGEMENT . ii
CURRICULUM VITAE iii
ABSTRACT .. iv
TABLE OF CONTENTS . . v
LIST OF TABLES . vii
LIST OF FIGURES . ... viii
LIST OF APPENDIXES ... ix
I. INTRODUCTION ... 1
1.1. Background ... 1
1.2. Scope of Research .. 4
1.3. The Objectives of Research ... 5
II. LITERATUR REVIEW 6
2.1. Land Value .. . .. 6
2.2. Principles of Land Valuation .. 8
2.2.1. Concept and Principles of Value .. 8
2.2.2. Principles of Valuation . 9
2.3. Principles for Land Value Zones . ... 11
2.4. Land Valuation by PBB and BPN .. 13
2.5. Geographic Information System 19
III. METHODOLOGY ... 22
3.1. Time and Location . 22
3.2. Data Sources . .. 23
3.3. Hardware and Software . . 23
3.4. Flow of Thought .. .. 23
3.4.1. Data Collection Method .. 25
IV. RESULT AND DISCUSSION . 30
4.1. Data Collection Method .. 31
4.1.1. Preparing Raster and Vector Data .. 31 4.1.2. Determine the Road and Drainage Area . 31 4.1.3. Determine the Road Type .. . 32 4.1.4. Determine the Road Centerline ... 33
4.2. Land Value Data Analysis .. 33
4.2.1. Land Value Zone ... .. 34
4.2.1.1. Land Value Zone by Automation . 34 4.2.1.2. Land Value Zone by INLA .. 35 4.2.1.3. Land Value Zone by PBB 36
4.2.2. Land Value .. 38
4.2.3. Transaction Value ... . 42
4.2.4. Properties . 44
4.3. Validation Process of Land Value Zones .. 46
4.4. Research Validation .. . 46
V. CONCLUSIONS AND RECOMMENDATIONS .. 50
5.1. Conclusions .. . 50
5.2. Recommendations .... . 50
REFERENCE . .. 52
LIST OF TABLES
No Caption Page
1. Spatial Data Requirement ... .. . 25
2. Land Value Zones Comparisons ... .... 37
LIST OF FIGURES
No Caption Page
1. Illustration of the parcels located in 2 or more value zones .. 18
2. Several Component Comprise a GIS .. 19
3. GIS Process . 20
4. Study Area 22
5. Flow of Thought ... .. 24
6. Unclean Block ... 27
7. Splitting Process .. 27
8. Clean Block . 27
9. Procedure of Land Zone Valuation... ... 29
10. Raster and Vector Data ... 30
11. The Road and Drainage Area .. 31
12. Overlay Parcel and Block ... 31
13. Clean Block .. 32
14. Road Centerline 33
15. Scheme of Data Analysis 34
16. Land Value Zone . 35
17. Value Zone Map by INLA Project . 35
18. ZNT Map from PBB ... 37
19. Properties .. .. 45
20. Block Pattern of Zone 1 .. 47
21. Block Pattern of Zone 2 .. 48
22. Block Pattern of Zone 3 .. 48
LIST OF APPENDIXES
No. Title of Appendix Page
1. The Procedure to Create Land Zone ... . ... 55
2. Model to Create Land Zone .. ... .. 59
3. Avenue Script for Automation Program . 64
4. Transaction Value Analysis . 69
I.
INTRODUCTION
1.1. Background
Characteristics of land in economic sense are defined as the entire material universe outside of people themselves and the products of people. It includes all natural resources, materials, airwaves, as well as the ground. All air, soil, minerals and water is included in the definition of land. Everything that is freely supplied by nature, and not made by man, is categorized as land [Gwartney, 1999].
Land holds a unique and pivotal position in social, political, environmental and economic theory. Land supports all life and stands at the center of human culture and institutions. All people, at all times, must make use of land. Land has no cost of production. It is nature's gift to mankind, which enables life to continue and prosper.
Land's uniqueness stems from its fixed supply and immobility. Land cannot be manufactured or reproduced. Land is required directly or indirectly in the production of all goods and services. Land is our most basic resource and the source of all wealth.
Regarding to the uniqueness, the land needs to be managed to get more value added. The land is natural resources that may be developed a potential resource for human prosperity.
are on regard with land acquisition for public use, BPN is currently authorized to conduct land valuation in connection with land acquisition. Prior to the enforcement of these regulations, BPN is active in work connected with expropriation in this regard. In general, the expropriation values are higher than taxation value (in Indonesia it is known as NJOP, an abbreviation of Nilai Jual Obyek Pajak) and reported prices. These values may also be higher than the market values.
With regard to determine NJOP, PBB has collected transaction values from previous year to assign land value zone. These zone are visualized in Zona Nilai Tanah Map (ZNT map), which is nearly similar to a sketch map. This map is produced through delineation of such zone manually, performed by the expert who subsequently provides NJOP for the following year.
Valuation by BPN in general is not yet applied, however there is a prototype produces by Indonesian Land Assessment Project (INLA Project). This method uses the analyzing market data and developing the valuation models. Valuation model consist ofvalue maps with value zones and tables or formulas for valuation of each property.
In Accordance to President Regulation No. 10/2006, there has been formed a new directorate related to the land valuation mandate by BPN. The directorate of Land Potency Survey has responsible for surveying, valuating, and managing the land potencies; there are the physical potencies and the economical values of land.
On the basis of the above mentioned facts, this research is intended to develop the determination of land value zones by applying new approach which results automatic land value zone map. It is then expected that this research provides a lot of benefits not only for BPN and PBB but also for other interested parties. This may be best pictured by the following cases:
b. Developers expand land for houses or apartment to increase functions of land by means of providing comprehensive facilities to improve such area, and also to get the benefit of such ownership;
c. Agro-businesses expand existing farm field to increase their production. d. Industrial sector plans to develop commercial or industrial zone, and are
willing to invest their financial capability to these potential location and reserves for the future.
e. Resources management peoples control land resources to obtain the optimal benefit and for sustainable use.
1.2. Scope of Research
Based on the backgrounds mentioned above, this research develops a method to determine land value zone that formerly has been initiated by INLA Project in another approach. By applying this method, the expected result is to produce automatic land value zone map, as well as to compare to the method applied by PBB.
1.3. The Objectives of Research
II.
LITERATURE REVIEW
2.1. Land Value
As articulated by Longley et al. [2001], there are three basic methods to assign a value of land. These methods also can be used to assign a value of properties:
a. Cost method
Cost method is based on replacement cost of the property and the value of the land. Assessor must examine data on construction costs and vacant land values.
b. Income method
The income method takes into consideration how much income a property would generate if it were rented. This requires details on current market rents, vacancy rates, operating expenses, taxes, insurances, maintenances and other costs.
c. Market method
The market method is the most popular, also in Indonesia. It compares the property to other recent sales that have a similar location, size, condition and quality.
the buffering road distance or the land zone valuation process according to the expertise experience, expertise knowledge and the expertise skill [Longley et al, 2001].
Value objects are mostly classified in accordance with the use for which it is established. The four main categories are residential objects, agricultural objects, commercial and industrial objects.
When considering whether a certain type of property should be part of the mass-valuation process, the cost for the appraisal should also be taken into account. The resources put to creating and maintaining separate models for properties that will not be taxed - or to do individual valuations - will to a large degree be wasted if it does not result in any revenue. Types of properties that should not be appraised are for instance:
a. public land (state land) such as parks, streets, roads, water areas; b. cultural and natural reserves;
c. forest land.
Valuation models should describe how the property market thinks and acts , where there are many transactions on the open market, the better chance to capture the market s sentiments. If not, do simulation market situations, i.e. what would a buyer of a certain type of property look for and what would be willing to pay considering what other alternatives.
criteria for selecting an object, and criteria is what should be captured in the valuation model for each type of property.
Different criteria for selecting property result in that land for industry is more attractive in some areas, while land for residential purpose in other areas. The influence of location is captured in value maps, with zones showing different market value levels. Each type of value object has a value map, and each zone on the value map is connected to a table, describing how the value for a specific value object or unit should be assessed. The value map, together with tables for all market levels, represents the valuation model for each type of value objects [INLA Project, 2003].
2.2. Principles of Land Valuation
2.2.1. Concept and Principles of Value
certain site compare to another site in the area. While principle balance is the factor or variable that influence to the land value when occur the changes to the elements that influence to the balance.
2.2.2. Principles of Valuation
Assessor identifies properties to give the value and determine the date valuation, the valuation objective, the valuation definition and its scope, and stated on valuation report. Next step is selection and analyze to the data comparator. Include in the valuation process is identification to all properties attribute, legal aspect, physical characteristic, and extent all the potency on the site [Hidayati et al, 2003].
Gwartney [1999] argued that the collected data should be verified with two different sources. Market data should be verified with a person directly involved in the transaction. For example, one party could be the selling agent representing the responsible for the sale. Another party could be the site user who agrees to the sale amount. Additional sources might be government land agents or officials who have first hand knowledge of the sale. Inaccuracies can also be brought to light by concerned citizens if the data is made available to the public.
Nevertheless, in Indonesia it is reality that terminology of valuation is connoted with several institutions attached with their respective interests. For instance, PBB relates to taxation, BPN terms valuation for expropriation, while banks define valuation in term of credits, etc.
these methods difficult. The NJOP for land decided by PBB are much lower than market values. In average these values are around 40 % of the market values [INLA, 2003].
PPAT are dealing with the transactions. The reported prices are registered. PPAT never examines the sales to find out if the reported prices are the real prices or not. It is not PPAT duty. In general reported prices are lower than market prices but sometimes higher than NJOP.
The banks do land valuation for credits. In so doing they use information from notaries and brokers. They also interview people living in the neighborhood of object for valuation. The banks also build their own databases but some of these databases have not been in digital form yet. The capacity of borrower is more important than valuation object. To value objects for credit with the amount of loan exceeds Rp. 2 billion some banks will use a private valuation company to do this activity.
Brokers and developers conduct land valuation for their own or on demand of customers. The broker in Depok profiles more as an investor and partly also as developer. As an actor in market these entities should have sound knowledge regarding market, and practically they did not use any specific methods other than knowledge of valuation. Developers usually calculate backwards to find out how much they can pay for the land. They start to calculate the receipts and costs for the whole project. Costs for the land will be a part of the total costs.
compensation. If there is agricultural land with perennial plants, agricultural office will account additional values of the trees or plants for compensation purposes.
In general for many centuries, the role of valuation has been an activity associated with government activity, especially in relation to taxation and property acquisition for public works.
With the industrial revolution and capitalism, the development of major urban areas and increasing demand for housing of workers streaming from the country-side to work in factories, it produced some new faces: industrialists and developers. The people needed financial assistance using land as collateral and the lenders needed advice about the value of that collateral. The valuation was born and it has continued up to the present to be an important part of the property finance business although it is rarely very noticeable to those outside the business area.
2.3. Principles for Land Value Zones
According to INLA Project report, the principles for land value zones are described as below. A land value zone is a geographic area where comparable parcel objects have approximately the same market value. The number of value levels sets the ambition of the valuation model, since each zone covers a range of values around a given norm object value. More levels give smaller ranges.
The total number of zones will of course be much higher than the number of value levels, since each market value level will be present in many urban areas, sometimes in several locations. The work is a kind of iterative work where there is a need of both knowledge of the market and values of land parcels but also use of reliable sales. It is easiest to start with large roads. The highest prices are found along roads with a lot of traffic or other places where there are a lot of people in movement for example around universities.
There are two different ways to work with the fact that different parcels have different land use in the work with zoning. The market behavior differs due to the type of property. Therefore it can be good to have different valuation zone systems. One possibility is to have valuation zones for agricultural, residential, commercial and industrial units respectively. This way to work with separate value maps for different kind of land use is useful if the planning regulations are strict. With strict planning regulations the permitted land use according to the City Plan is very important. It is also good with separate value maps for different land use if the values are not updated so often. If there is a system with only one land value map it is important that the land use planning has had influence of the zoning. There should also be possibilities to reduce the values for parcels where a change to a higher and better land use is not possible in the short run according to the planning.
2.4. Land Valuation by PBB and BPN
Land valuation by PBB based on Letter of Taxation General Directorate No SE-38/P.6/1001 on Manual of NJOP and No SE-06/P.6/1999 on Implementation of Value Zones (ZNT) and Average Indication Value (NIR) as the basis of NJOP. In general, taxation is calculated by NJOP. NJOP is calculated from ZNT and NIR, times area (meter square). The complicated process is ZNT and NIR determine process, when tax assessors have to consider various factors that influence the valuation, such as land class, market value relativity, area development, building, date of transaction, road wide, road access, facility, flood, plan land use, soil fertility and value class.
Since earlier, BPN is obliged to propose land values for two other purposes as well:
a. For establishing equitable compensation in cases of acquisition (expropriation).
b. For establishing the land price in connection with granting of State owned land.
In comparison regarding land valuation between PBB and BPN, it can be submitted that BPN is more independent in dealing with land which should take more part in the valuation. There is also a need to develop framework and valuation methods for compensation and other purposes.
According to articles 154-157 of the above-mentioned BPN regulation No 6/2001 the BPN is entitled to provide services in various land related fields including that of land valuation. The BPN makes use of land values in a number of different situations:
a. In order to propose land values for the purpose of taxation e.g. planning, land reform, land registration.
b. In order to propose a second or third opinion concerning land values whenever needed.
Since earlier, and based on other regulations, BPN is obliged to propose land values for two other purposes as well:
c. For establishing equitable compensation in cases of acquisition (expropriation).
d. For establishing the land price in connection with granting of State owned land.
According to INLA Project Report, a system for mass valuation of land consists of three main parts; a market data collection system, a valuation system and an assessment system.
The market data collection process has been described above. If there is a need of recurrent market valuation collection of market data is a continuous process.
The second process is the valuation process. At this stage, the researcher analyzes market data and develops the valuation models. If deal with the value factor location through zoning, then this part of the work also is included in the process. The result of the work is valuation models, value maps with value zones and tables or formulas for valuation of each property.
The third process is the assessment. During this process, the researcher collects data about characteristics which is included in the valuation model for all properties that are going to be valued. The valuation models applied to the properties with their characteristics or value factors will result in assessed values.
a. Market data collection
because people do not report the real transaction prices. The situation is similar for notary fees. It would be better to base fees to notaries on other parameter than reported price for example on assessed value multiplied with some factor or to have some kind of fixed fee per transaction. Similar calculation is also compatible for transfer tax. If people report the real transaction prices the tax rates could be decreased but the state and local authorities receive the same revenues from the taxes.
There will also be problems if carry through a fair valuation with market values for one region but not for others. The relation between the assessed values in the region and market values may be fair. But in comparison with the values in other regions will not be fair, especially not as long as the tax rates are the same.
To find information about real prices, interested parties have to use other sources than reported prices from PPAT. In urban areas this can be done through advertisements. PBB partly uses this way to work. In rural areas advertisements are not a common way. To get more information on real price, interview with buyers or people such as head of village in rural areas is more effective.
The quality of the collected market data is very important for the valuation. There is general rule "garbage in garbage out . If collected information about prices and characteristics for sold properties is not reachable, the result of the valuation will probably be the same.
b. Value zoning
values of land parcels but it also use reliable sales. It start with large roads. The highest prices are found along roads with a lot of traffic or other places where there are a lot of people in movement. For every value zone there shall be a set up of rules for the valuation of parcels belonging to that value zone. Firstly the norm value for the standard plot in Rupiah/m2.
The principle of value zoning: The influence of location is dealt with value zoning. Each value zone has a unique identity. Value of land zones determined by delineation the same market data. Therefore the value zone will be shown in the value maps.
c. Value for an individual parcel
The next process after value zoning is how to calculate value for an individual parcel. The other value factors shall be used. To set up valuation rules for a certain value zone in the study area is as the following:
Norm value 600.000 Rupiahs/m2 1) Road class 1,0 / 0,6 / 0,3 2) Land use 1,0 / 0,8 / 0,6 3) Infrastructure 1,0 / 0,8 / 0,6
To calculate the value for an individual parcel the formula will be the following: Value of the parcel = (Norm value) * Size * (Road class factor) * (Land use class
factor) * (Infrastructure class factor)
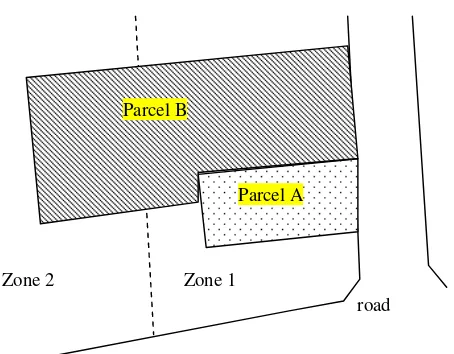
[image:30.611.227.454.73.250.2]
Figure 1. Illustration of the parcels located in two or more value zones
Value of the Parcel A = {(Norm value zone 1) * Size} * (Road class factor) * (Land use class factor) * (Infrastructure class factor) Value of the Parcel B = {(Norm value zone 1) * Size zone 1} + ((Norm value
zone 2) * Size zone 2}} * (Road class factor) * (Land use class factor) * (Infrastructure class factor)
Where: Parcel A in one value zone, Parcel B in two value zones
The result of INLA Project: The model does not focus on all value factors affecting market value. Some factors are not common way, or sometimes the value factor is of exceptional proportion, and is therefore excluded from the model. If this affects market value significantly, than there are possibilities to adjust the value derived from the model. For adjustments there is a need of manual work. This is costly and there can be rules for when adjustments shall be possible to carry through.
Zone 1 Zone 2
Parcel A Parcel B
2.5. Geographic Information System
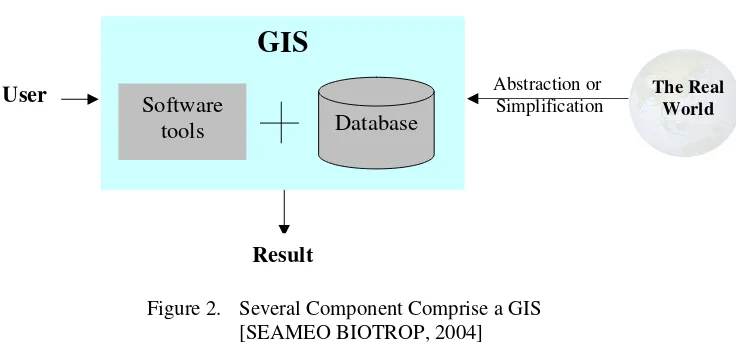
[image:31.611.136.504.287.459.2]Geographic Information System is a set of hardware, software, geographic data and people, designed efficiently for collecting, storing, updating, manipulating, analyzing, and presenting for all information geographic referenced [ESRI, 1995].
Geographic information System is a general purpose tool, contain several maps illustrating a few of the many GIS application.
Figure 2. Several Component Comprise a GIS [SEAMEO BIOTROP, 2004]
Geographic Information System is information system to manage data that has spatial information. In specific term, the GIS is computer system that has the ability to build, restore, manage, and to display the information based on geographically, such as the data that identified based on location in a database, the user who involves building and operating is part of this system. Basically the entry data process shown in the following figure: [SEAMEO BIOTROP, 2004].
Abstraction or Simplification
GIS
Software
tools Database
The Real World User
Figure 3. GIS Process [SEAMEO BIOTROP, 2004]
As articulated by Bruce [1996], spatial data as data that occupies cartographic (map able) space and that usually has specific location according to some geographic referencing system (e.g., Latitude-Longitude) or address. Spatial data are data defined by physical characteristics, usually including location or position. Spatial data may simply give an address (a specific location), or they can define size, such as a certain area of a forest (which is the same as defining the various positions of boundaries). The illustration shows a database containing addresses and a map (lower left) showing the area. Both the database and map represent spatial data.
[image:32.611.191.448.79.275.2]another address. The address doesn t change, but the attribute (owner) might. GIS data set usually contains spatial data and associated non-spatial data.
GIS data comes from a variety of sources: digitization of maps (electronic copying), tabular data such as census lists, remote sensing imagery, user input (typed-in data), existing reports (e.g., soil surveys), and digital products (e.g., digital line graphs sold in some countries). These diverse sets of data (upper illustration) are not naturally combined. It is difficult to hold up a satellite image, for instance, and compare it to a list of agricultural sites, they do not integrate easily.
All these data sets must go somewhere for GIS use, and that place is the database a program that stores and manages data. The database contains data and may point to other data sets, such as satellite imagery. A major strength of GIS is that it can accept and merge diverse data into a single database, giving the user a flexible and powerful set of data from which to work.
III.
METHODOLOGY
3.1. Time and Location
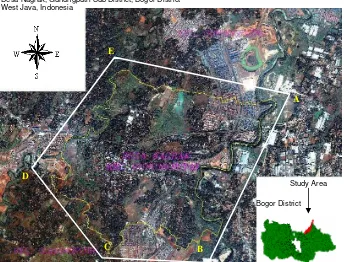
This study was conducted from January - September 2006, in Desa Nagrak, Gunungputri Sub District, Bogor District, West Java Indonesia. The coordinate location in TM-30 zone 48.2 datum WGS-84 is A (251,592.00 ; 781, 915.14), B (250,121.85 ; 792,001.88), C (248,331.51 ; 792,081.46), D (247,183.42 ; 793,519.41), E (248,581.59 ; 795,542.77).1 Data analysis was carried out at the MIT (Master of Science in Information Technology) Program, Bogor Agricultural University (IPB), SEAMEO-BIOTROP.
Figure 4. Study Area
(Source : Kantor Pertanahan Kab. Bogor, 2002)
1
The coordinate location in geographic coordinate datum WGS-84 is A (106059 49.9176 ;
Bogor District Study Area Desa Nagrak, Gunungputri Sub District, Bogor District
West Java, Indonesia
A
B C
D
[image:34.611.164.508.362.624.2]3.2. Data Sources
The data involve in the research including: a. IKONOS, data acquisition 2002
b. Parcel Measurement by BPN, data acquisition 1995-2006 and Parcel Sketch and ZNT map by PBB, data acquisition 2005-2006.
c. Analog Data PBB, including transaction value, data acquisition 2005-2006
3.3. Hardware and Software
In this study, it is needed the following supporting tools, in terms of hardware and software:
1. Hardware: PC Pentium-4, 1400 MHz, 256 MB RAM, CD ROM Read/Write Drive 48x24x52x; Canon Pixma iP 1000 Color Printer.
2. Software: ArcView 3.1; ArcGIS 9 Extension Spatial Analysis; Arc/Info 3.5; MS Office 2003; AutoCAD 2000; MapInfo Professional.
3.4. Flow of Thought
Start
Determine Block Area Determine Type of Road
Spatial Buffer Buffering Process
Data Collection Method
Data Analysis
Overlay Process
Valid?
Stop
N Y
Spatial Clean Block
Valid? Valid?
Split Process
N Y Y N
Map Land Zone Land Zone Valuation
Process Land Zone Data
3.4.1. Data Collection Method
a. Data Collection
The research starting with data collection method, as the following:
- For market data collection requirement, the research used the transaction value from PBB, the data collected from January to June 2006 in Desa Nagrak, 150 parcels.
- Digital data; including vector data and raster data. Data requirement for the research as the following: Table 1. Spatial Data Requirements
Layer Type Minimal tabular data
Source
Road centerline
line Id, Road type (primary, secondary, local or no access)
Digitizing and generalization
Road polygon Id, Name Digitizing and generalization River polygon Id, Name Digitizing and generalization Block polygon Id Digitizing and generalization
RR-Area line - The assumption of Road and
Drainage Area Parcel polygon Id, Transaction Value Field Measurements
b. Data Analysis : Land Value Zone Determination
The land value zones determination is based on the accessibility or the road access. They are:
The more explanation to determine the level of land zone and to classify the suitable road will be discussed in chapter 4.
c. Data Analysis : Norm Value of Land Zones
The approach of norm value of land zones utilizes the transaction value of PBB. In the future this approach must be corrected by the market value, with the objective is to get the fair norm value. The parcel value will be calculated by the norm value, the norm value is adjusted by the expert.
3.4.2. Value Zoning Automation
It is different with INLA Project, while the value zoning is done by delineating of market value which has the same classification value. The land value zone in this research by using approach based on the road classification (type of road). The more explanation about the concept design and its implementation in ArcView and the comparison with the ZNT map from PBB will be discussed in chapter 4.
The concept of the automation methodology can be explained as the following:
a. Splitting Process
The example of splitting process to make a polygon smaller, use the polygon split tool to simply split off the unnecessary part, select it, and delete it. 1. Overlaying the polygon of block and poly-line of fence.
2. The next process after overlaying polygon of block and poly-line of fence, then do the spliting process.
Figure 7. Splitting Process
3. Remove the small polygon area, and then another polygon is the Clean Block (polygon with land value).
Small area
Block
Clean Block
Fence
Block
b. Buffering Process
To create a buffer, specify the source feature and the buffer distance. For linear features, the GIS draw a line around the feature at the specified distance. To calculate value zone buffer around roads, specify a distance then GIS draw the buffer width. The specific distance for buffering is given by the expert. The approach distance uses the average wide of the land zone value (ZNT) of PBB, generate as the road centerline. It needs iterative process to get the fair distance. Further this approach needs to be re-adjusted by the expert to get the fair land value zone, but it is not include in the scope of this research.
c. Overlay Process
The utilization of this method is to find which features are inside which areas and summarize the zone values inside one or more areas.
a. Combining two spatial data layers and producing the land zone data from them.
b. Both layers are geo-referenced in the same system.
The input data for overlaying process is the result buffering zones combining with the clean block area, so produce the land zone in some locations that can be occupied, can be used, and can be sold.
3.4.3. Land Zone Valuation Process
one of them is the transaction value that consider to the description as the following statement:
According to Gwartney [1999], the data should be verified with two different sources, so it needs to be developed the procedure of land zone valuation, the flow of the procedure as in the following diagram:
There are 150 of transaction value data of Desa Nagrak from PBB, this data is used for the land zone valuation process. The result of the land zone valuation process is used as an approach of norm value land zone. The process of this
Data Collection Data Market
Verify Verify
- National Land Agency - Directorate for
Land and Building Tax
- Selling Agent - Site User - National Land
Agency
Data Transaction Value
Expert Opinion
Land Zone Valuation
IV.
RESULTS AND DISCUSSIONS
4.1. Data Collection Method
4.1.1. Preparing Raster and Vector Data
Based on raster data (IKONOS) used in the research, it can be determining certain study area of the research. The method to determine scope of research area is using the GPS equipment to get the accurate data (rectified image map). The research used raster data to produce vector data by digitizing on screen method. The raster and vector data as the following:
Figure 10. Raster and Vector Data
(Source : Kantor Pertanahan Kab. Bogor, 2002)
4.1.2. Determine the Road and Drainage Area
result of field measurement used for determining the road and drainage area or to describe the land zone.
Figure 11. The Road and Drainage Area
The assumption of the road and drainage area on the block overlay on the parcel, it is from the field measurement. So the road and drainage area produced from the parcel, further it will be used to get the clean block area.
Figure 13. Clean Block
4.1.3. Determine the Road Type
The road type information was taken from the field survey and taken from the satellite data (IKONOS). From the satellite data, the route of the road in the study area was identified, and it was digitized on screen to produce the new data (road type). In determining the type of the road in Desa Nagrak is not refers to the role of road classification, because the size of study area is small. The process to identify the road type in this research as the following:
a. Primary road is kind of first alternative road route; it is Jakarta-Cianjur-Bandung, this route constructs of blacktop and it has 4 lines and the traffic jam for 24 hours. This route categorized as primary road access (type-1). b. Secondary road is kind of road route, it categorized as secondary road access
(type-2).
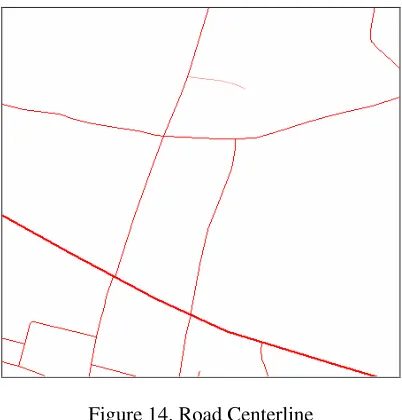
4.1.4. Determine the Road Centerline
[image:45.611.219.420.186.396.2]The road centerline was determined from the road type data. This process based on the information taken from the field survey and it was verified on satellite data (IKONOS). The model of road centerline as the following:
Figure 14. Road Centerline
The road centerline is generalization from the road double line, in this research the generalization needs editing process to get the best data of the desire centerline. The reason that this research using the centerline or not uses the double line is because the information from satellite data may be covered by some objects for instance the trees, buildings, clouds, etc.
4.2. Land Value Data Analysis
format. Non-spatial data is the data regarding to the secondary information, it is represented by tabular data.
Figure 15. Scheme of Land Value Data Analysis
4.2.1. Land Value Zone
4.2.1.1. Land Value Zone by Automation
The land value zone is based on type of the road and also based on the land classification such as agricultural (wet land, dry land, plantation), residential (land for family houses, land for apartments, land for combined use residential).
The land value zone process can be based on the layer of land use, parcel, building, etc. Through this process the expert easier to classify the land zone based on agriculture, residential and easy to fill the norm value on digital land zone map.
This figure is result of land value zone automation, every unique land value zone assigned by norm value. The norm value used in this model is the approach of transaction value.
Non-Spatial
Data
Spatial
1. Land Value
2. Transaction Value
3. Properties/Asset
Figure 16. Land Value Zone
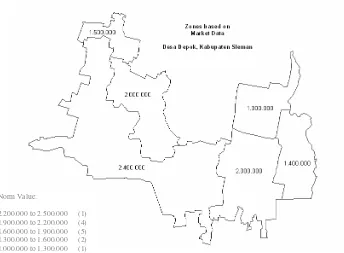
4.2.1.2. Land Value Zone by INLA
The process is a kind of iterative work where need of both of market knowledge and land parcels values, but also use of reliable sales. It is easiest to start with large roads. The highest prices are found along roads with a lot of traffic or other places where there are a lot of people in movement. Land zones determined by delineation the same market data.
[image:48.611.157.501.78.331.2]
..
Figure 17. Value Zone Map by INLA Project
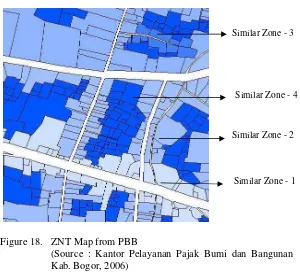
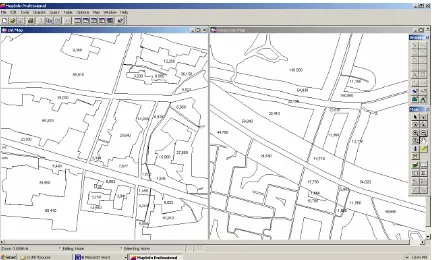
4.2.1.3. Land Value Zone by PBB
Figure 18 is the land value zone from PBB which has the same estimation location (similar) with figure 17 and it is the sketch of map ZNT, it delineated manually by the expert. The expert also determines the process of NJOP and taxation value.
Norm Value:
Figure 18. ZNT Map from PBB
(Source : Kantor Pelayanan Pajak Bumi dan Bangunan Kab. Bogor, 2006)
Zone 4 in figure 16 and 18 is the zone that has no access infrastructure, so in the land zone classification it is categorized as the lowest level zone.
[image:49.611.213.513.72.349.2]The comparison land value zone between Taxation General Directorate for Land and Building Tax (PBB) and Land Value Zone by Automation:
Table 2. Land Value Zones Comparison
Land Value Zone by Automation Land Value Zone by PBB
No Description No Description
1 Limited variable 1 Complex variable
2 Computerization 2 Manually
3 Simple process 3 Complicated process 4 Fast and inexpensive 4 Slow and expensive 5 The value based on the objective
data (spatial, non-spatial and the spatial analysis), and minimum influenced by the expert opinion.
5 The value based on the expert opinion and it is very dominant from the begining until the end of the process.
6 Not yet applied 6 Already applied for the taxation
Similar Zone - 1 Similar Zone - 2
4.2.2. Land Value
According to Gwarney [1999], Hidayati [2003], and some internet cited, the assessment or appraisal process is an organized procedural analysis of data. This procedure involves eight specific phases, each of which contains numerous procedures as below:
a. Defining the Assignment
The goal is to estimate the market value of the study area within a given district. This will include manufacturing enterprises, apartments, commercial enterprises, single family home sites, government land, farms and all other land and natural resources of various descriptions. The assessor should be able to support his estimate of land market. The assessor must define and use specific terminology suitable and pertinent to land appraisal.
b. Determining the Data Required and Its Source
A land market assessment system is based upon data related to land attributes. These data generally include maps; aerial photographs; descriptions of physical characteristics like size, shape, view and topography; permitted uses; economic usefulness; present uses; available utilities; proximity to town centers or employment; and site improvements like streets, curbs, gutters, sidewalks and street lights. Governments have much of this data available in the different agencies.
c. Collecting and Recording the Data
upon and improve these systems and 4) how to implement procedures for collecting additional data to improve the estimates of land values.
If no effective land revenue systems are in place they can be created in a manner similar to the following. Assessors should ascertain what land data presently exists and how it could be assembled for use in a land valuation system. They should collect and maintain the data needed from any existing records even though it is not currently stored in a single source. They should determine what additional data would be valuable and from what sources it can be obtained. They should develop procedures for collecting any additional data required to determine land market values and the data should be collected for the differences in characteristics for each site.
The data should be displayed in a useful manner such as on a land market value map or a computer printout. In an area with no systems or data in place, simple relationships could be drawn for permitted use (zone), distance to amenities (location), physical characteristics (size, topography, view, and so on) and other significant factors. Data could be collected and analyzed on a neighborhood and type of potential use basis.
Even if no land sales or market evidence exists, the specific factors which influence land market value are well understood by most people in study area, even in primitive cultures. The assessor's job is one of skillfully determining the relative priorities identified by local people.
A sample of typical and varied land sites within a city could be selected to demonstrate a land valuation system. Based upon a study, land market values could be assigned by a competent assessor. The assessor could use a few people trained to collect and analyze existing data, then analyze the sample survey data and set standards for the base market values in the study area. The difference in market value of the attributes that enhance or detract from a typical site could be added or subtracted to the base market value for the other sites in the study. These features should be recorded on the land market map, which would show the primary sites with markets declining as desirability decreases or increasing as desirability increases.
Several examples of land assessment systems will be discussed in this paper, from a simple example with no significant land data, to a more complex example with plentiful land data. The methods employed will depend upon the land market data that currently exists and how that data can be assembled for use in a land assessment system.
d. Verifying the Data
representing the responsible for the sale. Another party could be the site user who agrees to the sale amount. Additional sources might be government land agents or officials who have first hand knowledge of the sale. Inaccuracies can also be brought to light by concerned citizens if the data is made available to the public.
e. Analyzing and Interpreting the Data
The balance of this report will be concentrated on various methods of analyzing and interpreting land market data. Several methods will be suggested to secure the goal of estimating the market value of study area sites.
f. Estimating the Market Values
Once the analysis has been concluded, it will be possible for the assessor to make a rational estimate of the market value of study area site. This estimate will serve as the basis for the value that will be paid by a site user for the exclusive use of a location (site). The assessor would assign preliminary land value estimates based upon the comparative estimated usefulness and desirability of the sites. Initially, they could accomplish this task in a general manner, with the understanding that refinements would be made to reflect new information and public opinion.
g. Public Examination and Analysis of the Land Market Values
Once an adequate sample survey has been completed and had favorable public review, the result can be used throughout the total area. These sample data results could be used to estimate the comparative markets of each land site. To ensure the optimal and equitable use of land sites, land assessments should reflect the attitudes of the individuals who can make the highest and best use of the site, who would be willing to pay more than individuals with inferior uses in mind. Neither requiring nor willing to pay the land taxes for a superior site will use another site that match the needs, desire and budget, thus making it available for others who can pay for the better site.
h. Periodic Updating of Assessments
Land market values tend to increase each year at a rate usually greater than inflation. Building values tend to decline each year, because of a wearing out of the physical structure or its functional desirability. If assessments are not maintained on a regular basis (annually) land will become greatly under-assessed and buildings will be over-assessed in only a few years.
4.2.3. Transaction Value
Table 3. Transaction Value from PBB
TRANSACTION VALUE LAND SIZE NJOP of LAND BUILDING SIZE NJOP of BUILDING
NJOP STATISTICS
27,100,000 60 243,000 21 595,000 27,075,000 Greater than
139,691,000 128 802,000 45 823,000 139,691,000 Equal
299,260,000 250 802,000 120 823,000 299,260,000 Equal
299,260,000 250 802,000 120 823,000 299,260,000 Equal
121,245,000 105 802,000 45 823,000 121,245,000 Equal
141,484,000 121 802,000 54 823,000 141,484,000 Equal
288,480,000 180 916,000 103 1,200,000 288,480,000 Equal
30,900,000 300 103,000 - - 30,900,000 Equal
188,500,000 250 394,000 - - 98,500,000 Greater then
251,405,350 63 1,416,000 128 2,200,000 370,808,000 Less than
206,125,000 50 1,032,000 100 1,200,000 171,600,000 Greater then
239,000,000 144 1,032,000 76 1,200,000 239,808,000 Less than
239,808,000 144 1,032,000 76 1,200,000 239,808,000 Equal
(150 records)
Statistics:
Greater than 45 30%
Equal 69 47%
Less Than 35 23%
Total 149 100%
the transaction value not yet include of the other value of properties like building, plantation, the ownership, etc. Another perception, this is indicate that there is political strategy to decrease the value of the object in order to get low tax price and there is the ability to pay.
NJOP of Land in Table 3 describes as the data reference for the expert to appraise the norm value of the land zone. Based on the statistic analysis above not each NJOP of the land can be used, it is only equal and less then value can directly used. For the statistic analysis that has the greater than value, it has to be more analyzed, for instance it is only for the data that has the different not more then 10% can be used.
4.2.4. Properties
After analyzing process of transaction value from PBB, it can be concluded that the transaction value is the value for property. It stated in table 3, the value stated not only the land value. The following is the explanation of property:
Figure 19. Properties
Property as a medium for investment differs considerably in its qualities and characteristics compared with the other investment outlets previously mentioned. It is naturally limited in supply and it would be extremely difficult and expensive to create additional land to meet expanding requirements. No two pieces of land are exactly alike in every respect. The land will differ in size, topography, locality and condition. Property will not be available in regular units for investment as are stocks and share.
The data including in property subject are:
a. Site; wide and size, shape, contour, soil type, elevation, zoning, etc. b. Building:
- Main building; wide and size, design, layout, construction, material, roof, ceiling, floor, wall, etc.
4.3. Validation Process of Land Value Zones
Validation process is executed by assessor. The validation process performs in some processes of the automation land zone value; they are in stage buffering process, splitting, and land zone valuation process. In the buffering process, the validation is to do re-adjustment for the buffer distance. In the splitting process, the validation is to do the verification for the real block boundary. In the land zone valuation process, the validation is to do re-adjustment for the norm value. These all processes necessary to do to get the fair land value.
The objective of this process is to do the validation of the unique land zone valuation as the goal of the research. The land zone valuation is based on characteristic condition and location of the study area. Land zone characteristic were very influences significantly to the land valuation, and its very dependency to the expert opinion. In this part, the experts do the validation process to determine every block of the unique land zone.
The land value is very dynamic, it is fluctuation and it is depends on the function of the land, regulation, inflation, etc. Only the expert can determine the fluctuation of land value. The research acceptability shows the similarity graphic pattern, it means that the research is valid.
4.4. Research Validation
a. The category of road type in the study area must indicate the standard of road type, for instance standard from Department Kimpraswil.
b. The ideal land zone valuation taken from 2 sources (in chapter 3.4.3 Land Zone Valuation Process). In this research the land zone valuation taken from transaction value of PBB only.
c. The more accurate link between the BPN parcels with the parcels sketch of PBB will be very helpful for approach of the norm value land zone. The fact prove after testing 150 data transaction value it is only 22 can be identified in BPN parcels.
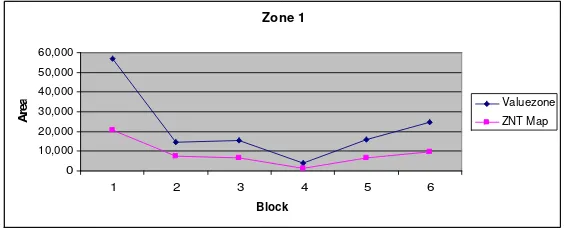
The final product of this research is the automation digital data of the land value zone (figure 16), where the buffer of the road type-1 is 100 meters, type-2 is 50 meters, and type-3 is 50 meters. The research analysis shows the result of the automation has the similarity pattern with ZNT sketch map of PBB in figure 17, with the graphic patterns as the following:
Zone 1
0 10,000 20,000 30,000 40,000 50,000 60,000
1 2 3 4 5 6
Block
A
r
e
a Valuezone
ZNT Map
[image:59.611.178.462.471.585.2]Zone 2 0 20,000 40,000 60,000 80,000 100,000
1 2 3 4 5 6
[image:60.611.179.461.82.207.2]Block A r e a Valuezone ZNT Map
Figure 21. Block Pattern of Zone 2
Zone 3 Valuezone ZNT Map 0 2,000 4,000 6,000 8,000 10,000 12,000 Block A re a
Figure 22. Block Pattern of Zone 3
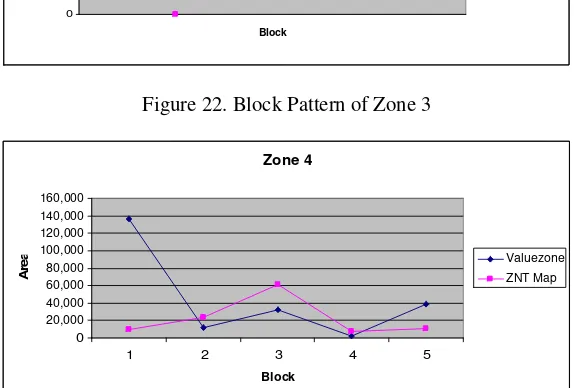
Zone 4 0 20,000 40,000 60,000 80,000 100,000 120,000 140,000 160,000
1 2 3 4 5
Block A r e a Valuezone ZNT Map
Figure 23. Block Pattern of Zone 4
The graphic patterns in figure 20 to figure 23 give the information as the following statements:
[image:60.611.176.463.354.548.2]c. Buffer distance in zone 3 moreover than ZNT PBB d. Zone 4 less over than ZNT PBB
V.
CONCLUSIONS AND RECOMMENDATIONS
5.1. Conclusions
This research is a comparative study between Land Value Zone Automation, INLA Project, and land zone value map from PBB. The following conclusions can be drawn from this research:
1. Land value zone can be determined automatically in type of road approach using GIS Technology. In this research, the values of land zone are determined by type of road and its transaction value. Based on the pattern of shape and location, the result of the land value zone automation has the similarity with the land value zone (ZNT) from PBB.
2. Based on the research findings, the identified benefits of this research are: (a) Land Value Zones Automation may simplify land valuation process because of the use computerization with limited variables; (b) Land Value Zones Automation reduces expert (human) influences; (c) Because of computerization and minimum expert influences, the automation could be speed up and inexpensive.
5.2. Recommendations
After conducting the research and performing the land value zone process, it can be stated as the following recommendations:
2. Because of the Land Value Zone by PBB and INLA Project have been implemented, but they are not as the expectation, so the Land Value Zone Automation is suggested as the new method to be implemented in BPN. It can be used by BPN as an alternative to determine the land value zone for the location.
3. Method of this research should be modified, if it will be implemented in another location or the large scale location.
4. For the location that has very large block, for instance villages, agricultural, plantation, and forest, it is possible to be applied by using double buffer method in determining the land value zone.
5. For another location the research should consider the location that has the similarity characteristic with the road and drainage area, for instance the pipeline of gas, the high voltage of power line, the conservation area, etc. 6. It needs the link between BPN and PBB to get the accurate data parcel
and sketch.
REFERENCES
Arsyad, Sitanala. 2000. Konservasi tanah dan air. IPB PRESS. Bogor, p. 32, 36, 44-59.
Badan Pertanahan Nasional Republik Indonesia, 2006, Peraturan Kepala Badan Pertanahan Nasional No 3/2006 Tentang Organisasi Dan Tata Kerja Badan Pertanahan Nasional Republik Indonesia. Badan Pertanahan Nasional, Jakarta.
, 2006, Peraturan Kepala Badan Pertanahan Nasional No 4/2006 Tentang Organisasi Dan Tata Kerja Kantor Wilayah Badan Pertanahan Nasional Dan Kantor Pertanahan. Badan Pertanahan Nasional, Jakarta.
Davis, Bruce E. 1996, GIS, A Visual Approach, OnWord Press, 2530 Camino Entrada Santa Fe, NM 87505-4835 USA.
Dirjen Pajak, 1991, Surat Edaran Direktur Jenderal Pajak No: SE-38/PJ.6/1991, 29 April 1991 tentang Tata Cara Penyusunan Klasifikasi NJOP atas Bumi/Tanah. Direktorat Jenderal Pajak, Jakarta
, 1993, Surat Edaran Direktur Jenderal Pajak No; SE-38/PJ.6/1993, 30 Juni 1993 tentang Petunjuk Teknis Pengukuran dan Identifikasi Objek Pajak Bumi dan Bangunan, Direktorat Jenderal Pajak, Jakarta.
, 1998, Keputusan Direktur Jenderal Pajak No: KEP-16/PJ.6/1998, 30 Desember 1998 tentang Pengenaan Pajak Bumi dan Bangunan, Direktorat Jenderal Pajak, Direktorat PBB dan BPHTB, Jakarta.
, 1999, Surat Edaran Direktur Jenderal Pajak No: SE-06/PJ.6/1999, 5 Pebruari 1999 tentang Pelaksanaan Analisa Penentuan Zona Nilai Tanah (ZNT) dan Nilai Indikasi Rata-rata (NIR) Sebagai Dasar Penentuan NJOP Tanah. Direktorat Jenderal Pajak, Jakarta.
ESRI. 1995, Understanding GIS The ARC/INFO Method, John Wiley and Sons Inc, New York, USA.
Establishing the Value of Land - [cited 2006 June 23]; Available from: http://www.agr.gov.sk.ca/
Gwarney, T, 1999, Estimating Land Values. [cited 2006 June 23]; Available from: http://www.henrygeorge.orgted.htm.htm/
Hidayati, W, Harjanto, B. 2003. Konsep-konsep Penilaian Property First Edition. BPFE-Yogyakarta, Yogyakarrta.
Indonesian Land Assessment Project, 2003, Land Valuation Methodology. National Land Agency Republic of Indonesia, Jakarta.
Presiden Republik Indonesia, 2006, Peraturan Presiden Nomor 10/2006 tentang Badan Pertanahan Nasional. Sekretariat Negara, Jakarta. Land & Property - [cited 2006 June 23]; Available from:
http://www.lands.nsw.gov.au/Department of Lands - NSW Land Values.htm
Land Valuing Problems - [cited 2006 June 23]; Available from: http://www.henrygeorge.org/
Longley, P.A., Goodchild, M.F., Maguire, D.J., Rhind, D.W. 2001. Geographic Information System and Science. John Wiley & Sons, LTD., Buffins Lane, Chichester, West Sussex PO19 1UD, England.
Ruslan, 2003, Pemanfaatan Data Citra satelit IKONOS untuk Penentuan Jenis Penggunaan Bangunan dan Luas Objek PBB, Thesis, Program Pasca Sarjana UGM, Yogyakarta.
Richmond, David. 1994, Introduction to Valuation, Third Edition. Macmillan Press LTD, Houndmills, Basingstoke, Hampshire RG21 2XS.
Sanjoto, Fadjar, 2003, Pengukuran Luas Bidang Tanah pada Citra Ikonos (Studi Kasus di Wilayah Kerja Kantor Pelayanan Pajak Bumi dan Bangunan Jakarta Selatan II), Thesis S-2 UGM, Yogyakarta. SEAMEO BIOTROP, 2004, GIS Basic Training. SEAMEO BIOTROP,
APPENDIX 1
The Procedure to Create Land Zone
1. Display the Layer Road Centerline base on type of road:
2. Buffer for all the road type. Buffer distance determine by assessor/expert. The result will be layer Buff1 of type 1, layer Buff2 of type 2 and layer Buff3 of type 3.
Buff1 Buff2 Buff3
(100 m) (50 m) (50 m)
3. Union for Buff1, Buff2 and Buff3 by the following steps :
4. Perform dissolve process based on Bufferdis data in table Union12, the result:
5. Perform union process for Union12 and Buff3, next fill table Id for type of road, the result will be layer Union123, the feature and table:
7. To get the land value zone in Blocks, the process as the following: Perform Intersect process of layer Block-rr and Union123:
+ =
Block-rr Union123 Intsct1
This process gives Voluezone 1, 2 and 3. While Valuezone 4 (no access) produced by the following technique:
APPENDIX 2
Model to Create Land Zone
This model is the implementation of procedure in Appendix 1, by using ArcGIS 9 extension Spatial Analyst 9.1.
The following figure is Sub Model 1, 2 and 3. It is created in one model and will be executed sequentially.
Sub Model 1:
Sub Model 3:
APPENDIX 3
Avenue Script for Automation Program
1. Script for Project
av.ClearGlobals
'____Declare to global variable for future use with compile script _sisco = 0 'TM-3 default
_Field_get = nil _Field_cek = nil _Info = nil _fr_view = nil _daftar = nil _edit_Vtab = nil _drive = nil _dprog = nil
_proj = av.GetProject _accept = false
_proj.SetSelColor (Color.GetYellow ) _listtitik = {}
_vc = "" _siso = ""
'--- Read Direktory Default av.run("Seting.DirDefault",nil)
diDat = File.Exists((_drive+"setup.ini").asfilename) diPro = File.Exists((_dprog+"zonanilai.apr").asfilename)
If ( Not(diPro) OR Not(diDat) ) then
Msgbox.Info("Seting direktori program tidak ada...!!!"+NL+"Set direktori program anda","Periksa Program")
_proj.Finddialog("Dialog_Setting_Directory").Open End
'--Set Working Directory if (_drive <> nil ) then
_proj.SetWorkDir (_drive.AsFileName) end
'--Setting System Look of Aplication
System.SetLook (#SYSTEM_LOOK_MSW95)
' --- General Setting Windows Aplications av.Maximize
a = av.ReturnExtent av.moveto(0,0)
_Lebar = a.GetX - 6 _Tinggi = a.GetY - 3
av.SetName ("Aplikasi Zona Nilai Tanah")
' theGUI = "Project.Awal"
' if ( _Proj.FindGUI (theGUI) <> nil ) then ' _proj.SetGUI( theGUI )
' av.FindGUI(_proj.GetGUI).Activate ' else
' _proj.SetGUI( "Project" )
'
![Figure 3. GIS Process [SEAMEO BIOTROP, 2004]](https://thumb-ap.123doks.com/thumbv2/123dok/375620.319574/32.611.191.448.79.275/figure-gis-process-seameo-biotrop.webp)