DESIGN FOR SUSTAINABLE MANAGEMENT OF SEAGRASS
ECOSYSTEMS FOR SUPPORTING FISHERIES IN SPERMONDE
ARCHIPELAGO, SOUTH SULAWESI
NADIARTI
SCHOOL OF GRADUATE STUDIES BOGOR AGRICULTURAL UNIVERSITY
DECLARATION OF DISSERTATION AND
SOURCE OF INFORMATION
Here I declare that a dissertation entitled “Design for Sustainable Management of Seagrass Ecosystems for Supporting Fisheries in the Spermonde Archipelago, South Sulawesi” is true as a work of mine under direction of supervisor team and it has not been submitted in any form to any university or higher education institute. Any information source or citation from any published or unpublished works from other authors have been stated in the text and included within References List at the end part of this dissertation.
Bogor, January 2012
Nadiarti
ABSTRAK
NADIARTI. Rancangan Pengelolaan Ekosistem Lamun Berkelanjutan untuk Mendukung Perikanan di Kepulauan Spermonde, Sulawesi Selatan. Dibimibing oleh ETTY RIANI, ITA DJUWITA, SUGENG BUDIHARSONO, and ARI PURBAYANTO.
Tujuan utama penelitian ini adalah untuk merancang strategi pengelolaan ekosistem lamun yang berkelanjutan di Pulau Barrang Lompo (BL) dan Kapoposang (KP) untuk mendukung perikanan. Sub tujuan adalah untuk 1). Menganalisis struktur komunitas ikan di padang lamun yang didominasi oleh
Thalassia hemprichii (TH) dan Enhalus acoroides (EA), 2). Menganalisis aktivitas penangkapan di padang lamun Pulau Barrang Lompo (BL) dan Kapoposang (KP) dan statusnya, 3). Merancang srategi pengelolaan ekosistem lamun berkelanjutan di BL dan KP. Struktur komunitas ikan dianalisis menggunakan teknik non-metric multidimensional scaling and analisis kelompok Bray-Curtis, spesies ikan yang paling berkontribusi terhadap perbedaan struktur komunitas dianalisis menggunakan prosedur SIMPER (similarity of percentages) menggunakan perangkat lunak PRIMER v6. Aktivitas penangkapan dianalisis melalui hasil observasi perilaku nelayan selama penangkapan di padang lamun, status penangkapan ditentukan berdasarkan skala status menyerupai skala FAO dan dianalisis melalui pengukuran tangkapan per unit upaya (CPUE), tangkapan total dalam satu tahun (Y), mortalitas alami dalam bentuk mortalitas berbasis bobot (Mw), estimasi biomassa pada tahun yang sama (B), dan hasil tangkapan maksimum lestari (MSY). Analisis RAPSECS (rapid appraisal technique for evaluating seagrass ecosystems sustainability) menggunakan multidimensional scaling (MDS) diaplikasikan untuk menganalisis status keberlanjutan ekosistem lamun untuk setiap dimensi (ekologi, ekonomi, sosial, teknologi, institusi). Gabungan metode perbandingan berpasangan dengan geomean digunakan untuk menentukan status keberlanjutan umum dari ekosistem lamun. Analisis leverage
digunakan untuk menemukan atribut yang paling berpengaruh terhadap status keberlanjutan setiap dimensi. Hasil penelitian menunjukkan bahwa secara umum struktur komunitas dan pola distribusi ikan pada kedua padang lamun TH dan EA ditemukan berbeda. Penangkapan ikan di padang lamun (baik BL ataupun KP) bukan merupakan pekerjaan utama dan hanya nelayan tertentu yang melakukan penangkapan. CPUE total maupun laju eksploitasi ikan lamun antara BL dan KP adalah relatif sama, dan status penangkapan mereka masih dalam kategori under-exploitation. Secara umum, prioritas strategi pengelolaan ekosistem lamun di BL meliputi penguatan kelembagaan, pengembangan sumberdaya manusia, dan perbaikan lingkungan, sementara di KP meliputi penguatan kelembagaan dan pengembangan sumberdaya manusia.
SUMMARY
NADIARTI. Design for Sustainable Management of Seagrass Ecosystems for Supporting Fisheries in the Spermonde Archipelago, South Sulawesi. Supervised by ETTY RIANI, ITA DJUWITA, SUGENG BUDIHARSONO, and ARI PURBAYANTO.
Seagrasses have been well known as important habitat for various fauna, including numbers of economic important fishes, especially in the nursery stage. Therefore, seagrass ecosystems management is an important part of managing the marine fisheries. Spermonde Archipelago, a hotspot of coral and seagrass, consist of ± 120 small islands and have dense population (most of them depends on subsistence and small scale fisheries), especially in the south east of the archipelago implements an increased pressure to the seagrass ecosystems. The pressure to the ecosystems will affect the fisheries productivity. By knowing the sustainability status of the seagrass ecosystems, it will facilitate an assessment of the effectiveness of fisheries management and it will provide a valuable information to policy makers about the best policy option for the sustainability management of seagrass ecosystems in the future. Based on that, the main goal of this study was to determine the sustainability status of seagrass ecosystems in Barrang Lompo Island (BL) and Kapoposang Island (KP) for supporting fisheries. In order to achieve the main goal, there are three specific objectives were performed, namely 1). to analyze fish community structure in the seagrass beds, 2). to analyze the fishing activities and their status in the seagrass beds, 3). to design the sustainable management of seagrass ecosystems. Fish community structure was analyzed using non-metric multidimensional scaling technique and Bray-Curtis cluster analysis, while the most contributed species to difference of fish community structure was analyzed using SIMPER (similarity of percentages) procedure. All statistics analysis were carried out using PRIMER v6 software. The difference between fish distribution in both seagrass beds was analyzed with t-test and Bonferroni post-test using PRISM v5 software.
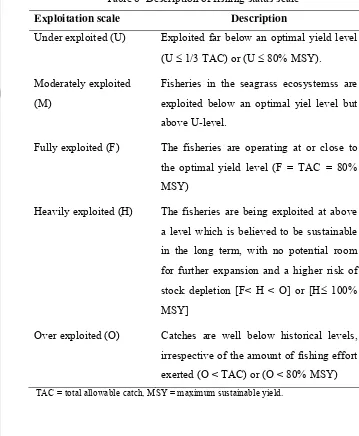
Fishing activities were analyzed through fisher recognition based on the latest census data from village office and by interviews, observation of fisher’s behaviour during fishing in the seagrass beds, classification of their catches, analysis of maturity size of their catches based on life stage classification using fish maximum length. Status of fishing in the seagrass beds were determined based on FAO-like exploitation status scale and analyzed through measurement of catch per unit effort (CPUE), total catch in one year (Y), natural mortality as weight-dependence of mortality (Mw), estimated biomass in the same year (B), and maximum sustainable yield (MSY).
of each seagrass fisheries. Leverage analysis was applied to identify the most influence attributes to the sustainability status of each dimension. Strategy intervention was formulated based on the most influence attributes within each dimension.
The results of non-metric multidimensional scaling technique and Bray-Curtis cluster analysis revealed that overall, there were significant differences of fish community structure and distribution pattern in the seagrass beds dominated by Thalassia hemprichii (TH)and Enhalus acoroides (EA). Fish abundance was higher in TH- than in EA-dominated beds, but fish biomass and species richness were lower in TH- than in EA-dominated bed, indicating that there were more smaller fish assemblage in TH site than in EA site, while larger sizes and more variety of fish species utilize EA site. The major contributor fish species to the difference of fish community structure between these two seagrass beds were
Apogon bandanensis, Lethrinus harak, A. hoeveni, Liza vaigiensis for fish abundance, and Tylosurus crocodilus, Siganus canaliculatus, A. bandanensis for fish biomass dry weight.
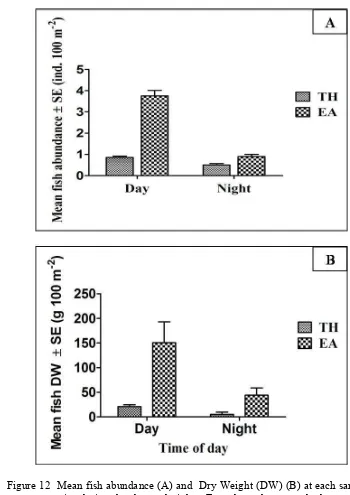
More abundance larger fish was found during day time than night time in EA-dominated bed. It indicates that EA site may facilitate foraging efficiency of larger fish during day time because more abundant and higher biomass dry weight (DW) of fishes were found in EA site during day time compare with night time. The higher canopy provided by the seagrass E. acoroides in EA site may also improve the predation efficiency and so that beneficial for some fishes, especially predators, such as Choerodon anchorago, Dyodon histrix, and Saurida gracilis.
Abundance and biomass of fish juvenile and adults were comparable in the two seagrasss beds. Meanwhile, abundance of fish subadults was higher in T. hemprichii- than in E. acoroides-dominated beds and vice versa for the subadults biomass. The higher occurrence of juvenile fish than adults in the seagrass beds either dominated by TH or EA indicated that seagrass is an important nursery habitat for various fish spesies.
Small fish (0-7.5 cm) more abundance in TH-dominated bed, while more larger fish sizes were found inEA-dominated bed indicating that fish assemblage in the seagass bed dominated by TH was majority small fish (juvenile and/or small, inconspicuous adult fish), however in the seagrass bed dominated by EA harbored larger fishes. The reason is because EA sites, provide higher canopy height and facilitating the improvement of predation efficiency for some larger predators, such as Choerodon anchorago, Dyodon histrix, and Saurida gracilis. Meanwhile, smaller fish (including juvenile and small inconspicuous adult fish) preferred TH site as this site provide lower canopy heights that is not beneficial for predators.
internationally to be conserved. Total CPUE of seagrass fish in BL was lower than in KP, however, the fishing rate of seagrass fish in both islands were relatively the same and categorized as under exploitation.
Multidimensional evaluation results revealed that generally, seagrass fishery of Kapoposang Island is better than of Barrang Lompo Island, mainly on ecological and technological dimensions. “seagrass percent cover”, “catch before maturity”, “limited entry”, “price”, “education level”, environmental knowledge”, “selectivity gear”, “fishing practice”, “education & training”, and “seagrass protection” are the most influence attributes found in both seagrass fisheries.
Overall, it was concluded that prioritized strategies for seagrass ecosystems management include institution strengthening, human resource development, and environmental improvement (for BL) and institution strengthening and human resource development (for KP). The recommendations are fishing status in BL and KP should be maintained to the level under-exploitation through strict control and monitoring by fisheries authorization. Additionally, mitigation effort on seagrass beds in the Spermonde Archipelago is important to be made in order to maintain the sustainable function of the seagrass beds, especially in fisheries sectors.
© Hak Cipta milik Institut Pertanian Bogor, Tahun 2012 Hak Cipta dilindungi Undang-undang
1. Dilarang mengutip sebagian atau seluruh karya tulis ini tanpa mencantumkan atau menyebutkan sumber
a. Pengutipan hanya untuk kepentingan pendidikan, penelitian, penulisan karya ilmiah, penyusunan laporan, penulisan kritik atau tinjauan suatu masalah
b. Pengutipan tidak merugikan kepentingan yang wajar bagi IPB 2. Dilarang mengumumkan dan memperbanyak sebagian atau seluruh karya
DESIGN FOR SUSTAINABLE MANAGEMENT OF
SEAGRASS ECOSYSTEMS FOR SUPPORTING FISHERIES
IN SPERMONDE ARCHIPELAGO, SOUTH SULAWESI
A dissertation
submitted for the degree of Doctor of Philosophy in
Study Program of Environment and Natural Resources Management
NADIARTI
SCHOOL OF GRADUATE STUDIES BOGOR AGRICULTURAL UNIVERSITY
Penguji pada Ujian Tertutup: Prof. Dr. Budimawan, DEA Dr. Ir. Fredinan Yulianda, MSc
Penguji pada Ujian Terbuka: Prof. Dr. Ir. Jamaluddin Jompa, MSc
Dissertation Title : Design for Sustainable Management of Seagrass
Ecosystems for Supporting Fisheries in Spermonde Archipelago, South Sulawesi
Name : Nadiarti
Reg. No. : P061060021
Acknowledged by
Supervisor Team
Dr. Ir. Etty Riani, MS Main Supervisor
Dr. drh. Ita Djuwita, M.Phil Dr. Ir. Sugeng Budiharsono Prof. Dr. Ir. Ari Purbayanto, M.Sc Co-supervisor Co-supervisor Co-supervisor
Approved by
Head of Study Program Dean of Graduate School Environment and Natural Resources
Management
Prof. Dr. Ir. Cecep Kusmana, MS Dr. Ir. Dahrul Syah, MSc, Agr
ACKNOWLEDGEMENTS
The author thank profusely to supervisor team, Dr. Ir. Etty Riani, MS, Dr. drh. Ita Djuwita, M.Phil, Dr. Sugeng Budiharsono, and Prof. Dr. Ari Purbayanto, MSc, for their invaluable supports and constructive criticism. The author is also much obliged to Prof. Surjono H. Sutjahjo for his support and spirit provided since the research idea was proposed. The author also thank plentyfully to Prof. Dietrich G. Bengen, Prof. Jamaluddin Jompa, Dr. Harald Asmus, and Dr. Suaedi Fachruddin for sharing idea that enlighten author’s mind to start formulate a research related to seagrass management. Author also have a great gratitudes to Dr. Harald Asmus together with Dr. Rachnild Asmus for their hospitality and their helps during study visit of the author in Alfred Wegener Institute, Sylt-Germany. A thankful also to Prof. Budimawan and Dr. Khusnul Yaqin for interesting discussion and great ideas that supporting field study preparation, and to Dr. Fredinan Yulianda for his valuable suggestions. The author is grateful to Irfan Ambas and Sharifuddin Hasyim for providing numbers of international journals, to Dr. Abd. Rasyid for providing maps of study area, to Dr. Hasni Y. Azis, Dr. Fatmawati, Dr. Andi Irwan Nur, Dr. David Hermawan for interesting discussion.
The author has a great appreciation to Munandar Jakasukmana, Muh. Ikhsan, Syahinullah, Mosriullah, Andi Muarifah, Abdul Razak (deceased), Tanjung, Halidja, Ridwan, Daeng Ngerang, and all seagrass fishers in Barrang Lompo and Kapoposang Islands, for their assistance during field study, to Dr. Nita Rukminasari and Tauhid Umar for providing software of analysis tools. This dissertation would not have been possible without the assistance of staffs of Water Quality Lab of Fisheries Department and Fisheries Biology Lab within Hasanuddin University, Makassar (Prof. Sharifuddin Omar, Dr. Joeharnani Tresnati, Badraeni, Fitriani, Funky, and more..) who facilitate the author during study. The author particularly indebted to the assistance and enthusiasm of ‘Team SPICE (Science for Protection of Indonesian Coastal Ecosystems) Seagrasses’– an enormous thanks to Dody Priosambodo, Claudia Pogoreutz, Dominik Kneer. The author also appreciates the staffs of Centre for Coral Reef Research (CCRR) within Hasanuddin University, especially to Dr. Dewi Yanuarita and Dr. Magdalena Lithaay, Dr. Lukman for providing several literatures and facilities during laboratory analysis.
The author is grateful to Indonesian Higher Education of Directorate General, Ministry of Education and Culture for providing doctoral studentship, and to Governor of South Sulawesi, Local Government of Bantaeng Regency, Toyota and Astra Foundation as well as COREMAP II for providing additional doctoral fellowship.
The author could not complete these acknowledgements without thanking all people from a big family in Wesabbe A.36 Makassar for their caring and loves. Special thanks to adored Father (deceased Nurdin Kadir) and to a lovely Mother Hj. Muslinah Abdullah for her ever present encouragement and love. To a beloved Father (deceased) and adorable Mother, sisters (Isriani, Nur Masyitha, Imelda, Nita) and brothers (M. Riski Nurdin, M. Irfan Nurdin, Syaharuddin, and Andi Erwin), this dissertation is dedicated to you all.
ABOUT THE AUTHOR
Nadiarti was born in Makassar at January 6th, 1968, South Sulawesi, Indonesia. In 1985, she completed a bachelor’s degree in fisheries from Hasanuddin University in Makassar, South Sulawesi, Indonesia and become a lecturer at the same university since 1991 to date. Through Marine Science Education Project (MSEP) funded by ADB-loan for Indonesia, she was selected as one of Indonesian lecturers to study at Humberside University, United Kingdom for Postgraduate Diploma in Fisheries Management and graduated at 1994. With the same funding source, she continued her study to University of Wales, Bangor, in the same country and then she was graduated as Master of Science (MSc) in Marine Environmental protection at 1996. Her thesis focused on a simple model to test for euthrophication in marine waters. Two years later, Nadiarti was selected as a Secretary (Vice Head) of Fisheries Department within Hasanuddin University, Makassar, Indonesia, for four years.
TABLE OF CONTENTS
Page
LIST OF TABLES ... xiv
LIST OF FIGURES ... xvi
LIST OF APPENDICES ... xix
GENERAL INTRODUCTION ... 22
Background ... 22
Research Objectives ... 30
Research Benefit ... 31
Scope of Research ... 31
A COMPARISON OF FISH DISTRIBUTIONS PATTERN IN TWO DIFFERENT SEAGRASS SPECIES-DOMINATED BEDS IN KAPOPOSANG ISLAND, SOUTH SULAWESI... 32
Abstract ... 32
Abstrak ... 33
Introduction ... 34
Material and Methods ... 35
Results ... 41
Discussion ... 55
Conclusion and Recommendation ... 59
References ... 61
FISHING ACTIVITY AND THEIR STATUS IN THE INTERTIDAL SEAGRASS BEDS IN SOUTH SULAWESI ... 66
Abstract ... 66
Abstrak ... 67
Introduction ... 68
Material and Methods ... 69
Results ... 76
Discussion ... 85
Conclusion and Recommendation ... 92
References ... 92
Abstrak ... 100
Introduction ... 101
Material and Methods ... 102
Results ... 109
Discussion ... 118
Conclusion and Recommendation ... 121
References ... 122
GENERAL DISCUSSION ... 127
CONCLUSION AND RECOMMENDATION ... 143
REFERENCES ... 144
LIST OF TABLES
Page 1 Seagrass recorded in Indonesian waters ... 2 Estimated seagrass and coral percent cover of continues seagrass beds in the
surrounding waters of Kapoposang Island ... 3 Environment characteristic data at each fish sampling site ... 4 Summary of t-test results ... 5 Major species contributor to dissimilarity between both study sites ... 6 The top 10 ranked mean fish abundance (ind. ± SE 100 m-2) captured during
day and night in both study sites ... 7 Dominant fish sizes found in the seagrass beds dominated by T. hemprichii ... 8 Description of fishing status scale... 9 The common captured fish family in both study areas ... 10 Estimated Y and MSY values of each captured fish family in both study areas 11 Estimated fishing rate of various fish family in both study areas ... 12 Matrix for weight determination of each dimension according to pairwise
comparison ... 13 Sustainability status of seagrass ecosystems ... 14 Kruskal’s stress and RSQ values for the different evaluation field ... 15 Sustainability status of seagrass ecosystems in Barrang Lompo Island and
Kapoposang Island ... 16 Priority order of each dimension in seagrass ecosystems of Barrang Lompo
21 Estimated sustainability score improvement of seagrass ecosystems of Barrang Lompo (BL) Island after applying strategy intervention ... 22 Estimated sustainability score improvement of seagrass ecosystems of
Kapoposang (KP) Island after applying strategy intervention ... 23 Sustainability status of seagrass ecosystems in Barrang Lompo Island (BL)
and Kapoposang Island (KP) after intervention ... 115
116
LIST OF FIGURES
Page 1 Nomenclature commonly used to describe parts of seagrasses and attributes of
the canopy they form (adopted from Koch et al. 2006) ... 2 General morphology of seagrasses. A. Enhalus acoroides. Scale = 3 cm. B.
Halophila engelmanni. Scale = 3 mm. C. Halophila minor. Scale = 2 cm. D.
Zostera asiatica. Scale = 15 cm. E. Posidonia sinuosa. Scale = 3.5 cm. F.
Halodule uninervis. Scale = 2.5 cm. G. Cymodocea serrulata. Scale = 5 cm. H. Syringodium isoetifolium. Scale = 4.5 cm. I. Thalassodendron
pachyrhizum. Scale = 4 cm. (Pictures adopted from Kuo and den Hartog 2006). ... 3 Seagrass distribution in the world (source: UNEP-WCMC 2001) ... 4 Illustration of marine food web in seagrass ecosystems (Fortes 1990 In:
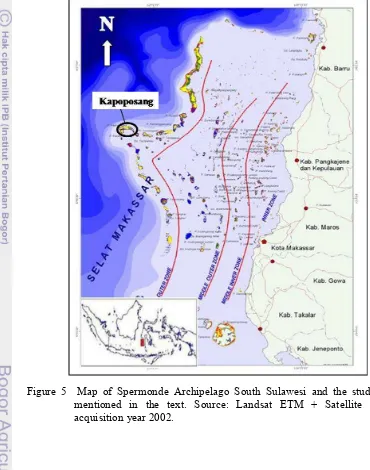
Unsworth 2007). ... 5 Map of Spermonde Archipelago South Sulawesi and the study area mentioned
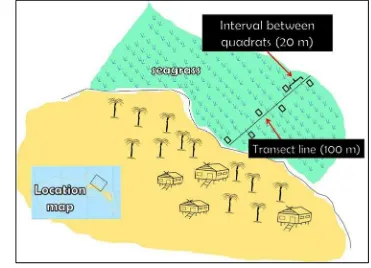
in the text. Source: Landsat ETM + Satellite image, acquisition year 2002. ... 6 Position of transect line and quadrates for seagrass cover estimation in the
continues seagrass beds of Kapoposang Island. ... 7 A map of Kapoposang Island showing the location of seagrass beds dominated by Thalassia hemprichii (TH site) and by Enhalus acoroides (EA site). ... 8 Dominant seagrass species in the waters surrounding Kapoposang Island. (A)
Enhalus acoroides, (B) Thalassia hemprichii (Pictures: Nadiarti), illustrations of (C) E. acoroides, (D) T. hemprichii (pictures: adopted from McKenzie et al. (2001). ... 9 Dominant species caught in abundance (A) and biomass DW (B) during the
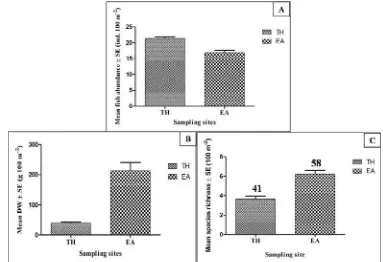
study. ... 10 Mean abundance (A), mean DW (B), and mean species richness (C) of fish
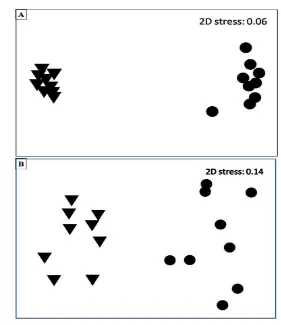
in both sampling sites. Error bars show standard error of the means. Number above the bars in (C) indicate total number of fish species collected in each sampling site during the study. ... 11 Two dimensional nMDS ordination of fish abundance (A) and DW (B) at TH
(d) and EA (z) sampling sites. ... 12 Mean fish abundance (A) and Dry Weight (DW) (B) at each sampling site
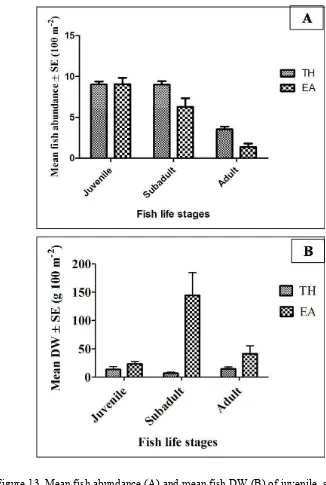
13 Mean fish abundance (A) and mean fish DW (B) of juvenile, subadults and adults stages. Error bars indicate standard error of the means. ... 14 Two dimensional nMDS ordination of fish life stage for abundance (A) and
biomass DW (B). Juveniles at TH site (S), subadults at TH site ( ), adults at TH site (z), juveniles at EA site (V), subadults at EA site (), adults at EA site ({). ... 15 Mean abundance of fishes that most contribute (>10%) to differences among
life stages. Error bars indicate standard error of the means. ... 16 Mean fish DW of fishes that most contribute to differences among life stages.
Error bars indicate standard error of the means. ... 17 Mean fish density of several different size class at TH and EA site. Error
bars indicate standard error of the means. ... 18 Map of Spermonde Archipelago South Sulawesi and the study area
mentioned in the text. Inset: Indonesian Archipelago. ... 19 Barrang Lompo Island (Picture: Nadiarti) ... 20 Part of Kapoposang Island. The picture taken from the top of lighthouse
(Picture: Nadiarti). ... 21 Corresponding of exploitation status to the areas of catch per effort diagram.
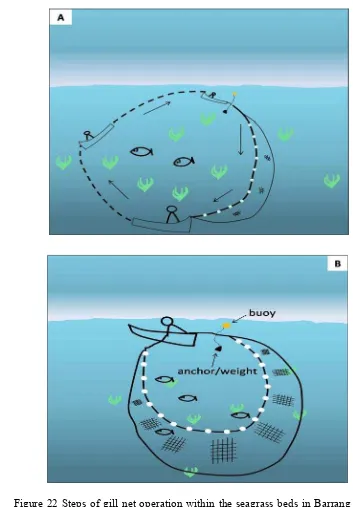
TAC = total allowable catch, U = under exploited, M = moderately exploited, F = fully exploited, H = heavily exploited, O = overexploited. ... 22 Steps of gill net operation within the seagrass beds in Barrang Lompo Island,
begin with spanning the net from the boat (A), and then encircled the net (B). ... Error! Bookmark not defined. 23 Gill net operation during fishing in the seagrass bed of Barang Lompo Island.
(A) water surface hitting within the encircled net, (B) net pulling for taking the catch. ... Error! Bookmark not defined. 24 Various gears for catching fish in the seagrass beds of Kapoposang Island.
(A,B) Single line fishing used by kids and young people to catch fish, (C,D,E) Bamboo fish traps and (F) Gill-nets as an alternative for capturing fish. ... Error! Bookmark not defined. 25 Catch per Unit Effort (CPUE, kg DW d-1) of the most exploited fish family in
Barrang Lompo Island (BL) and Kapoposang Island (KP). ... 26 Fish exploitation level in the seagrass beds of study areas. Numbers in black
shadow explain the exploitation rate in Barrang Lompo Island (BL) and Kapoposang Island (KP). ...
27 Map of study area, showing the location mentioned in the text (dotted line is approximate shelf edge). Inset: Indonesian Archipelago. ... 28 Sequential steps in sustainability analysis of seagrass ecosystems (modified
from Alder et al. 2004). ... 29 Block diagram showing RapsecsExcel software architecture (Modified from
Kavanagh and Pitcher 2004). ... 30 Two dimensional Rapsecs plots of the MDS ordination of the seagrass
ecosystems in Barrang Lompo Island (¡) and Kapoposang island (). ... 31 Median with inter-quartile error bars (50% of scatter). ... 32 Median with error bars showing 95% confidence of median. ... 33 Kite representation of the evaluation of seagrass ecosystems in Barrang
Lompo Island (BR) and Kapoposang Island (KP). ... 34 Leverage analysis of ecological dimension for seagrass ecosystems of Barrang Lompo Island (A) and Kapoposang Island (B). ... 35 Leverage analysis of economic dimension for seagrass ecosystems in Barrang
Lompo Island (A) and Kapoposang Island (B). ... 36 Leverage analysis of social dimension for seagrass ecosystems in Barrang
Lompo Island (A) and Kapoposang Island (B). ... 37. Leverage analysis of technology dimension for seagrass ecosystems in
Barrang Lompo Island (A) and Kapoposang Island (B). ... 38 Leverage analysis of institutional dimension for seagrass ecosystems in
Barrang Lompo Island (A) and Kapoposang Island (B). ... 39 A conceptual model of dissertation, showing the topics of the different
chapters. ... 40 A conceptual model of how the interconnected most influence attributes to
the seagrass ecosystems sustainability will improve the fisheries productivity in the seagrass ecosystems and the fisher’s household income. ... 41 Kite representation of the evaluation of seagrass ecosystems in Barrang
LIST OF APPENDICES
Page 1A Estimated seagrass cover within the seagrass beds in the geographic position
of S04o41'42.5"; E118o56'59.5 (Site A) ... 1B Estimated seagrass cover within the seagrass beds in the geographic position
of S04o41'48.8"; E118o56'57.7" (Site B) ... 1C Photograph of seagrass cover in the geographic position S04o41'42.5";
E118o56'59.5 (Site A). Total cover: 85% (A), 90% (B), 85% (C), 85% (D), 85% (E), 75% (F) (Pictures: Nadiarti). ... 1D Photograph of seagrass cover in the geographic position S04o41'48.8";
E118o56'57.7" (Site B). Total cover: 55% (A), 75% (B), 85% (C), 35% (D), 20% (E), 20% (F) (Pictures: Nadiarti). ... 1E Estimated seagrass cover within the seagrass beds in the geographic position
of S04o41'52.5"; E118o57'00.3" (Site C) ... 1F Estimated seagrass cover within the seagrass beds in the geographic position
of S04o41'56.7"; E118o57'20.3" (Site D) ... 1G Estimated seagrass cover within the seagrass beds in the geographic position
of S04o41'57.8"; E118o57'45.7" (Site E) ... 1H Photograph of seagrass cover in the geographic position S04o41'52.5";
E118o57'00.3" (Site C). Total cover: 75% (A), 75% (B), 55% (C), 55% (D), 55% (E), 55% (F) (Pictures: Nadiarti). ... 1I Photograph of seagrass cover in the geographic position S04o41'56.7";
E118o57'20.3" (Site D). Total cover: 35% (A), 55% (B), 55% (C), 85% (D), 35% (B), 30% (F) (Pictures: Nadiarti). ... 1J Photograph of seagrass cover in the geographic position S04o41'57.8";
E118o57'45.7" (Site E). Total cover: 100% (A), 85% (B), 100% (C), 100% (D), 95% (B), 90% (F) (Pictures: Nadiarti). ... 2A Sampling data during the study ... 2B Ranking order of mean abundance and biomass DW of all fish species caught
at the seagrass beds dominated by Thalassuia hemprichii at Kapoposang Island, South Sulawesi ... 2C Ranking order of mean abundance and biomass DW of all fish species caught
2D Most dominant species caught during field sampling at Kapoposang Island. Dominant in abundance (A, B, C) and dominant in biomass (D,E,F,G). ... 2E Top ten ranked species (in abundance) caught during field sampling in
Thalassia hemprichii-dominated seagrass beds of Kapoposang Island. ... 2F Top ten ranked species (in biomass) caught during field sampling in Thalassia hemprichii-dominated seagrass beds of Kapoposang Island. ... 2G Top ten ranked species (in abundance) caught during field sampling in
Enhalus acoroides-dominated seagrass beds of Kapoposang Island. ... 2H Top ten ranked species (in biomass) caught during field sampling in Enhalus
acoroides-dominated seagrass beds of Kapoposang Island. ... 2I The top 10 ranked mean fish abundance (ind. ± SE 100 m-2) captured during
study at day and night at Kapoposang Island ... 2J The top 10 ranked mean fish DW (g. ± SE 100 m-2) captured during study at
day and night at Kapoposang Island ... 3A Data of captured fish from seagrass beds of Barrang Lompo Island ... 3B Data of captured fish from seagrass beds of Kapoposang Island ... 4A Attributes within ecological dimension used in Rapsecs analysis for seagrass
ecosystems sustainability ... 4B Attributes within economic dimension used in Rapsecs analysis for seagrass
ecosystems sustainability ... 4C Attributes within social dimension used in Rapsecs analysis for seagrass
ecosystems sustainability ... 4D Attributes within technological dimension used in Rapsecs analysis for
seagrass ecosystems sustainability ... 4E Attributes within institutional dimension used in Rapsecs analysis for seagrass
ecosystems sustainability ... 4F Scoring attributes within ecological dimension for Barrang Lompo Island and
4G Scoring attributes within economic dimension for Barrang Lompo Island and Kapoposang Island ... 4H Scoring attributes within social dimension for Barrang Lompo Island and
Kapoposang Island ... 4I Scoring attributes within technological dimension for Barrang Lompo Island
and Kapoposang Island ... 4J Scoring attributes within institutional dimension for Barrang Lompo Island
and Kapoposang Island ... 4K Weight determination and the whole sustainability status for seagrass fishery
of Barrang Lompo Island ... 4L Weight determination and the whole sustainability status for seagrass fishery
of Kapoposang Island...
169
170
171
172
173
GENERAL INTRODUCTION
Background
Seagrass Taxonomy
Seagrasses have similar organs and tissues as the other flowering plants, but because they have to live in marine environment, this has strongly influenced their morphology and anatomy. So that, morphologically, seagrasses are closely similar to terrestrial grasses, but botanically, they are more closely related to lilies than grasses. Seagrasses have a horizontal rhizome linking clusters of leaves referred to as shoots, and roots are usually found at each shoot (Figure 1). Seagrasses as other flowering plants, also have flowers and seeds. The flowers of some species (e.g., Halodule wrightii, Thalassia testudinum) are found near the sediment surface while other seagrass species (e.g., Zostera marina, Ruppia maritima), when reproductive, form long vertical stems that can occupy most of or the entire water column. The above-ground vegetation that occupies the water column is referred to as seagrass canopy (Figure 1, Koch et al 2006).
Seagrasses can be grouped into three main morphological categories with some taxonomic implications (Kuo and den Hartog 2006):
a. Plants without strap-shaped leaves but with either a pair of petiolate leaves at the rhizome node or two or more leaflets on each of the distal nodes of the erect stem. This category is restricted to Halophila, which has the smallest shoots among seagrasses. Shoots can be less than 1 cm in length, as for H. beccarii and H. minor (Figure 2B and 2C), and up to 20 cm long as for H. australis.
b. Shoots with a distinct erect stem and strapshaped leaves borne at the top of an erect stem. This group includes Thalassia of the Hydrocharitaceae and all genera of the Cymodoceaceae (Figure 2F and 2I).
c. Plants without visible erect stems, but with strap-shaped leaves derived from the rhizome nodes. Enhalus of the Hydrocharitaceae, the Posidoniaceae and all members of the Zosteraceae belong to this group (Figure 2A, 2D and 2E). The leaves of some members of Zostera subgenus Zosterella can be as small as 10 cm; while for Enhalus, Posidonia, Zostera subgenus Zostera and Phyllospadix, it is not uncommon for them to reach 1 m or more.
Seagrass Distribution
Seagrasses have been found in almost all part of the world, with the exception of Antarctic (Hemminga and Duarte 2000; Short and Cole 2001), and globally they consist of two families, Potamogetonaceae and Hydrocharitaceae, and they are grouped into 12 genera containing about 50-60 species (Hemminga and Duarte, 2000). The most diverse of this flora is found in the Tropical Indo-Pacific (Figure 3, UNEP-WCMC 2001; Short et al. 2007) of which 12 seagrass species (UNEP 2004) occur in the Indonesian coastal waters, and one new recently found species, Halophila sulawesii, grows in deep water around reef island of the Spermonde Archipelago Kuo (2007). Table 1 provide list of seagrass species that grow in Indonesian coastal waters.
Tabel 1 Seagrass recorded in Indonesian waters
Family/Genus Species
Enhalus 1. E. acoroides* Halophila 2. H. decipiens*
3. H. minor* 4. H. ovalis* 5. H. spinulosa* 6. H. sulawesii♦ Thalassia 7. T. hemprochii* Cymodoceaceae 8. C. rotundata* Cymodocea 9. C. serrulata* Halodule 10.H. pinifolia* 11.H. unineris* Syringodium 12.S. isotifolium* Thalassodendron 13.T. ciliatum* *
Source: Tomascik et al. (1997),♦Source: Kuo (2007)
Importance of Seagrass Ecosystems in Supporting Fisheries
Seagrasses consist of less 0.02% of the angiosperm flora in the world (Hemminga and Duarte 2000). Even though the contribution is small, the seagrasses are of great ecological importance and have a high conservational value. There are various function of seagrass beds in marine coastal ecosystems. Seagrasses absorb carbon dioxide from marine water and then they provide oxygen to the water and sediments through photosynthesis process. Their roots have important role in stabilizing sediments and their leaves are playing role in preventing eutrophication in the seawater by trapping suspended solids and absorbing inorganic salts, so that contributing to water quality improvement in coastal waters (Hemminga and Duarte 2000).
The seagrass meadows, moreover, have been known as one of the most productive marine ecosystems following the mangrove and coral reefs (Rasheed et al. 2006; Blankenhorn 2007). The total economic value of seagrass systems services is at least US$ 3.8 trillion per year globally, and is likely to increase (Costanza et al. 1997).
productivity. The primary production is derived not only from tissue of seagrasses themselves but also from epiphytes that grow and attach to the leaves surface of the seagrasses. So, seagrasses provide service as one of nutrient sources in the coastal ecosystems, including as a source of food for associated organism directly and indirectly via detritus and epiphytes. Several authors have proved this argument (MacArthur and Hyndes 2007; Unsworth et al. 2007b; Kneer et al. 2008b; Lepoint et al. 2006; Kaiser 2008). Consequently, high abundance of fauna species can be found in the seagrass beds as showed by Unsworth et al. (2007c); Manik (2007) and Sabarini and Kartawijaya (2006) in their study results. The productive seagrass communities contribute also the diets of consumers (including transient predators) that spend a portion of their time foraging in seagrass habitat (Ganter 2000; Valentine et al. 2002). Decomposition of seagrass litters supporting also a microbial marine food web (Peduzzi 1991). This is making the seagrass ecosystems play an important role to the marine food webs. It is because seagrass together with mangrove and coral species create a series of connected habitats and ecosystems that supporting a variety of complex trophic-interaction (Figure 4).
Figure 4 Illustration of marine food web in seagrass ecosystems (Fortes 1990 In: Unsworth 2007).
for many species especially for spawning ground and nursery habitat (Dorenbosch et al. 2006; Polte and Asmus 2006; Kaiser 2008; Nakamura et al. 2009a,b).
Seagrass Degradation and Loss
Although seagrass ecosystems are commonly well-known as important features of coastal zones, unfortunately, they are seldom given the attention or protection they deserve. In last decade, seagrass beds have drastically declined in tropical and temperate zone worldwide (Robblee et al. 1991; Hall et al. 1999; Westphalen et al. 2004; Orth et al. 2006; Murdoch et al. 2007; Waycott et al. 2009; Hughes et al. 2009). New research showed that 58% of world's seagrass meadows are currently declining (UMCES 2009), including Indonesia lost about 30-40% of its seagrass beds (UNEP 2004).
The assessment result of the research of UMCES (2009) showed that seagrasses are disappearing at rates similar to coral reefs and tropical rainforests. The decline results from direct, indirect human impacts, and from natural causes. Direct human impacts including mechanical damage (by dredging, fishing, and anchoring) (Hasting et al. 1995; Francour et al. 1999; Creed and Amado 1999; Badalamenti et. al. 2006), eutrophication (van Katwijk et al. 1997; Burkholder et al. 2007), aquaculture and siltation (Alexandre et al. 2005; Frederiksen et al. 2007; Marianne et al. 2008), effects of coastal constructions (Cambridge et al. 1984; Freeman et al. 2008), food web alterations (Douglas et al. 2007) and declining water quality (Jacobs 1980; Macinnis-Ng and Ralph 2002; Hughes et al. 2009); and from indirect human impacts, including negative effects of climate change (erosion by rising sea level, increased storms, increased sea surface temperature, increased ultraviolet irradiance) (Robblee et al. 1991), as well as from natural causes, such as cyclones and floods (Short et al. 2006).
Consequences of Seagrass Declining and Loss
habitat. The impact of the continuing losses of the ecosystems will also expand far beyond the areas where seagrasses grow. Including to both shallow waters and the deep sea, as the export detached seagrass leaves, by currents and waves, has been correlated with high densities of invertebrates and fishes in these areas (Valentine et al. 2002). The impact will also definitely spread out to the neighbouring ecosystems of seagrass, the mangrove forest and coral reefs. It is because as an ecotone between coral reefs and mangrove forests in tropical coasts, the seagrass ecosystems are important in their interaction, including structural and dynamic components of the adjacent ecosystems (Dorenbosch et. al. 2005; Nakamura et al. 2009a; Unsworth et al. 2009).
Seagrass Study in Indonesia
Now the time to acknowledge the opinion on the status of seagrass ecosystems that there is a global decline of seagrass ecosystems and the ecosystems are increasingly threatened. This opinion is required in order to achieve the visibility and recognition necessary to protect and manage this valuable global resource. This is especially important in tropical developing countries with high coastal population densities, such as Indonesia.
2008), and seagrass community in Manokwari Coastal Waters (Lefaan 2008). Study on the role of seagrass ecosystems in supporting the faunal productivity of Indo-Pacific coastal marine systems was carried out on the Wakatobi Marine National Park (Unsworth 2007b; Unsworth et al. 2007a, 2007b, 2007c; Unsworth 2008; Unsworth et al. 2009). Benthic microbial metabolism was investigated by Alongi et al. (2008) in Awerange Bay, Barru, South Sulawesi.
Spermonde Archipelago, a shelf region located at the west coast of South Sulawesi, Indonesia, with about 120 islands, represents a favorable area to study seagrass ecosystems, as it is a hotspot of coral and seagrass diversity (Hemminga and Duarte 2000). Seagrass beds in the archipelago were first described by Erftemeijer and Middelburg (1993) who studied sediment-nutrient interaction in the seagrass beds located in two different sites, Barrang Lompo and Gusung Tallang, although at the moment, the seagrass beds in the later site cannot be confirmed anymore. Further studies about nutrient were investigated by Erftemeijer et al. (1994); Erftemeijer and Middelburg (1995); Stapel et al. (1996); Stapel et al. (1997); Stapel and Hemminga (1997); and Stapel et al. (2001); Vonk et al. (2008a,c); Vonk and Stapel (2008).
Another seagrass investigation in the Spermonde Archipelago included primary production (Erftemeijer et al. 1993; Erftemeijer and Stapel. 1999; Supriadi 2003), food source (Erftemeijer et al. 1993; Kneer et al. 2008a), effect of grazing (Kaiser 2008; Liu et al. 2008; Vonk et al. 2008d), seasonal dynamic of biological and environment variables (Erftemeijer and Herman 1994), burrower organisms (Kneer et al. 2008b; Vonk et al. 2008b), distribution of foraminifera and gastropods (Troelstra et al. 1996; Hadijah 2000). However, little is known about the sustainability of seagrass ecosystems in the Spermonde Archipelago, especially in Barrang Lompo Island and Kapoposang Island.
Strategy Design for Sustainable Management of Seagrass Ecosystems
Dense population in the south east of the archipelago implements an increased pressure to the seagrass ecosystems, as most of the population depends on subsistence and small scale fisheries (Pet-Soede et al. 2001). This leads to the
high stress of seagrass ecosystems as Priosambodo et al. (2006) found in the small islands (Pulau Barang Lompo and Pulau Sarapokeke) with very high density of population.
Seagrass ecosystems management is an important part of managing the marine fisheries as the reasons previously described, although this concept has not been understood by most Indonesian people, including local community in the Spermonde Archipelago. As a result there has been little inclination to protect seagrass meadow ecosystems and they rarely incorporated specifically into coastal management plans, so that are vulnerable to degradation.
In order to effectively manage the seagrass ecosystems, strategies of seagrass ecosystems management for supporting fisheries should be designed in advance. This is important in order to provide biodiversity protection and sustainable use of the seagrass ecosystems. As a multidimensional human effort, seagrass use as a part of fisheries sector relates to multidimensional aspects (ecological, economical, social, technological and institutional dimension). Therefore, there is a requirement of better understanding about seagrass habitat provide for fauna including fish and about multidimensional human effort related to seagrass use that affect the sustainability of the seagrass ecosystems. These understanding is important in designing the responsible management of seagrass ecosystems (as a part of fisheries resource) for supporting long-term sustainable use of fisheries resources as suggested within the Code of Conduct for Responsible Fisheries (FAO 1995).
Research Objectives
The main goal of the research is to design the sustainable management of seagrass ecosystems for supporting fisheries in the Spermonde Archipelago. In order to achieve the main goal, the following specific objectives will be performed:
Research Benefit
The resulted strategies of seagrass ecosystems management will make an important contribution to:
• The science development, mainly on coastal management science development.
• The government, particularly on policy making for coastal management plans.
• The community, especially on awareness improvement for the importance of seagrass ecosystems management.
• Seagrass-related human activities including fishing practices on the seagrass ecosystems.
Scope of Research
Scope of the research include 1) fish community structure (including the difference over diel cycle, life stage and size class distribution) in two seagrass beds dominated by different species, 2) fishing activities in the seagrass ecosystems and their status in Barrang Lompo Island and Kapoposang Island, 3) sustainability status of seagrass ecosystems for supporting fisheries in Barrang Lompo Island and Kapopoang Island.
A COMPARISON OF FISH DISTRIBUTIONS PATTERN IN TWO DIFFERENT SEAGRASS SPECIES-DOMINATED BEDS IN
KAPOPOSANG ISLAND, SOUTH SULAWESI
Abstract
Seagrass beds dominated by Thalassia hemprichii (TH) and Enhalus acoroides (EA) have different complexity structure, which in turn will affect fish community structure within the seagrass beds. This study was aimed to: 1) exmine the seagrass beds dominated by TH and EA in surrounding coastal waters of Kapoposang Island, 2) compare environment characteristics in both seagrass beds, (3) compare fish distribution and community structure in both seagrass beds, including: total fish abundance and biomass as well as diversity, fish distribution over diel cycle, fish life stage, and fish size distribution. Seagrass beds dominated by TH and EA was identified by estimating seagrass cover percentage of each seagrass species using photo standard McKenzie. Environment characteristic was measured and observed directly in the field. Fish community structure was analyzed using non-metric multidimensional scaling technique and Bray-Curtis cluster analysis, while the most contributed species to difference of fish community structure was analyzed using SIMPER (similarity of percentages) procedure. All statistics analysis were carried out using PRIMER v6 software. The difference between fish distribution in both seagrass beds was analyzed with t-test and Bonferroni post-test using PRISM v5 software. The study results revealed that there were two locations with the highest seagrass cover and each was dominated by TH and EA. Environment characteristics in both seagrass beds were relatively the same. It was found that fish community structure and distribution pattern in TH- and EA-dominated seagrass beds were significantly different.
Abstrak
Padang lamun yang didominasi oleh Thalassia hemprichii (TH) dan
Enhalus acoroides (EA) memiliki struktur kompleksitas yang berbeda dan perbedaan ini akan mempengaruhi pula struktur komunitas ikan pada kedua padang lamun tersebut. Penelitian ini bertujuan untuk: (1) mengetahui padang lamun yang didominasi oleh TH dan EA di sekitar perairan pantai Pulau Kapoposang, (2) membandingkan karakteristik lingkungan di antara kedua padang lamun tersebut, (3) membandingkan distribusi dan struktur komunitas ikan di antara kedua padang lamun tersebut, meliputi: kelimpahan dan biomass total serta kekayaan spesies ikan, distribusi ikan pada siklus siang dan malam, fase hidup ikan, dan distribusi ukuran ikan. Identifikasi padang lamun yang didominasi oleh TH dan EA dilakukan dengan mengestimasi persentase tutupan lamun setiap species menggunakan panduan standar foto tutupan lamun McKenzie. Karakteristik lingkungan diukur dan diamati langsung di lapangan. Struktur komunitas ikan dianalisis dengan teknik non-metric multidimensional scaling
(nMDS) dan analisis klaster Bray-Curtis, sementara spesies yang memberi kontribusi terbesar terhadap perbedaan struktur komunitas ikan dianalisis dengan melakukan prosedur SIMPER (similarity of percentages). Keseluruhan analisis ini dilakukan dengan menggunakan paket software PRIMER v6. Perbedaan distribusi ikan pada kedua padang lamun dianalisis dengan uji t dan uji pasca Bonferroni menggunakan paket software PRISM v5. Hasil penelitian menunjukkan bahwa ada dua lokasi yang memiliki tutupan lamun terbesar dan masing-masing didominasi oleh TH dan EA. Karakteristik lingkungan kedua padang lamun tersebut tidak jauh berbeda. Struktur komunitas dan pola distribusi ikan pada kedua padang lamun TH dan EA ditemukan berbeda nyata.
Kata kunci: Thalassia hemprichii, Enhalus acoroides, siang-malam, fase pertumbuhan, ukuran ikan
Introduction
Seagrasses are flowering submerged marine plants that live in both tropical and temperate coastal waters. The meadow ecosystems they generate have been found in almost all part of the world, except for Antarctic region, and recognized to have the highest primary productivity in the Indo-Pacific region (Hemminga and Duarte 2000). Seagrass meadows are important marine resources for fisheries at either local or regional level, as they support various marine fish and shellfish. They provide space for living, foraging, shelter, and protection, especially in the nursery stage (Nagelkerken et al. 2001; Heck Jr. et al. 2003; Dorenbosch et al. 2006; Gillanders 2006).
Several studies have focused on fish structure community in seagrass beds, showed that dense seagrass meadows harbor more abundant fish compared with the adjacent patches of removed seagrass and bare areas (Tuya et al. 2005; Smith et al. 2008; Rappe 2010). The structural complexity or heterogeneity of the seagrass habitat (i.e. different species composition, plant morphology and meadows architecture), has been considered as a factor affecting the fish assemblages (Heck and Thoman 1981; Blaber et al. 1992; Connolly 1994; Gulltsröm et al. 2002; Hyndes et al 2003).
The most common and abundant tropical seagrasse species in Indonesian waters, Thalassia hemprichii and Enhalus acoroides (Tomascik et al. 1997), have similar strap-like leaves shapes, but different in length and wide. T. hemprichii has shorter leaves (10-40 cm long, 0.5-1cm wide) compare with the much greater leaf lengths of E. acoroides (30-150cm long, approximately 1-2cm wide). For this reason, structural architecture of seagrass beds dominated by T. hemprichii
studies showed that seagrass beds dominated by E. acoroides harbor more fish (in abundance, biomass, and species richness) than the beds dominated by T. hemprichii, however, Nakamura and Sano (2004) found that there was no significant difference between fish community structure in both seagrass beds, while Gulltsröm et al. (2008) found the opposite results. What has not been described from the previous studies, is a measure of fish assemblage structure during day-night in those two different seagrass beds. Although many studies of difference in fish abundance over diel cycle in seagrass beds (e.g. Edgar and Shaw 1995; Unsworth et al 2007; Smith et al 2008), none of these works have compared between the fish assemblage during day-night in Thalassia hemprichii- and
Enhalus acoroides-dominated beds. Comparison of various fish sizes (including juvenile and small inconspicuous adult fish) between both of these seagrass beds was also still remain unknown.
The present study aims to: (1) identify the seagrass beds dominated by T. hemprichii and E. acoroides in the surrounding waters of Kapoposang island, (2) measure and compare the environment characteristics between both of the seagrass beds, (3) measure and compare the fish community structure and distribution between both of the seagrass beds, including: a. total abundance, biomass and species richness, b. fish distribution over diel cycle, c. fish life stages, d. fish size distribution.
Material and Methods Study Area
All fieldworks were carried out from July to August 2010 in waters surrounding Kapoposang Island (roughly reaches from 04o41' to 04o43'S and from 118o56' to 118o59'E). The island is a part of the region of Spermonde Archipleago in the waters south west of South Sulawesi, off the provincial capital of Makassar. It is situated approximately 60 km off the coast and very close to the edge of continental shelf (Figure 5), indicating significant influence of upwelling from the deep Makassar Strait and limited anthropogenic sources from the mainland.
Kapoposang is coral island, comparable to Barrang Lompo and Langkai islands, surrounded by large intertidal reef flat, which consist of coarse carbonate sand and coral rubble (93–100% CaCO3; Erftemeijer and Middelburg 1993) with extensive multispecies seagrass vegetation.
Seagrass Beds Determination
Seagrass beds determination was initiated by field survey to determine continues seagrass beds visually along the coastal waters surrounding Kapoposang Island. To obtain representative observation of the study area, transect method was applied. Seagrass beds that occurred from the inshore to over 100 m off the coast to deeper sub-tidal areas where coral habitats begin to dominate were determined as continues seagrass beds, hence those were less than 100 m were not included in this observation. Geographic position of inshore end as the start of the transect line was recorded as the site of each observed continues seagrass beds.
Seagrass cover percentage was then estimated in all identified continues seagrass beds using a combination method of a transect line and quadrates following English et al. (1994) and Mckenzie et al. (2003). A transect line (100 m) was located randomly to the seagrass beds along a shoreline of the island. Position of the transect was perpendicular to the shore and six replicate quadrats (1 x 1 m2) were placed side by side along the transect line. The distance of each quadrate was 20 m (Figure 6). All of the seagrass species found within each quadrats were identified and the percent contribution of each species to the total cover of seagrass within the quadrats was estimated based on the guidance of percent cover photo standards (McKenzie et al. 2003). The continues, highest percent cover, more structural complexity of seagrass beds were then selected for further fish sampling sites.
Environment Characteristic Measurement
On each selected sampling sites (seagrass beds dominated by Thalassia hemprichii and by Enhalus acoroides), water temperature, pH, and dissolved oxygen were measured with water quality checker, water depth was measured manually by a scaled stick (3 m), surface current was measured with hand-made current beat, and salinity was measured by hand-refractometer. All measurements were collected in the middle of the transect lines in every morning for 7 days, except for water depth, it was measured at the lowest and highest tide.
Figure 6 Position of transect line and quadrates for seagrass cover estimation in the continues seagrass beds of Kapoposang Island.
Fish Sampling and Data Processing
Fish population from seagrass beds were sampled at the permanent two different sampling sites (Figure 7, detailed explanation is described in study results of seagrass beds determination) using two types of gear (beach seine and monofilament gill net) to obtain a broad-range of species list and size for the sites. All these gears were applied within 400 m2 of each sampling site.
Beach seine net with 10 m in length, 84 cm in height, and 1 mm mesh size was used to capture small fish including juvenile as this net captures small fish more effectively than larger pelagic fish (Guest et al. 2003). The seine net was hauled 40 m from the start of seagrass into the shore by two people. The seine was
(2007). Gill-nets with 40 m in length and 1.5 m in depth of two stretched-mesh size (3 cm and 9 cm) were used to collect large fast-swimming fish. The nets were set in the waters for high water period when the seagrass site was immersed and retrieved every 3 hours, as suggested by Edgar et al. (2001), to represent day (5.00 to 18.00) and night (after 18.00) time. All the net samples were taken during July to August 2010 for nine consecutive days at each of sampling site, as the preliminary study showed that there were no more additional species change until the 9th day.
Figure 7 A map of Kapoposang Island showing the location of seagrass beds dominated by Thalassia hemprichii (TH site) and by Enhalus acoroides (EA site).
length (TL) to the nearest cm. Gut of each fish samples (except for fish with < TL 3 cm) were then removed before drying the fishes at 70oC until constant dry weight (DW). Species richness (based on Margalef index, eq. 1), fish abundance (based on fish individual number) and biomass DW (based on constant weight after fish drying) were then calculated at each sampling sites. Fish abundance over diel cycle was calculated based on captured time.
eq. (1),
where: S = number of species, N = total individu
The life stages were separated into 3 groups (juvenile, subadult and adult) according to species’ maximum lengths (Froese & Pauly 2011) and following Nagelkerken & van der Velde (2002); Gullström et al (2008). Thus, the fish of <1/3 maximum length was categorized as juvenile, 1/3 to 2/3 of the maximum length (subadults), and >2/3 maximum length (adults). Distribution of life stage group was then calculated in each sampling site. Mean fish density in each sampling site was calculated in four different interval size classes (2.5, 5, 10 and 20 cm) for assessment on utilization of seagrass habitat type in relation to fish size.
Data Analysis
by the dimension. MDS providing a usable picture of sample relationships (the closer two sites are on the plot, the closer their community composition) when the value is <0.2 (Clarke 1993; 1999). The similarity of percentages (SIMPER) procedure was conducted to ascertain which fish species contributed most to dissimilarity of fish community structure between the two of sampling sites.
Significant difference of total fish assemblages, size class, juvenile, subadults, adults (for abundance and DW) and species richness between the sampling sites were analyzed using t-test and bonferroni post-test analysis through PRISM software package v5. The difference of fish assemblage between day and night was also tested using bonferroni post-test but was restricted to the samples caught by gillnet only due to during the seine sampling in EA site, the low tide occur at the day time period only, so that it did not represent a whole diel cycle.
Results
Seagrass Beds Determination
The results of seagrass cover measurement showed that there were only five sites of continues seagrass beds in the surrounding coastal waters of Kapoposang Island. Seagrass species and their coverage were in variable in each sites, however the most frequent species found in all sites were Thalassia hemprichii
and Enhalus acoroides (Table 2).
Table 2 Estimated seagrass and coral percent cover of continues seagrass beds in the surrounding waters of Kapoposang Island
Geographic
EA: Enhalus acoroides, TH: Thalassia hemprichii, CR: Cymodocea rotundata, SI: Syringodium isoetifolium, HU: Halodule uninervis, HL: Halophila sp
Environment Characteristics
The results of field measurement revealed that there were no distinct differences between environment characteristics in TH site and in EA site (Table 3).
Table 3 Environment characteristic data at each fish sampling site
TH: seagrass beds dominated by T. hemprichii, EA: seagrass beds dominated by E. acoroides
Fish Community Structure and Distribution
Total abundance, DW and species richness. A total of 1379 fishes, from 63 taxa (of which 62 have been identified to species level) and 31 families was caught at all sampling sites during the study. Apogon bandanis, Atherinomorus lacunosus, and Lethrinus harak dominated fish samples and were counted for more than 60% of the total abundance. Tylosurus crocodilus, Diodron hystrix,
Siganus canaliculatus, and Lethrinus lentjan represented more than 40% of the overall DW (Appendix 2B, Figure 9).
Environment Characteristics Sites
TH EA
Water temperature (oc) 28.7-30.1 28.3-30.3
pH 8.1 – 8.2 8.0-8.1
Dissolved oxygen (ppm) 4.6-5.1 4.5-4.9
Water depth (m) at low tide 0.4-1.0 0.5-1.0
at high tide 1.8-2.3 m 2.0-2.5
Surface current (ms-1) 0.09-0.12 0.08-0.10
Salinity (‰) 31 31
Transparancy (%) 100 100
Figure 9 Dominant species caught in abundance (A) and biomass DW (B) during the study.
associated with t-test (R2 = 0.7, p < 0.01, Table 4) and these are supported by the two-dimensional MDS that showed an obvious separation of sampling site in the ordination plot (Figure 11).
Figure 10 Mean abundance (A), mean DW (B), and mean species richness (C) of fish in both sampling sites. Error bars show standard error of the means. Number above the bars in (C) indicate total number of fish species collected in each sampling site during the study.
Table 4 Summary of t-test results
Independent variables df T P R2
Fish abundance 8 4.6380 0.0017** 0.7289
Fish DW 8 4.6470 0.0017** 0.7297
Species richness 8 4.3810 0.0023** 0.7058
DW: dry weight
Figure 11 Two dimensional nMDS ordination of fish abundance (A) and DW (B) at TH (d) and EA (z) sampling sites.
The SIMPER procedure revealed that the average dissimiliarity between TH and EA sites was 70.90% (for abundance) and 83.73% (for biomass DW) and the species contributed most to the dissimilarities (≥5%) between sampling sites were
Apogon bandanensis, Lethrinus harak, Apogon hoeveni, Liza vaigiensis for fish abundance, and Tylosurus crocodilus, Siganus canaliculatus, A. bandanensis for fish DW (Table 5).
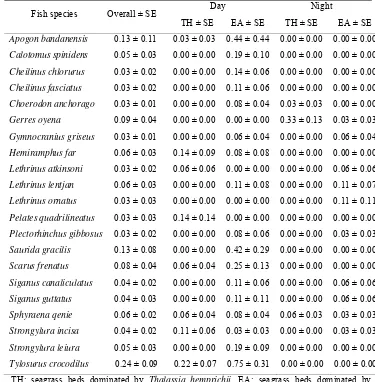
gracilis were claimed by Froese and Pauly (2011) that it is active at night, in this study, this fish was found more abundant during the day (Table 6).
Table 5 Major species contributor to dissimilarity between both study sites
Fish species
TH: seagrass beds dominated by T. hemprichii, EA: seagrass beds dominated by E. acoroides, DW: dry weight
Community Structures among Fish Life Stages. Mean fish abundance (Figure 13A) and mean fish DW (Figure 13B) of juvenile and adult stages did not significantly differ between TH and EA sites. However, subadult fish abundance at TH site was significantly higher (9.00 ± 0.41; Bonferroni post-test result: p<0.01) compared with EA site (6.26 ± 1.07). In contrast, subadult fish DW at EA site was about more than fifteen times higher (144.17 ± 40.48; Bonferroni post-test: p<0.001) in comparison with TH site (6.76 ± 1.90).
Table 6 The top 10 ranked mean fish abundance (ind. ± SE 100 m-2) captured
during day and night in both study sites
Fish species Overall ± SE Day Night
TH ± SE EA ± SE TH ± SE EA ± SE
Apogon bandanensis 0.13 ± 0.11 0.03 ± 0.03 0.44 ± 0.44 0.00 ± 0.00 0.00 ± 0.00 Calotomus spinidens 0.05 ± 0.03 0.00 ± 0.00 0.19 ± 0.10 0.00 ± 0.00 0.00 ± 0.00 Cheilinus chlorurus 0.03 ± 0.02 0.00 ± 0.00 0.14 ± 0.06 0.00 ± 0.00 0.00 ± 0.00 Cheilinus fasciatus 0.03 ± 0.02 0.00 ± 0.00 0.11 ± 0.06 0.00 ± 0.00 0.00 ± 0.00 Choerodon anchorago 0.03 ± 0.01 0.00 ± 0.00 0.08 ± 0.04 0.03 ± 0.03 0.00 ± 0.00 Gerres oyena 0.09 ± 0.04 0.00 ± 0.00 0.00 ± 0.00 0.33 ± 0.13 0.03 ± 0.03 Gymnocranius griseus 0.03 ± 0.01 0.00 ± 0.00 0.06 ± 0.04 0.00 ± 0.00 0.06 ± 0.04 Hemiramphus far 0.06 ± 0.03 0.14 ± 0.09 0.08 ± 0.08 0.00 ± 0.00 0.00 ± 0.00 Lethrinus atkinsoni 0.03 ± 0.02 0.06 ± 0.06 0.00 ± 0.00 0.00 ± 0.00 0.06 ± 0.06 Lethrinus lentjan 0.06 ± 0.03 0.00 ± 0.00 0.11 ± 0.08 0.00 ± 0.00 0.11 ± 0.07 Lethrinus ornatus 0.03 ± 0.03 0.00 ± 0.00 0.00 ± 0.00 0.00 ± 0.00 0.11 ± 0.11 Pelates quadrilineatus 0.03 ± 0.03 0.14 ± 0.14 0.00 ± 0.00 0.00 ± 0.00 0.00 ± 0.00 Plectorhinchus gibbosus 0.03 ± 0.02 0.00 ± 0.00 0.08 ± 0.06 0.00 ± 0.00 0.03 ± 0.03 Saurida gracilis 0.13 ± 0.08 0.00 ± 0.00 0.42 ± 0.29 0.00 ± 0.00 0.00 ± 0.00 Scarus frenatus 0.08 ± 0.04 0.06 ± 0.04 0.25 ± 0.13 0.00 ± 0.00 0.00 ± 0.00 Siganus canaliculatus 0.04 ± 0.02 0.00 ± 0.00 0.11 ± 0.06 0.00 ± 0.00 0.06 ± 0.06 Siganus guttatus 0.04 ± 0.03 0.00 ± 0.00 0.11 ± 0.11 0.00 ± 0.00 0.06 ± 0.06 Sphyraena qenie 0.06 ± 0.02 0.06 ± 0.04 0.08 ± 0.04 0.06 ± 0.03 0.03 ± 0.03 Strongylura incisa 0.04 ± 0.02 0.11 ± 0.06 0.03 ± 0.03 0.00 ± 0.00 0.03 ± 0.03 Strongylura leiura 0.05 ± 0.03 0.00 ± 0.00 0.19 ± 0.09 0.00 ± 0.00 0.00 ± 0.00 Tylosurus crocodilus 0.24 ± 0.09 0.22 ± 0.07 0.75 ± 0.31 0.00 ± 0.00 0.00 ± 0.00 TH: seagrass beds dominated by Thalassia hemprichii, EA: seagrass beds dominated by Enhalus acoroides (EA).
MDS ordination of the fish life stages in abundance (Figure 14A) and in DW (Figure 14B) display clear pattern of each stage group. Supporting results of pairwise comparison tests (one-way layout ANOSIM) among all groups for fish abundance showing that all groups were significantly different (R = 0.54 to 1.00, p<0.01). Comparable to the results of abundance data, an additional pairwise comparison tests of fish life stage community composition on DW also revealed significant difference among fish groups (R = 0.52 to 1.00, p<0.01).
Figure 14 Two dimensional nMDS ordination of fish life stage for abundance (A) and biomass DW (B). Juveniles at TH site (S), subadults at TH site ( ), adults at TH site (z), juveniles at EA site (V), subadults at EA site (), adults at EA site ({).
SIMPER analysis indicated that dissimilarities among fish life stages for abundances over the TH and EA sites were mostly above 68%, excluding lower dissimilarity between subadults and adults of TH sites (56.14%). In these cases,
Apogon bandanensis, Atherinomorus lacunosus, Apogon hoeveni, Cheilodipterus quinquelineatus, Lethrinus harak, Liza vaigiensis, Tylosurus crocodilus (some of them were the most abundant species of total fish caught during the study, Figure 9A) were responsible to the dissimilarities (percentage contributions > 10%, Figure 15).
Similar results of another SIMPER analysis among fish life stages for DW over both sampling sites also showed that the lower dissimilarities between subadults and adults of TH sites (66.95%) compare with other dissimilarities that were mostly in the range of 84.57 to 100%. Lethrinus harak, Apogon bandanensis, Siganus canaliculatus, Hemiramphus far, Strongylura incisa,
Gerres oyena were the species that mainly contributed (>10%) to these cases (Figure 16).
Fish Size Distribution
Figure 15 Mean abundance of fishes that most contribute (>10%) to differences among life stages. Error bars indicate standard error of the means.
Figure 16 Mean fish DW of fishes that most contribute to differences among life stages. Error bars indicate standard error of the means.
Table 7 Dominant fish sizes found in the seagrass beds dominated by T.
hemprichii
J = juveniles, S = subadults, A= adults.
Discussion
Seagrass Beds Determination
Thalassia hemprichii and Enhalus acoroides are the most frequent species found in surrounding waters of Kapoposang Island indicating that both of them were the most common seagrass species in the waters of Kapoposang Island, and the results are consistent with the explanation of Tomascik et al. (1997) that both of them were the most common and abundant tropical seagrass species in Indonesian waters.
TH and EA sites, each of them were comprising a different seagrass species composition and minor coral and algae cover, so that both of them have different plants morphology and meadow architecture. It means that those seagrass beds have different structural complexity or heterogeneity.
Family Species
Acanthuridae Acanthurus triostegus 6.5 J 27
Ctenochaetus sp 7 S 18
Cheilodipterus quinquelineatus 5.9-7 S 13
Atherinidae Atherinomorus lacunosus 2.5, 3-5, 6 J 25
Chanidae Chanos chanos 4 J 18
Gerreidae Gerres oyena 3, 6 J 30
Lethrinidae Gymnocranius griseus 3-5 J 35
Lethrinus harak 4-5 J 50
Lethrinus lentjan 3, 6.5 J 52
Lethrinus ornatus 2.4-2.5, 3-5, 7
J 45
Lutjanidae Lutjanus boutton 4 J 35
Holocentridae Neoniphon argenteus 6.5 J 25
Figure 17 Mean fish density of several different size class at TH and EA site. Error bars indicate standard error of the means.
Heterogeneity level (based on number of seagrass species) of site TH was less than site EA (Table 2). This could be due to site TH was located in more wave exposed area compared with site EA, so only certain species could stand with the condition, though, more laboratory works and field testing are required to compare and determine the effect of wave exposures on various seagrass species in several different location.
Environment Characteristics