THESIS
DECISION SUPPORT SYSTEM OF AGRICULTURAL CROPS
AND
APPLICATION OF GEOGRAPHIC INFORMATION
SYSTEM FOR SITE SUITABILITY CLASSIFICATION
(STUDYAREA-
JAMBI PROWNCE, Ih'DONESL4)By:
MIE
MIE
AUNG
P
-36500006/
MIT
GRADUATE PROGRAM
BOGOR AGRICULTURAL UNIIERSITY
Abstract
Assessing the suitability of an area for Ag,rkcultural craps requirt: a considerable
effort in terms of information collection that presents both opportunities and limitations
to decision-makers. A DSS was dcveluped fur specified crops based an 9 criteria of climatic requirements (average annual precipitation and annual mean temperature) and
the quality arid characteristics of land (slope, drainage, soil texture, soil depth, sail CEC,
sail base saturation, and sail
pH).
The Jmbi Province is the case study area. The main objective of this study was to develop a land suitability decision support: system and to determine the suitability classes for selected crops in study area. The methodology wasconcerned to producing polygons included climatic and sail factors; scaring of each
factor coincide with requirements of each crop; grading for the suitability classes based an the total, score and classification of each classes based on thc current land available status. In the system, the user needs to select the most appropriate mnge of each factor (coincide with his soil environment) in the given combo boxes, then at the end of selection it would give the result that is Highly Suitable ($1) when the grade
($1
is equalto I ar Moderarely Suitable (52) when 1 < S
<
= 2 or Marginally Suitable (33) when 2<S
<= 3 or Not Suitable (54) when 3c S <= 4. In Jambi, about 47 % of total m a is notavailable to change its landuse classes; the rest 53 % is moderately and marginally
suitable far each crop. Only about 0.1 % was found as not suitable for any crop. The
resulted suitability sites will be infamed to the
user
via application AgriDSS softwareand WebPages. The next step shauld involve an on-site investigation, Factors such as
water supply, other climatic factors, agronomic practices, or economics that influence the
&cisions of whether land shauld or should not be used for crop production
are
not considered in this assessment.DECLARATION LETTER
I, Me Mie Aung, hereby declare that the thesis title:
Decision
Support
System
Of
Agricultural Crops
And
Application of Geographic Infbrmation
System
for
Site
Suitability Classification
contains correct results from my own work, and that it have not been published ever before.
All data sources and infarmation used factual and clear methods in
h
s
project, and hask n examined far its hctudness,
THESIS
DECISION SUPPORT SYSTEM
OF AGRICULTURAL CROPS
AND
APPLICATION OF GEOGRAPHIC INFORMATION
SYSTEM FOR SITE SUITABILITY CLASSIFICATION
(STUDY AREA
-
JAMB1 PROVINCE, INDONESIA)By:
M E
MIE
AUNG
P
-
365000061
MIT
A Thesis Submitted to the
Graduate School of Bogor Agricultural University, indonwia
In
Fulfiflment of the Requirements for the Degree of Master of Science inInfarmatiu~ Technology far Na t urn1
Resouras
ManagementGRADUATE
PROGRAM
BOGUR AGRICULTURAL UNIVERSITY
Research Title : Decision Support System of Agricultural Craps and Application of Geagraphic Information System for Site SuitahiPty Classification
Student Name : Mie Mie Aung
Studeat ID :
P
-
36500006Study Program : Master of Sdence in Information Technology far Natural Resources Management
This thesis
is approved
by
the
Advisory
Board:
Dr* Ir* Handoka
Supervisor
Mr. ldung ~ h d i y s n t o
Cu-supervisor
Chaiman of the Study Program
ge-s-SC
Dr. Ir. Handoko
r the Graduate Program
AUTOBIOGRAPHY
The author, Ms. Mie Me Aung, was born an March 7, 1973 in Taunggyi, Shan
State, Myanma. She is the eldest daughter OF
U
Sitt Aung and Daw Khin Than Nwe. Asher educational background, she was studied her basic education in No,4 Basic Education
Nigh School, Taunggyi. In 1990, she was passed her high school
in
No.16 BasicMucation High School, Mandalay. She was allowed to study in Yezin Agricultural
University (YAU) in 1993, then she was graduated her Bachelor of Agricultural Science in $996. In 2 W , she was selected as a state scholar to study her master
of
Information Technology for Natural Resources Management in Bogor, Indonesia.As her employment background, she was worked as
sm assistant: supervisor in
My anmar A d c u l twal Service, Thike-kyi Township, Yangon once after graduated. After
that, she was moved to Yezin Agricultural University in September 1997. Start from that time onward, she is working as a demonstrator in Department of Agricultural Botany, YAU until now.
She has k e n experienced with a Workshop an Production and Utilization of
Mycorrhiza that was opened in Center of Agrrculturd Research Institute,
Yezin,
Myanmar
in 1997; a Training on Hybrid Rice Production, Center of AgriculturalResearch Institute, Yezin, Myanmar in f 998; a Training on Maintenance of Cut Flowers, Mngladone Orchid Garden, Mngladone Township, Yangon Division, Myanmar in 1999. In 2001, she was performed as a Lecturer Assistant in Training on Remote
Sensing and GIS Technology for Environmental, System Analysis and Management
@SAM) hat was opened in BTIC, Bogor, Indonesia; as an Assistant in Workshop on Coastal Management and Small fsXand Inventory Using Remote Sensing Satellite System,
BTIC,
Bogor, Indonesia. Moreaver, she got a chance to attend an International Seminar and Exhibition an Information Technology for Sustainable Management of Naturd Resources, which was celebrated in SEAMJZO-BIQTROP, Bagor, Indonesia.In 2002, she was attended some trainings that were hosted
by
the SEAMEO- SEAMQLEC, Jakarta, Indonesia, They we Hands-an Training in the Production of Weband CD Based Interactive Multimedia Learning Progs:ms for Online Access, Training on the Utilization of Internet far Instruction and Training Purposes, Regional Training Workshop on Web Based Course Development Using WeKT. She was dso joined with
a Seminar on Towards a More Effective Management of Open and Distance Learning; System held in SEAMEO-SEAMOLEC, Jakarta, Indonesia,
This thesis was come out after two-year study in MIT program. Finally, she
qualified for s S E M O - S E A R C A scholarship fur the MSc in
l
T
for Natural ResourcesManagement p r o p m e hosted by the Bogor AgriculturaI University (fPf3) and based at
Acknowledgement
In the Name of the Most Mercifil God, we begin. 0 Ever-
Living, 0 Eternul One, by Your mercy I seek Your help, Q Allah, I seek refige with You from distress, grieJ: ittcrrpucify, kuziness, miserliness, cowardice, the burden of debt and from being overpowered by men,
It has been almost two years for my mastering in Infomation Technology for
Natural Resources Management, but
X
have at Xeast reached the finish line. I assure that 1 would not be able to get ithe goal of my study here unlcss you were there, It isimpossible fur me to acknowledge all of you individually here, but my sincere
appreciation is nuEd for dl who grrat1y contributed to improvement of the research.
Start from very beginning, my appreciation gms out to my country, Union of
Myanmar, for allowing me to study the Master degree in abroad as a state scholar.
ConsquentXy, I am greatly indebted to all responsible persons from the scholarship
organization SEAMEO-SEARCA for heir financial assistance for overall expenses
during the wble study period in MIT study program under Bogor Agricultural
University, Indonesia,
Firstly, I would Iike to express my genuine &ank to supervisor Dr. Hmduko,
MIT study program Cuurdinator, for his insightful suggestions, comments, and
constructive critique. Not only his worthwhile guidance on this research but also his
tips on thinking of life in positive ways have made me discharge from all stresses
throughout the development the research. Research under his supervision has k n a
rewarding experience.
Furthemure I would like to tbank my co-supervisor Mr, Idung Risdiyanto, lccturer in Bogor Agricultural University, who aided me greatIy with his insightful
explanations and literatures he supplied me. I have got much more experience on
madeling using visual basic programming language via him for airnost half of this
master study period.
My appreciation gues out to entire resmrch group at BTIC, especially to
AGRISOR, WAIDO, and LUCC organizations, not only for supporting necessary
spatial and nun spatial data of study site Jmbi but also far heir compassionate hands
thrwughout my research period. They never blamed for my harassment by going in and
Mr.
Ir.
Y, G. Armando (M,S), Lxctarer from Agricultural Faculty, J m b i University, far their willingly checking and verfying my data thatX
have been used in this research.I am thankfully acknowledged a11 staffs horn MIT study programs, fw intimately concerning and treating me like a relative throughout my study period. Everybody has been kind enough for letting me to be here cheerfully, making me stronger and stronger spiritually, and all t h e monument events wauld always be on my mind.
Within the same campus, SEAME0 BIQTROP head office is not forgettable.
AX1 chase generous staffs from tkac headquarters are always h i n g ready to give a
helping barid to MlT students. The only library was a special place where I have hen
most but I am sure that I would not be there without glory of Librarian and other staffs.
A pretty woman who we address I i k Ibu Xn&a was really like a mother and has given
me strength; you are deferential with the ability of salving problems well an the s p t , Moreover, I wauld like to express my profound gratitude to the external
examiner
Dr.
Ir. Muhamad Ardiansyd, Lecturer, Dept. of Soil Science, Faculty of Agriculture, Bagor Agricultural University, who made my thesis acceptable with a lotof valuable discussions and comments on the find presentation day.
I wish to thank my friends, and fellow students Mr. Ismail bin Hj. Hashin from
Malaysia, Mr. Puvdol l h y d e e from Thailand and Mr. Josemari
B,
Gonzales from Philippines fur their dedicating many hours listening to overall affairs within two years.Their interaction has helped mc clear my cbougbts and is highly vdued. All MIT students fram junior batch were also k here with me b ask my progress, to give me a
helping hand with a cute smile, to allow me keep on full courage so haw I can stay
without thanking all of you. Moreaver, I would like to appreciate all friends who were concerned all a b u t me physically in person and emotionally via letters by post and also
via online while I studying in Indonesia. Among &em, Naung Naung is the most
understandable and adorable, and I have considered you as my best friend forever.
Finally, but not least,
X
wish to express my gratitude to my parents and family fur their invariable love and invaluable encouragement throughout &e whole life. Whoever says who is the best, nobody is comparable and substitutable with you. 'ffound strength through the support and rriissurances of my parents,
U
Sitt Aung andDaw Khin Than New, and my sister Ni Ni Aung. I feel very auspicious to have such a
strong, suppurtive and loving family. Unfortunately 1 have got a great chance to
TABLE,
OF CONTENTS
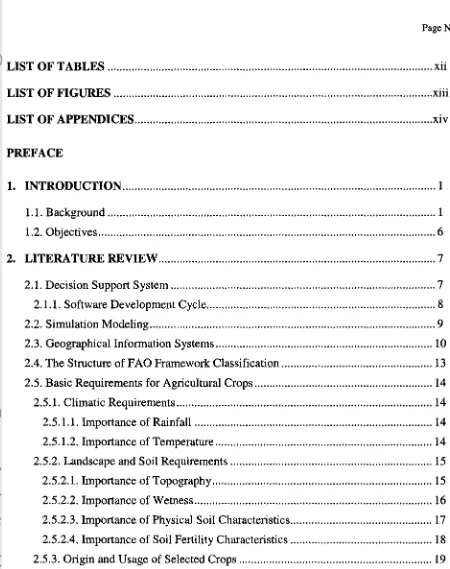
Page No
. .
LIST OF TABLES...
xn
... LIST OF F I G U W
...,...
...
xmLIST OF APPENDICES ...4...,...a...a....
...
xiv...
....
.
1
.
1.
Background...
., ,.,..,....
,,, 11.2. Objectives
...
62
.
LITERATURE REVIEW...
72.1
.
Decision Support System...
,......
72.1.1. Software Development Cycle
...
,....
. . 82.2. Simulation
.
.
.
.
.
.
.
Modeling.
.
.
.
.
.
.
.
...,....
.
.
.
.
.
.
.
.
.
.
,,.
..
92.3. Geographical Information Systcrns
...
..,...
102.4. The Structure of F A 0 Framework Classification
...
,
.,
...
132.5
.
Basic Requirements for Agricultural Crops...
.,...
I 42.5.1. Climatic Requirements
...,,...
.
14 2.5.1.1. hpartance of Rainfall...
142.5.1.2. Importance of Temperature
...
14 2.5.2. Landscape and Soi t Requirements...
,...
152.5.2.1. Importance of Topowaphy
...
152.5.2.2. hpartance of Wetness..
... ..,
...
16 2.5.2.3. Importance of Physical Soil Characteristics...
172.5.2.4. hporrance of Sail Fertility Characteristics
...
.,...
18...
3.1 Materials 26
3.1 .1
.
Time and Location...
26...
3.1.2. Necessary Data
2 7
...
3.1.3. Sources of Data 27
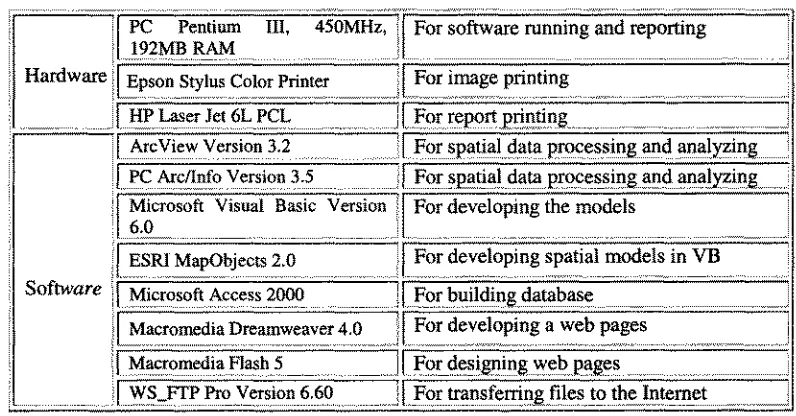
3.1.4. Required application hadware and software
...
28...
3.2 Methods or Methadology 28
...
3.2.1. Schemes af Research 28
...
3.2.2. Method of Suitability Analysis
.
.
.
.
...
29...
3.2.3. Data Reparation 32
3.2.3.1. Preparation of Rainfall polygons
...
3 23.2.3.2. Preparation of Temperature polygons
...
34...
3.2.3.3. Reparation of Slope polygons 34
3.2.3.4. Reparation of Drainage polygons
...
.
.
...
.
.
...
3 5 3.2.3.5. Preparation of Sail Texture polygons...
35...
3.2.3.6. Reparation of Soil Depth polygons 36
3.2.3.7. Preparation of Soil CEC polygons
...
35...
3.2.3.8. Preparation of Soil Base Saturation polygons 37...
3.2.3.9. Preparation of Soil
pW
polygons 373.2.4. Method of Scoring in the Attribute with all criteria
...
38 4.
KESULTS AND DISCUSSION...
39. .
...
4.1. General Descnpbon 39
4.2. Classification of Land Suitability for Selected Crops
...
39...
4.2.1
.
Scoring for Rainfall Factor.. 40...
4.2.2. Scoring for Temperature Factor 41
...
4.2.3. Scoring
fur
S l o p Factor 41...
4.2.4. Scaring for Drainage
Factor
. 4 i...
4 - 2 5 Scaring for Soil. Depth Factor 41
...
4.2.6. Scaring for Sail Texture Factor 42
...
...
4.3.8. Scahg for Sol1
Base
Saturation Factor 42...
4.2.9. Scoring for Soil
pH
Factor 42...
4.2.10. Suitability Analysis based on Total Scores 43.
...,...
4.2.1 1 Suitability Classification based on Recent Land Classes 44 4.3. Suitability
Classes
for each selected crop...
49
...
4.4. Graphical User Interface for
Land
Sui~dbility C1assificatio n. 474.4.1. GUI fur Weather Model Farm
...
484.4.2. GUI for Suitability Decision fur Spcificd Crop Farm
...
50...
4.4.3. GUI
for
Map Display Form 524.5
.
Building Website for the DSS af Agricultural Crops...
555
.
CONCLUSIONS AND RECOMMENDATION...
56...
5.1. Conclusion
...
., 565.2. Recommendation
...
57LIST OF TABLES
Table 2.1. Equivalences between percentage gradient and degree of slope angle
...
16Table 2.2. The approximate base saturation for the soils of a given soil
pH
...a-
19 Table 3.1. Lists of Hardware and Software...
.
.
...
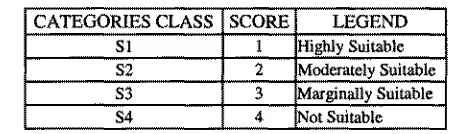
28 Table 3.2. Structure af the Suitability Classification...
30Tinble 3.3. Relations between Suitability grades and classes
...
30...
Table 4.1. Suitability Grading Method 4 3
Table 4.2. The sample =suit table from weather model (Daily)
...
50Figure 2.1. Primary Components of Evalutianruy Development of DSS with
Iterative Prototyping of Specification and Design
...
9 Figure 2.2. Major Data Sources for GIs...
11...
Figure 2.3. GI3 for Decision Support 12
...
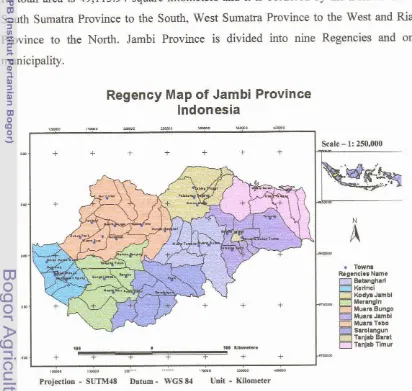
Figure 3.1. Map of the Study Site 26
Figure 3.2. Research Flow Diagram
...
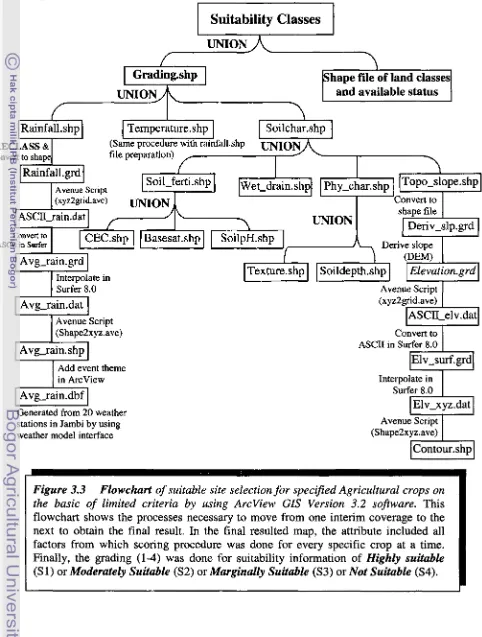
2 9 Figure 3.3. Flowchart of Suitable Sitc Selection Mcthad...
31...
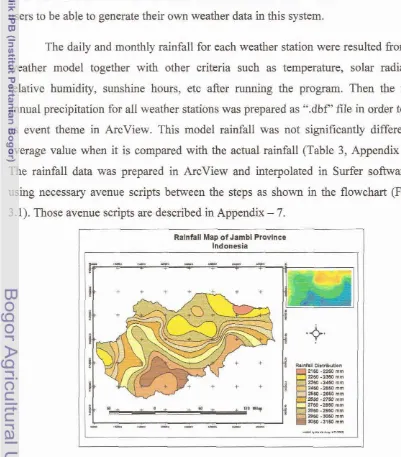
Figure 3.4. Isoh yets in Jambi Province 33
Figure
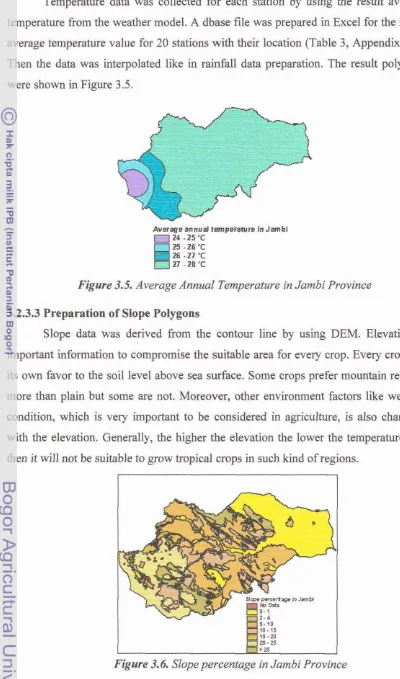
3.5.
Average Annual Temperature in Jambi Province....
3 4 Figure 3.6. Slope percentage in Jarnbi Province...
34Figure 3.7. Drainage Properties in Jambi Province
...
35...
...
Figure 3.8. Soil Texture in Jambi Pravince ., 36
Figure 3.9. Sail Depth in Jmbi Province
...
...,...
,.,,...
36Figure 3.10
.
Soil CEC Constituents in Jambi Province...
,.....
37Figure 3.1 f
.
Soil base Saturation Percentage in Jmbi Province...
37Figure 3.12. Soil
pH
in J m b i Province...
...,,...
...
38 Figure 4.1. Suitability grading procedure in ArcView GIs Software...
43Figure 4.2. Land Suitability Classes for
Rubber
...
44Figure 4.3. Recent Land utilization status in Jmbi Province
...,..
.
45Figure 4.4. Recent Land classes and suitability information for Rubber
...,,...
46 Figure 4 5 Flowchar! for the Main farm of DSS for Agricultural Crops...
47 Figure 4.6. GUZ for Main Farm...
...,,... ...
48Figure 4.7. flowchart for the Weather Model Form
...
49Figure 4.8. GUI for weather mo&l before and after running the program
...
49Figure 4.9. Flowchart. far the Suitability Decision for Specified Crops Form
...
51Figure 4.10. GUZ for Suitability Decision for Specified Crops Form
...
52Figure 4.11. flowchart for Map Display Form
...
53Figure 4.12. Jambi Map Display Form ... 53
Figure 4.13. Map Display of Suitability Classes for Cassava
...
54LIST
OF APPENDICES
APPENDIX - 1 CROP REQUIREMENT TABLE
...,,.. .
...
1 of AppendixX
APPENDIX - 2 MAPS AND ATIXlBUTE TABLES
OF
LANDCLASSES AND SfJffABlLZTY PERCENTAGE FOR
EACH CROP
.
...,..
.,,..,,..
,,..,. . . .
.
1 of Appendix 2APPENDIX
-
3 SCRPT FOR MAIN FORM...,..,,..,.., ,...,.,,..,...
1 of Appendix 3 APPENDIX - 4 SCRlPT FOR WEATHER MODEL FORM... ... ...
1 of Appendix 4APPENDIX
-
5 SCRIPT' FOR S'tJTTABILRY DECISION FURSPECIFIED CROPS FORM
...,,..,...
,...,.
.,.. .
1 of Appendix 5APPENDIX - 6 SCRIPT FOR MAP DISPLAY FORM
..,...,..,..,..
,.. 1 of Appendix 6 APPENDIX-
7 AVENUE SCRIPTS...
1 of Appendix 7APPENDIX
-
3 CURRENT PLANTATION IN JAMB1..,
.. . .
. . .
. . .
. . .
. . ..
1 of Appendix 8APPENDIX
-
9 SAMPLE ATTRBUTE TABLEOF
SUITABILITYPreface
The Earth has
been
created for many special purposes. Among those purposes, it is being the main source to give foods fur plants from which the world people are getting foodsfar
their Xife. With the increasing realization of the importance of agriculture as anecessary source for our living, there is a growing enthusiasm m n g us to lean it
deeply, In view of this, a Decision Support System P S S ) was developed based on the bac kgroilnd h o w Xedgc and references on integration with Information Technology. A
system is necessarily needed to simplify in order to be useful for many people at the same
time with stumpy consumption of time and energy. A11 basic necessary criteria were.
referred from the F A 0 land evaluation methods and crop requirements guide
book
fromITC Ghent. This study investigated the suitability site far some tropical and subtmpical
crops on a global basis by mudding, and Jambi Province was selected as case study ma by using GIs,
The objectives of this research are:
-
1,
To
develop a land suitability system of selected agricultural crapsbased
an the F A 0 land evaluation methods and crop requirements guidebook of ITC Ghent, 2, To determine the land suitability classes for each selected crop based on thespatial, data of crap requirement criteria in thc case study m a by using GIS.
3. To develop a computerized Decision Support System (DSS) comprising of suitability site spatial information, the weafier model and a graphic user interface (GUI) shell to assist policy makers, planners and researchers who involve in planning and promoting various cammercirtl flora production at the provincial level.
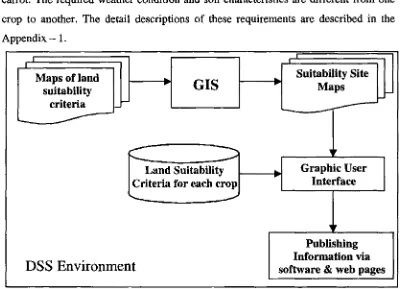
There are three major tasks: (1) developing a DSS of selected agricultural crops
based
an crop requirement factors by using Visual Basic Programming Software, ( 2 ) practicing the suitable site selection based on maps of those criteria for each crap in GISenvironment for case study area, and (3) incepting the resulted suitability information of study area in the DSS in order for the user to learn via the system software package. The crap requirement factors and their necessary range in each suitablli ty level were collected
and
prepared as input data far the system. The scares were calculated by giving 1 to 4 for Highly suitctlrle (S 1) ta Not suitable (S4) level respectively far each factor. The final score was averaged fram the total scare and assigned asS
1 when the find scare wasequal to 1; as S2 when the scare was greater than f and less than or equal to 2; as 53 when the scare was greater tkan 2 and kss than or equal to 3; and as S4 when the score was greater than 3 and less than or equal to 4.
In GIS environment, the climatic factors wcre gemrated from the weather model and shape files for temperature and rainfall were prepared by using Arcview GIs
software. Other soil factors shape files were prepared separately based an the mailable
same file and attribute by using Geoprocessing wizard in Arcview. Scoring was dune for
each crop by using Map Query and Map Calculator on the needs. Firstly, the result was
given in polygons with their suitability levels. It was then analyzed by using recent land
classes and availability status map so that the final suitability classes could
be
resulted.According to the result
for
each crop, it was concluded that the study area is suitable for aparticular crop at Moderafely srci3able (S2) and Marginally srcikble (S3) level in most case. Suitability percentage is different. far S2 and 53 of a specified crop, Same crops have higher percentage of S2 than that of S3, fax example - estate crops Iike rubber,
cocanut and ail palm are mare suitable than other horticultural crops like onion, cabbage, and carrot in Jmbi.
The resulted suitability infomation maps and some database a b u t study area
were prepared in Graphic User Interfaces by using ESRI MapObjects Tool and MSflexgrid Tool in VB programs. The weather model form, DSS form and Map display
form were linked in rhe main form and it was created as an application software package then it can be run in every computer after installing it, The users are informed by the
system that their particular lucatians are falling in which suitable level in growing a
certain kind of crop. Moreover, the users can learn and download the requirement factors and brief descriptions for each crop, the result suitability infarmation and other
database of case study area through Internet. The web pages wem uploaded to the BXUTROP sewer by using WS-FTP Pro Version 6.60 Software and the site address is
1.1 Background
For agricultural processes, conservation production systems must be implemented to ensure the long-term sustainability of thc soil resource, and in rum the sustainability of agriculture, Producers need sound advice and accurate information on all aspects of their
farm aperations in order to make appropriate conservation farming decisions while also
maintaining the economic viability of their operations, To deal with the many complex issues and numerous alternatives available, thcy need access to available information as well as access to multiple experts, When we we going to deal with information twtmmlagy field and agriculture field, we must know the background knowledge of agriculture well so that we can be able to inkgatc those basic cognizances with infomatian technology atmosphere canvenien tl y.
The Decision Support System (DSS) is playing an important role in decision-
making, The target is to choose the best decision with the lowest risk also based on the knowledge of evaluation of public policy by using the logical, mathematical and
phenomenological models. It is important to understand well about the nature of decision- making
such
as decision structure, saurcc of information, accuracy of information and scope of decision. A decision support system is a computer program that combinesinformation, knowledge, and human expertise, and interacts with the user to provide
support for decision-making (Bentham, 1992).
DSS is also an approach to development, application and analysis that leverages the community's complementary talents and resources in order to set new standards fur quality of science and reliability of application of agicuXtura1 models. The resulting comprehensive system f u m s the foundation that the community, including governments,
&pa, topology, soil type, sail water content, evaporation rates, climate data etc., as well as
multi- criteria, optimization, habitat analysis, plant growth, andlor yield prediction models
into one system.
The concept of a DSS has evolved aver the last 10 years. As other camputer-based
tools have developed, the potential for integrating a widc range of information sources has
become obvious. These include simulation models, expert systems, databases, graphically-
oriented systems such as gcagraphic information systems (GIS), remote sensing, remote networks, and so on, n u s , the term DSS now encompasses systems that range from tools that assist with a well-defined problem area to those which are open-ended in their application, from programs that are pure expert systems or sirnulatian models to those which combine many approaches, from systems which q u i r e a computer and trained users to those which stimulate interactions between mangers at a sacid level. All have the common god of improving decision making and providing users with the means to assess alternative outcomes against each other objectively and comprehensively than could be done previously.
Decision makers must intepte information an climate, soils, vegetation, animals,
economics, and politics in making their decisions, and they must do this across a
heterogeneous environment. At each level, these factors fall into a hierarchical order, dependent on scde in time and space. Wcisions should aim at, sustainable land use, which
means optimizing productivity within the constraint of avoiding land degradation. h d
degradation, or desertificatian, can be defined as the lass of potential productivity, where the measure of productivity must be related to the goals of land use. Degradation can
occur at dl Ievels of the production system by altering the ability of the land to respond to climate, changing soil characteristics through hoof impact or erosion, altering vegetation
composition through inappropriare timing, even degrading the economic viability of an enterprise through the use af undesirable gcnetic stack or ill-advised financial decisions.
En determining
what issues are important to decision makers, it is also important to recognize that theoretical and real priorities may also differ for each of these levels of use,sustainable viability of management systems, in practice, policy decisions inevitably need to
bc
able to take account af political constraints, Similarly, individual managers mayespouse long-tern sustainability as a preferred goal but still have to c o p with meeting
debts, sending tire
kids
to school, or just wanting a particular lifestyle, Wany of these factors are imponderables that cannot be handled directly by a DSS, but the recognition of their existence can help with appropriate dcsign approaches, interface design, and withtraining and implementation.
Finally, there is a hierarchy of scales far decisions, especially for palicy makers
where decisions range from regional though state to national and even trading block or
global levels. h a simpler sense, individual managers too may be concerned abut a single enterprise or may
bc:
part of a larger multi-enterprise or rnultilocation concern. In general, as the scale gets larger, extrinsic constraints change into management must consider. Asthe unit becomes larger, these factors become more controllabk. A DSS that is appropriate to one scale of decision-making may be very inappropriate to another, since DSS is concerned with efficient model links between input and outputs and should, therefare, abstain unnecessary details that require greater data collection and efforts in validation, The DSS projat must identify the different perceptions, priorities, and
problems correctly and target them appropriate1 y.
Models are, a widely used instrument in science when complex problems and
complex systems are under investigation. It is impossible to solve a quantitative model,
which represents a system with many variables in equations, by using normal algebra or calculus; managed systems are too complicated fur that We therefore make use of
sirnulation, meaning that we will create a set of equations to represent the system and tfim
allow the equations to run forward in simulated time to attempt to mirror the behavior of
the real. system as it runs furward in real time, In principle, one could nun the equations fuwrnrd by pencil and paper calcuf ation; in practice, a computer and specialized software
Land suitability is the appropriateness of a given type of land for a specified use. The land may be considered in its present condition or aftcr improvements. The process of
land suitability classification is the appraisal and grouping of specific areas of land in
terms of their suitabiiity for defined uses, First, the structure of the suitability
classification should
be
described and then followed by an account of the range ofinterpretative classifications recognized: qualitative, quantitative and of current or potential suitability, A specified crop can be cultivated with respect to each kind of land use that appears to bc relevant for the m a .
It is necessary to forecast the benefits to farmers and the national econumy and whether these will
be
sustained without damage to the environment. Essentially aclassification of potential suitability is required which takes account of future interactions
between sails, water, craps and econamic, social
and
political conditions.Some
factors chat affect land suitability are permanent and others are changeable at a cost. Typical examples of pmment features are temperature, sail texture, depth to bedrock and macro- topa~aphy. Changeable characteristics that may be altered deliberately or inadvertently typically may include vegetation, salinity, depth of groundwater, and same social and economic conditions (e.g. land tenure, accessibility).Land
suitability must therefarebe
assessed and classified with respect to specifled kinds af land use.
It is evident that an interdisciplinary approach is required, because no one
discipline can cover all aspects of land suitability evaluation. Land evaluation can
be
carried out: using general. economic considerations to establish a context for sclectcting
appropriate crops and management, and to establish the criteria for boundaries between
suitable and unsuitable land. To make a quantitative evaluation at project or farm level, however, requires formal analysis in financial and economic terms. h d evaluation is an
iterative process leading to successive refinements and the need for surveys and investigations that are appropriate in scale and intensity during the different stages from recamaissance to detailed project planning, and thereafter in successive phases of project implementation.
Simulation is a kind of modeling which is useful for wide range of problems and
very good data, or very little data. It has important implications for disciplines such as swial anthropology that are basically non-experimental, providing a means of exploring
problems which could never be observed to order. Simulation is not a panacea for all of
our problems, but it can be an important tool fur the social researcher aware of its
limitations.
Agricultural management can be a daunting task because so many factors must
be
taken into account. Agricultural decision making involves understanding not only the immediate impact of human activity an the various crops, issues regarding soil conservation, climatic condition, economic costs, current and pending regulations, fairness, and a host of others. In principle, all of these interrelated factors have a bearing on any decision related to the agriculture and its environment. A good design should avoid
lucking the project into a rigid solution with little flexibility or adaptability in case problems occur later an or changes in the enviranmcnt &mand changes in project pcrfamance or effectiveness,
Geographic Information System is any manual or computer based set of procedure
used to store and manipulate geographically referenced data. As
GIs
is a computer-basedsystem, we need four sets of capabilities that arc inputs, data management, manipulation
and analysis, and output to handle geareferenced data. It is also st powerful tool for handling spatid data. Generally, a GIS project can be organized into a series of logical
steps, each of which builds upon the previous one, Many GXS projects need to follow a similar sequence. However many considerations influence the design and implementation of a specific project. Before stating the project, it is impartant to determine the objectives of the project. We need to consider what the problem is to be solved, how it: is salved,
what the final products are, how these products might frequently be generated, and so on. These issues affect the scope of the project and its implementation.
ArcView is a powerful deskap geographic information system (GES) made by
Environmental Systems Research Institute, Inc. (ERSf). With Arcview, any data that: is linked to geographic locations can
be
loaded and displayed it graphically as maps, charts,questions or to meet certain criteria, and the information can be analyzed statistically as
well as spatially. Then the results can be shown as quality graphic presentations to print
out or display on the screen.
1.2 Objectives
1 . To develop a land suitability system of selected agricultural crops based on the F A 0 land evaluation methods and crop requirements guidebook of ITC Ghent. 2. To determine the land suitability classes for each selected crop based on the
spatid data of crop requirement criteria in the case study area by using GIs.
3. To develop a computerized Decision Support System (DSS) comprising of suitability site spatial information, the weather model and a graphic user interface (GUI) shell to assist palicy makers, planners and researchers who involve in planning and promoting various carnrnercial flora production at the
provincial
2.
LITERATURE lREVIEW
2.1 Decision Support System (DSS)
DSS is a process of choosing mong alternative courses of action for the purpose
of achieving a god that consists of the following components: Data Management
Subsystem, Model Management Subsystem, Dialog Management Subsystem, and Knowledge Management Subsystem. Because of the interaction among the multitude of factors affecting a complex decision, it is essential to identify the important ones and to
determine the degree to which they affect each other before a clear decision can be made.
Based on the issue of how to structure a complex situation, identify lits criteria and other factors whether intangblc or concrete, it can be measured the interactions among
them
ina simple way, and can also
be
synthesized all the information to obtain priorities. The priorities can then be used in a hnefitlcast setting to devdap portfolios of activities, one af the major concerns of corporations, government and other organizations with differentgoals and purposes, (Turban, 1988).
A DSS does not necessarily attempt to model the derails of the human interaction
with the biological and economic system, but rather to model the inputs, the outputs, and parameters that are likely to affect which alternative is implemented (Gillad and
Monypenny, 1988). Computer-bssed DSS aim to
be
flexible, with integrated software foraccessing, retrieving, and generating reparts
on
database information, as welt as kingable to accommodate simulation and decision models for conducting further analyses
including alternative testing, sensitivity analysis, and automated goal seeking (Belew,
1985; Covington et al., 1988). A true DSS has the added flexibility af allowing users to define new relationships mong decision variables (Caaney, 1986) so that users have the freedom to analyze decisions in a manner not anticipated by system designers; however,
many DSS do not cumntly p m i t this capability.
DSS are a valuable mechanism for organizing infurmation in a way that allows
and perception son the planning process (Stuth et al., 1990). DSS thus have a special
capability to aid problem solving in selection af suitability area fur agricultural crops.
In
such selection, it encompasses a particularly wide range of issues appropriate to DSS solutions, thus making them a focal point when discussing uses of DSS. In this thesis, the
practical application of these points will be illustrate by showing haw different types of
systems can be linked in DSS to handle very complex questions.
Improved political decision making and better on-thc-ground maxxagemcnt can
only result from more objective, consistent, and timely information about: the issues
involved, DSS aim to integrate very different types af information into a cumman framework; they seek to provide assistance in the context of the special features of
individual decisions rather than generating generalizations, and, above all, the development of DSS focuses an understanding which decisions we important to different
users. Infomation must be organized to
be
of value, whether at the individual or policyIevel of decision-making. With the advent of computer technology and the exponential expansion of infarmation about: natural resource management, DSS has helped provide a logical framework fur this organization (Stafford Smith and Faran, 1988, 1990; Stuth et al,, l99Q). DSS also assist managers in dealing with complex planning problems and in selecting appropriate technology. DSS in natural resources are similar to rhose in other
businesses in that they are designed fox a specific problcm ma, they incarporate
specified planning horizons, and they guide decision-makers through a process of logical planning and assessment of alternatives (Taylor and Taylor, 1987).
2-1.2 Software devdopment cycle
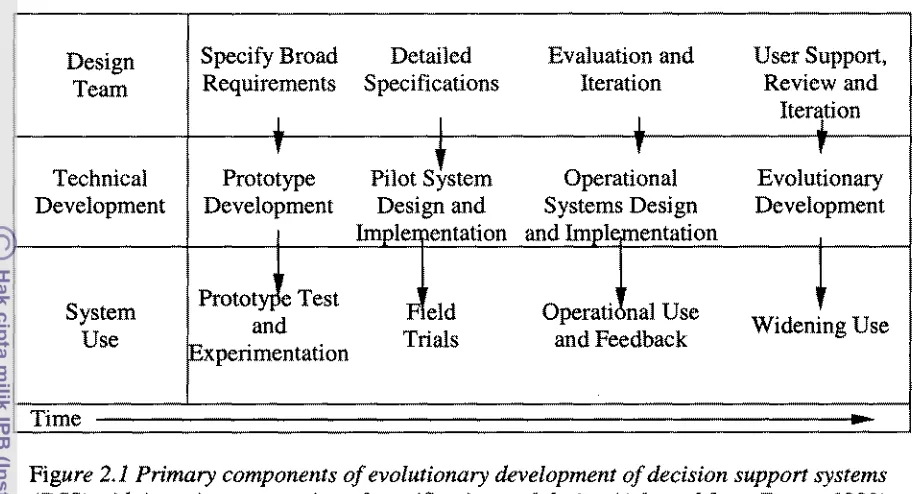
Eason f 1988) recommended an evslutianary devebprnent of
DSS
with iterativeprototyping of specification and design (Figure 2.1). The guidjng principle is the creation
of opportunities for learning from practical experience before major design decisions are
taken. This procedure minimizes the need for major commitments to technical developments in the early stages of development while allowing the users considerable opportunity to see and test what, could be provided, thus allowing them to arrive at a
Figure 2,1 Primary components of evolutionury h e l o p m e a t of decision support systems
{DSS) with ifem five prototyping of specificabba and design (Adapted from Eason, 1988)
Design
Team
2.2 Simulation Modeling
Specify Broad Detailed Evaluation and User Support,
Requirements Specifications Iteration Review and
1
I J IterationThe core of many DSS will always
be
good simulation model, varying fromsimple spreadsheet-style aids to complex mpresentations of system function where the data and the understanding exist. To maintain credibility with the more complex
hydrological, plant growth, and other environmental models, developers will need to pay
greater attention to controlling model campXexity far the sake of users and their input data needs while maintaining the quality and integrity of results. A more explicit hierarchical
approach to developing simple application models for specific areas
fram
more complexand
generalized research models maybe
one necessity. Good model validation and verification will certainly be another. The first step in model building is to state clearly the specific objectives of the modeling effort. Once the modeler has a clear understandingof the problem and objectives to be accomplished, other important design questions can
be
addressed, such as what types of dava are available, what kinds of inputs willbe
required, what kinds of output will be required to meet the objectives, and what the intended use of the model will be. The answers to these questions will guide rhe modeler's approach to meeting the objectives (Gillard ef ak, 1988)
Technical
Development
v
~rorotype ~ l a t &tern Operational Evolutionary
Development Design and Systems Design Development 1 Impleqentatian
and
hplqnmtation ISystem
A
and Feedbac tck
Operati nal Use Widening Use
Use
Simulation can & defined in either a broad or narrow sense, In the narrow sense simulation is a model where we are attempting to describe thc behavior of a system by
incrementally and interactionally applying a number of models against some starting
situation. In the broader sense, ir is any kind of computer model within which some
structure is being modified along one or mare dimensions.
In
the usual case one dimension is time, but this is neither sufficient nor necessary for a simulation; it is themodeling
of any complex system where observation of change, or an incrementalprocess, is central. Traditionally simulation has been a technique used for quantitative
analysis. As with computing techniques in general this is due to the historical development of computing and constraints on our knowledge of haw to represent. models
and infomation af a qualitative and symbolic farm. Designing a simulation involves
translating the essential aspects of preexisting models into a fom chat can be
implemented an a computer so that monitor the interaction of the models can be monitored. Simulations usually require programming of some sort since any computing
language has a limited set of resources available for representing dara, information,
relationships and transformations that can be applied. As a specific problem comes along with a researcher, it i s important that the design devclup according to the needs of the
research, and not from the needs of the computer. So it is better to make the simplifications and compromises at the later stages rather than the earlier :roes of the
design. In this way the requirements can
be
considered in det'ail, and can better judge howto solve the more mundane problems uf implementation. (Fischer, 1996).
2.3 Geographical infarmstian Systems (GIs)
Geographic Information System (GIs) is a computer-based system used to stare
and manipulate geographic information, 'It is designed fafor callectian, storage, md analysis of objects and phenomena where geographic location is arr important: characteristic or critical to the analysis (Aranaff, 1991).
G S
is defined as an information system that is used to input, store, retrieve, manipulate, analyze and outputgeographically referenced data or geaspatial data, in order to support decision making for planning and management of land use, natural resources, environment, transportation, urban facilities, and other administrative records. A computer system for GIS consists of
analysis, modeling and display of geospatid data, The sources of geaspatial data axr: digitized maps, aerial photographs, satellite images, statistical tables and other related
documents (Figure I ) (Murai, 1996).
Analog M a p
Figure 2.2 Major data sourcesfor GI5 (source: Murai, 1996)
Geographic infamation can be represented with geometric infarmatian such as location, shape and discribubon, and attribute infomation such as characteristics and nature, Vectors and raster farms are the major representation models for geometric information. Most objects on a map can
be
represented as a combination of a point (or node), edge (or arc) and area (or polygon), which are vex tor farms. A point is represented by geographic coordinates. An edge is r e p ~ s n t e d by a series af line segments with astart point and an end point. A polygon is defined as rhe sequential edges of a boundary. The inter-relationship between points, edges, and weas is called a topo1ogicaI
relationship. In the raster form, the object space is divided into a group of regularly spaced grids (pixels) to which the attributes are assigned. The raster form is basically identical to the data format of remote sensing data (JARS, 1993).
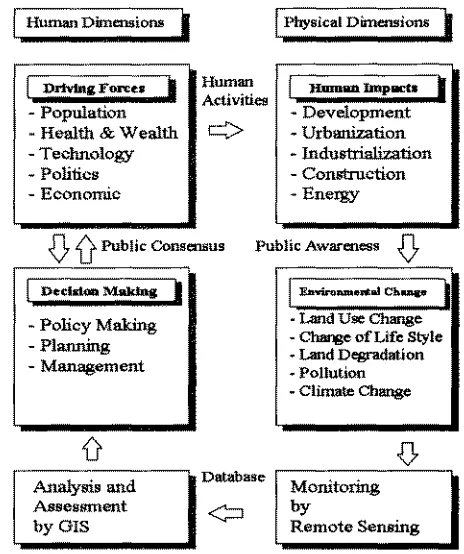
GIS can be a very important tool in decision making for sustainable development, because GIs can provide decision makers with useful infomation by m a n s of analysis
and assessment of spatial database as shown in Figure 2. Decision-making including policymaking, planning and management can be interactively implemented taking into consideration human driving farces through public consensus. Driving forces include population growth, health and wealth, technology, politics, economics etc. by which
human society will set up targets arid gods on how to improve thc quality of life.
models for different purpose like the flow of water, crop growth, soil erosion, nutrient
and pesticide leaching. GI$ helps in integriating geographical, drnta on various aspects such
as soil, crop, weather and field history along with simulation models. Another aspect of
CrIS support to precision adculture is the engineering component, in which the research
findings are translated into operational systems for use at
farm level.
GIS can support thisengineering activity by providing a good platform far starage of base data, simple modeling, presentation of results, development of a user iinterhce, and, in combination
with a W S , controlling the navigation of farm.
On
the basis of GIs, a decision supportsystem can be developed for operationalisation of precision farming at f m level (Bregt,
-
Lrrdu-tion- C o n ~ c t i o n
-
E n e wuus Public Awarmaa
Cr
-
r n d use c h i g e- C h g c of Life Style
-
h n d Degradation-
Pollution-
Climate change [image:137.607.211.443.301.578.2]Remote Sensing
Figure 2.3 GIS for Decision Support {Source: Murai, 1996)
Many farm information systems (EIS) are available, which use simple programmes to create a fann level database. One example of such FIS is LURfS (Local. Resources Information System) consists of several rnudules, which enable the data import; generation af raster filcs by different gridding mcthods; the storage of raster infomatian in a database; the generation of digital am-resource maps; the creation of
2.4 The structure of the
F A 0
framework classificationT h e F A 0 Framework indicates that: it is necessary to evaluate land and not just soils. The suitability of soils for irrigated crops is useful information but it is inadequate
for
making
decisions about land use development. Therefore all relevant landcharacteristics including soils, climate, topogmph y, water resources, vegetation etc. and
also socia-economic conditions and infrastructure need to
be
considered. According to the FAO, four categories, namely Orders, Classes, Subclasses and Units are recognized inthe FA0 Framework classification (FAO, 1985):
1, Land Suitability Orders reflect
kinds
of suitability (i.e, Suitable and Not Suitable);Suitable land is land an which sustained use of the kind under consideration is expected to yield benefits that justify the inputs and development: casts, without unacceptable risk of damage to land resources. Not Suitable indicates that: the land has qualities that appear to preclude sustained use of the kind under cansi&ratian.
2. Land Suitability Classes reflect degrees of suitability within Orders (i.e. S1, 52,
53, N 1 and N2);
a. Class $1, Highly Suitable:
Land
has no significant limitations to sustainedapplication of a given use, It may include minor limitations that will not
reduce productivity, benefits or costs b l o w the lower boundary set for the
class.
b. Class 52, Moderately Suitable: Land has limitations that in aggregate are
moderately severe far sustained application of a given use. The limitations
may weducc physical productivity, benefits or costs camgarcd with S1 land to a lower limit set far thc class.
c.
Class
$3, Marginally Suitable: Land has limitations which in aggregate aresevere for sustained application of a given use and will so reduce physical
productivity, benefits or casts that the expenditure will only be marginally justified.
d. Class.
NX,
Marginally Not Suitable: h d is marginally not suitable and has limitations that maybe
surmountable in time but which cannotbe
corrected with the existing knowledge or under present social conditions
e, Class
NZ,
PermanenB y Not Suitable: Land is permanently nut suitable for the given use usually because of physical limitations,Classij5cation of Currerat and Potential Suitability: A classification of current suitability
refers to the suitability for a defined use of land in its present condition, without majar improvements. A potential suitability classification refers to the suitability, for a defined use, of land units in their condition at sam