BUILDING ASEAN EXCHANGE RATE UNIT (AERU)
FOR MONETARY INTEGRATION IN ASEAN-5 COUNTRIES
1Dimas Bagus Wiranatakusuma2, Masyhudi Muqorobin3, Imamudin Yuliadi4, Alif Supriyatno5
ABSTRACT
Research Background– Given the heightened interdependence of economies in the region, ASEAN-5
economies should arguably aim to stabilize intra-regional currencies through policy coordination rather than to seek stability through a US dollar peg.
Research Problem – The paper aims to develop the hypothetical currency unit in ASEAN-5 countries,
called ASEAN Exchange Rates Unit (AERU) under normal and crisis periods, as an anchor currency, and under which currency pegs the regional exchange rates keep stable.
Literature Review – The monetary union is set up for achieving currency stability and strengthening monetary policy coordination.
Data and Methodology – ASEAN-5 countries, in particular, are seeking the optimal framework in order
to reach the ultimate goal of unification, namely an ASEAN-5 monetary union. Some possible basket scenario are proposed to adopt, (1) individual currency, the Dollar, Euro, Yuan and Yen, and (2) a currency basket composed of US Dollar-Euro, US Dollar-Euro-Yen, and US Dollar-Euro-Yen, and Yuan. The analysis uses the daily data spanning from 2004 to 2011, retrieved from respective central banks.
Results and Discussion – Yuan is the recommended currency basket in terms of ACU due to enable for
achieving currency stability in ASEAN-5 countries. The result is also relevant with the current rapid growth of Chinese economy and the close network in terms of trade between ASEAN-5 and China.
Conclusions and Recommendations – The establishment of a currency union requires several steps of
preparation. The volatility assessment by using nominal deviation indicator method suggests that the ASEAN-5 currencies keep stable if they peg theirs national currencies into Yuan under ACU formulation. The periodic adjustment over the currency weighs is subject to substantial element to reflect current market condition.
Keywords: ASEAN-5 Countries, ASEAN Exchange Rates Unit, Stability, and Monetary Integration
JEL Classification: E51, F15, F31, F36, F55
1
Paper is submitted to 13th International Annual Symposium on Management, March 18-20, 2016 at Faculty of Social Sciences and Humanities, Vietnam National University Ho Chi Minh City, Vietnam. 2
Lecturer of International Program for Islamic Economics and Finance (IPIEF), Universitas Muhammadiyah Yogyakarta. PhD Candidate in Economics from International Islamic University Malaysia. Corresponding co-author: [email protected]
3
Director of International Program for Islamic Economics and Finance (IPIEF), Universitas Muhammadiyah Yogyakarta, PhD Holder in Economics from International Islamic University Malaysia. Corresponding Author: [email protected]
4
Head of Economics Department, Faculty of Economics, Universitas Muhammadiyah Yogyakarta, PhD Holder in Economics from Padjajaran University. Corresponding Co-author: [email protected]
5
ABSTRAK
Latar Belakang – Seiring dengan semakin tingginya tingkat ketergantungan ekonomi di negara-negara
ASEAN-5, maka ASEAN-5 sebaiknya perlu menstabilkan mata uang intra regionalnya melalui koordinasi kebijakan daripada sekedar hanya bertumpu pada penambatan mata uangnya pada US dollar.
Permasalahan Penelitian – Tulisan ini bertujuan untuk membuat hipotetikal unit mata uang di
negara-negara ASEAN-5, yang kemudian disebut dengan ASEAN Exchange Rates Unit (AERU), baik dalam kondisi normal maupun krisis sebagai jangkar mata uang. Jangkar ini adalah jangkar mata uang regional yang dapat menjaga stabilitas mata uang ASEAN-5.
Studi Literatur – Penyatuan moneter dibentuk sebagai upaya untuk mencapai stabilitas mata uang dan
menguatkan koordinasi kebijakan moneter.
Data dan Metodologi Penelitian – Negara-negara di ASEAN-5, Indonesia, Malaysia, Singapura,
Filipina, and Thailand, sedang berusaha mencari kerangka optimal dalam upaya untuk mencapai tujuan akhir dari penyatuan, yaitu kesatuan moneter negara-negara ASEAN-5. Beberapa keranjang mata uang diusulkan sebagai jangkar, yaitu berdasarkan (1) mata uang individual yang terdiri dari Dollar AS, Euro, Yen, dan Yuan, dan (2) mata uang basket yang terdiri dari US Dollar-Euro, US Dollar-Euro-Yen, and US Dollar-Euro-Yen-Yuan. Studi empirik ini menggunakan data harian dengan rentang 2004 sampai dengan 2011, bersumber dari database masing-masing bank sentral.
Hasil dan Pembahasan – Mata uang Yuan sangat disarankan untuk menjadi mata uang jangkar dalam
kerangka AERU. Hal ini karena Yuan paling dapat memberikan stabilitas pada mata uang ASEAN-5. Hasil ini juga sangat relevan bila melihat perkembangan pesat perekonomian Cina dewasa ini dan Cina memiliki jaringan perdagangan yang kuat dengan negara-negara ASEAN-5.
Kesimpulan dan Rekomendasi – Pembentukan kesatuan mata uang memerlukan beberapa tahapan dan
persiapan. Dengan menggunakan metode deviasi nominal indikator diperoleh bahwa mata uang ASEAN-5 akan stabil bila mata uang Yuan digunakan sebagai jangkar, berdasarkan formulasi AERU. Penyesuaian secara periodik dalam hal bobot mata uang sangat diperlukan sebagai elemen penting untuk dapat merefleksikan kondisi pasar terkini.
Kata Kunci: Negara-negara ASEAN-5, ASEAN Exchange Rates Unit, Stabilitas, dan Penyatuan Moneter.
Klasifikasi JEL: E51, F15, F31, F36, F55
INTRODUCTION
Given the importance of spreading prosperity across ASEAN region, the issue of maintaining exchange rate stability is becoming a crux agenda. The severe memory of regional financial crises in 1997/1998 eroded the credibility of unilateral fixed exchange rate in ASEAN and then renewed calls for greater monetary integration and enhanced regional exchange rate stability6. The success of the Euro also raised interest in the viability of a common currency for ASEAN and East Asia (Zhang, Sato &Mc Aleer, 2004). Exchange Rate Mechanism (ERM) II7 that is a special arrangement of exchange rate policy for EU candidate is becoming the institutional point about exchange rates stability assessment. By joining ERM II is expected the establishment of an environment in which member countries could accept the convergence
6
According World bank (2000), cost recapitulation for crises over GDP were recorded as follows : Indonesia (58% GDP), Malaysia (10%GDP), Thailand (30%GDP), and Korea (10%GDP)
7
parameters to the euro area without suffering disadvantage in the long term. With respect to exchange rates stability, a country which had adopted the ERM over the previous two years, had maintained its currency within the exchange rate fluctuation margin established for that period and had not implemented any devaluation
The challenging question is whether ASEAN is ready to establish such monetary union. In the process of regional economic and monetary cooperation, ASEAN takes a difference step compared to European Union (EU). European integration applied a top-down strategy that political leaders first set the vision with institutionalization leading to implementation. Thus, this strategy is dependent on consensus among the political leaders. On the other hand, ASEAN implements the bottom-up approach that the integration process follows the need for market or societal opinion. Political leaders often use this strategy if there is not a clear consensus among the leaders. There is no clear vision and they seem to be “rolling the ball as long as it rolls”. Integration via this strategy proceeds continuously if, only if, there is sufficient support and need. This strategy however can fail due to the lack of future and due to the mismatching of different integration initiatives despite respective level of progress.
Looking at the ASEAN strategy which does no longer resemble with what EU had applied, ASEAN has evolved the ASEAN economic community blue print; ASEAN envisages achieving integrated financial and capital markets by 2015. According to roadmap for monetary and financial integration of ASEAN, an ASEAN surveillance process and monitoring capacity in the region should and must be strengthened. Since then, many academics have suggested developing the Asian Currency Unit (ACU) as a parallel currency in Asia to further monetary integration in the region. For instance, Ogawa and Shimizu (2005) proposed using the ACU as a deviation indicator for the coordination of exchange rate in East Asia. Eichengreen (2005) considered that the introduction of the ACU would help foster monetary and financial integration in Asia, catalyze Asian bond markets and serve as an Asian exchange rate arrangement similar to the European exchange rate system.
When considering the feasibility of an ACU, one will have to consider the question of whether or not the region satisfies the requirement put forward by the theory of Optimum Currency area (OCA). The introduction of an ACU, however, poses many important technical questions such as what currencies to include in the currency basket, and what weight to attribute to the component currencies (Willianson, 2005).
Subsequently, the present paper focuses on the discussion on ASEAN-5 countries8 by taking into account several considerations. Firstly, monetary integration emphasizes on strengthening existing and new international linkages of commerce and trade (Daniels and Vanhouse, 2001). Economic integration (union) refers to economic linkages or interdependence between countries. The flow of trade, capital, labor and technology across countries are evidence of economic linkages (O‟Neill, 2002). The theory of economic integration further explains that the reduction or elimination of trade barriers among nations (Salvatore, 2005) will eventually bring together the commodity market, financial market (Coleman, 1999; O‟Neill, 2002) and labor market (O‟Neill, 2002) of the economies involved. In brief, the more open economies would be better off to form union in ASEAN. Secondly, the dissimilarity of the level of economic development and monetary system is therefore said to be the main obstacle to the adoption of policies to support economic and monetary integration (Bayoumi et al., 2000). Hence, the similarity of past macroeconomic policies, stage of economic development and financial systems would increase the suitability of countries to be integrated. It implies that developed economies are encouraged foremost to initiate step forming monetary union. Likewise what the European Monetary Union (EMU) had undertaken is considered as a rather balanced
8
community where four of its major members9, the United Kingdom (UK), France, Italy, and Germany, have comparable population, size, resources and economies (Day ad Herbig, 1995). Thirdly, some studies are empirically present a favorable idea for an enhanced economic and monetary cooperation in ASEAN-5. Ng (2002) examines the external shocks, domestic supply shocks and domestic demand shocks experienced by ASEAN-510, EMU and NAFTA. Their findings suggest (1) external shocks were more highly correlated in ASEAN than those of EMU and NAFTA, (2) the domestic demand and supply shocks of ASEAN were more correlated than those of EMU but lesser than those of NAFTA, (3) the magnitude of shocks on ASEAN was compatible to those of EMU but lesser than those of NAFTA, (4) ASEAN experienced increasing intra-regional trade in the 1990s and the formation of AFTA was likely to further stimulate intra-regional trade, (5) although there seems to be diversity in terms of monetary policy implementation among ASEAN countries, the gap is narrowing in recent years. McAleer and Nam (2005) highlight suitability of establishing a common currency area for ASEAN-5 from the perspective of contagion. They find out (1) contagion was present between all country pairs in ASEAN-5, an indication that the degree of correlation among ASEAN-5 economies had increased during the Asian financial crisis, (2) closer monetary co-operation among ASEAN-5 economies would be feasible. In addition, Ramayandi (2005) discusses on issues and prospects of ASEAN monetary union. ASEAN-5 is found to be suitable for a monetary co-operation due to their relative symmetrical economic shocks and trade patterns. Similarities in their recent demand shock components and exchange rate variations also suggested their harmonization in macroeconomic policies previously thought otherwise.
TABLE 1. KEY INDICATORS OF SELECTED ASEAN COUNTRIES
Country Year Population
2014 15.33 18475.56 16780 5626.009
Indonesia
2004 216.44 127172.50 256837.28 34952.50
2006 221.95 182273.80 364570.73 41103.10
2008 227.35 277407 510779.50 49596.70
2014 254.5 354215.53 888500 108835.54
Laos 2004 5.78 1076.06 2511.95 223.25 involved in the formation of these organizations: Belgium, France, Italy, Luxembourg, the Netherlands, and West Germany (the German Federal Republic) where these countries have similar economic stage of development
10
2008 6.21 N/A N/A N/A
2014 6.69 N/A 12000 875.10
Malaysia
2004 25.17 231042.63 124749.47 65881.10
2006 26.10 291450.80 156408.90 82132.30
2008 27.01 372880.81 222049.98 91148.80
2014 29.90 442958.41 338100 114571.98
Myanmar
2006 87.10 101450.08 117566.44 20025.40
2008 90.35 108823.01 168580.26 33192.90
2014 99.14 129528.62 284800 72056.99
Singapore
2004 4.20 362382.04 109668.50 112579.00
2006 4.36 510080.99 139177.30 136260.00
2008 4.62 655676.88 181938.84 174193.00
2014 5.470 709015.99 307900 256643.00
Thailand
2004 65.28 190838.68 161688.26 48664.00
2006 66.51 259175.33 206247.03 65291.40
2008 67.39 351200.27 273247.92 108661.00
2014 67.73 455504.27 404800 151253.35
Vietnam
2004 395.01 993474.91 739873.56 275192.90
2006 406.02 1344431.02 983970.42 344812.20
2008 416.71 1765987.98 1356596.53 456792.40
2014 457.00 2091223 2224100 703361
2004 545.82 1070070.62 759330.528 284561.84
2006 72.47 92.97 N/A 95.40
2008 72.53 92.10 N/A 94.43
2014 73.27 N/A N/A 94.10
Note: N/A means data not available
Source: International Financial Statistic, 2014
According to table 1, we do confirm that ASEAN-5 countries make up over 73.27 percent in terms of total population inhabitants compared to ASEAN-1011 countries in 2014. Meanwhile, the degree of economic development in ASEAN-5 is homogeneous and dominant, particularly, if we discern on their volume of trade which are well-developed around 92 percent of total ASEAN-10 volume of trade share in 2008. Size of GDP and international reserve posit a tremendous portion for affecting economic policies in the region 97.44 percent in 2004, and 94 percent in 2014. In summary, the ability of ASEAN-5 to work together based on above common indicators is apparent and it would sustain the common goal of a successful regional economic cooperation, finally benefiting gradually all participating economies as well peripheral economies in the region
Given that ASEAN-5 is advisable to create a monetary union, in reality, the region remains characterized by diverse, uncoordinated exchange rate arrangements. Indonesia and the Philippines adopt independent floating regime after Asian financial crisis, meanwhile Malaysia, Thailand, and Singapore adopt managed floating with no predetermined path regime. As it is increasingly difficult to maintain intraregional exchange rate stability through the traditional policy of US dollar pegs, a new framework for exchange rate policy coordination should be developed in ASEAN-5.
Masahiro Kawai, Dean and CEO Asian Development Bank (2009) stated that there are at least three ways to achieve similar exchange rate regimes throughout the region. The first is for each economy to stabilize its currency through a joint reference to a common key currency or a common basket of key currencies. The second is for these economies to jointly create a regional, cooperative system similar to the Snake or Exchange Rate Mechanism (ERM) in Europe. The third is mixing both two by taking consideration to sufficient economic convergence (the first way), and with strong political consensus (the second way). Finally, under both approaches, it is expected the enhanced monetary union would be shortly introduced.
He further added that for exchange rate stabilization agenda, three options can be considered for the region‟s target currency:
1. A single currency, such as the US dollar, the yen, the Yuan, or the Euro;
2. The special drawing rights (SDR; a currency basket of the US dollar, the Euro, the pound sterling, and the yen) or an SDR-plus currency basket (including the SDR as well as emerging ASEAN currencies)
3. ASEAN exchange rate unit (AERU)-an appropriate weighted basket of ASEAN currencies or developed economies
Monetary integration in ASEAN-5 economies is an incredible step towards economic integration. However, monetary integration needs to pursue policy coordination mechanism which should be undertaken gradually and step-by-step approach appropriately. Therefore, the research questions is focused on how to develop the hypothetical currency unit in ASEAN-5 countries, called ASEAN Exchange Rates Unit (AERU) under normal and crisis periods, and under which peg currency ASEAN-5 countries can reap exchange rates stability.
11
This paper is structured as follows. Chapter two discusses the theoretical and literature review. Chapter three elaborates data and methodology. Chapter four explains results and discussion, chapter five concludes.
THEORETICAL AND LITERATURE REVIEW
2.1. THEORETICAL THEORY 2.1.1 The Theory of Monetary Union 2.1.1.1 Optimum Currency Area Theory
Classical thought regarding to unified economy asserts that every aspect in economics is flexible. In the context of monetary union, the demand shocks are temporary so that the common central bank can stabilize output at the union level by undertaking real variable adjustment (i.e. production factor movement) without involving a nominal variable (i.e. exchange rate) (Grauwe, 2007). For instance, if demand from country A drastically decrease because of the shifting of world consumption pattern, then the production factor of the country can be used to other production (either domestic or in other countries), and by that, there will be a new equilibrium or equilibrating mechanism. An equilibrating mechanism can also be assessed from the Balassa-Samuelson effect where there are differential in productivity growth between countries in a monetary union the inflation rate must also differ. In a union, based on Balassa-Samulson, countries with a lower level of income tend to experience faster productivity growth as well as inflation. However, the adjustment process was assumed occur shortly because economic agents always follow optimal strategies in response to the strategies of the authorities (Kydland and Prescott, 1977, Barro and Gordon, 1983). Moreover, if the authorities reputation acquire in pursuing announced policies, it will have a great impact on how these policies are going to affect the economy
2.1.2. Convergence Theory
2.1.2.1. Convergence in the “old” OCA Theory
The criteria singled out by the “old” OCA theory share a common rationale: since by joining a MU a country gives up the possibility of adjusting its nominal exchange rate in response to macroeconomic shocks. Taking for granted the benefit of a MU, the “old” theory adopts, therefore, a “reduction of damages” approach. The lesser the need for an economy to adjust the nominal exchange rate, the lesser the cost of belonging to a MU. The main criteria (listed according to the chronological order in which they were proposed) are:
1. Flexibility of prices and wages (Friedman, 1953): it reduces the need to adjust employment or the nominal exchange rate in reaction to country specific shocks;
2. High interregional factor (specially labor) mobility (Mundell, 1961): it allows a country or region to absorb shocks without the need of adjusting the nominal exchange rate in presence of nominal rigidities that prevent the adjustment of real wages
3. High degree of openness (McKinnon, 1963); the more open the economy, the larger the benefits of belonging to a MU, for three distinct reasons :
a. Nominal rate ineffectiveness; if such an economy reacts to an adverse external shock with a nominal devaluation, the initial benefit on the exports side is compensated by an increase in the price of imported inputs, which brings price competitiveness to the initial level
c. Trade integration; as Frankel (1999) puts it, “where traded goods constitute a large proportion of the economy, exchange-rate uncertainty is a more serious issue”.
4. High product diversification (Kenen, 1969); it reduces the impact of industry-specific shocks relative to the size of the economy, thus reducing the need to resort to nominal exchange rate adjustments;
5. High fiscal integration (Kenen, 1969); it allows to absorb the impact of asymmetric shocks through fiscal transfer from one country to another country, thereby reducing the need of nominal exchange rate adjustments;
6. Convergence of inflation rates (Fleming, 1971); under fixed exchange rates, differences in inflation rates translate into variations of the terms of trade and give rise to persistent or even rising current account disequilibria
7. Political factors (Mintz, 1970), i.e., the “political will to integrate on the part of the prospective members”
2.1.2.2 Convergence in the New OCA Theory: the Cost-Benefit Approach
While the “old” OCA theory operates in a “reduction of damages” perspective, the “new” theory weights the benefits of OCA membership against its costs. The major benefits pointed out in the literature are:
1. Macroeconomic stability through the solution of time-consistency problems (Giavazzi and Pagano, 1988); by joining a MU with a low-inflation country, the monetary authorities of an otherwise inflation-prone take a credible commitment towards anti-inflation policies. This increases their reputation and minimizes the costs of anti-inflation without increases in unemployment
2. Increase in trade; according to Rose (2001), joining a Monetary Union (MU) causes a sizeable increase in trade
3. Saving on exchange reserves (Mundell, 1973; Frankel, 1999); an MU member countries no longer need international reserves for intra-regional transactions
4. Political advantages (Gandolfo, 2002); an MU “carries more weight than the single countries in negotiating as a whole with outside parties”
In addition, under the “new” theory, the credibility argument implies that exchange rates will converge; in other words, exchange rate convergence now becomes an outcome, rather than a prerequisite, of an OCA membership. Moreover, three further aspect of OCA-convergence come into play:
1. Business cycles convergence, i.e., the synchronization of business cycles among member countries, can be seen as either a prerequisite, or an outcome. The second view is taken by the so-called “endogenous OCA theory” of Frankel and Rose (1997), and depends strongly on the promotion of trade effect measured by Rose (2000)
2. Economic shock convergence, i.e., the contemporaneous correlation of the shocks affecting member countries, which also reduces the need for country specific policies 3. Fiscal policy convergence, i.e., the need of convergence of some fiscal indicators to
shared reference values, on sustainability grounds, in order to avoid free riding problems and the subsequent need to bail-out spendthrift countries.
2.2Literature Review
2.2.2 The Rational For Monetary Union 2.2.2.1 Achieving Exchange Rate Stability
market allowssimple comparisons, increased competition, and thus lower prices. The enhanced economic and price stability reduce risks and encourage investment and employment.
Bayoumi, Eichengreen, and Mauro (1999) establishing a monetary union will accumulate policy credibility as the enhanced exchange rate stability will economically trigger low inflation achievement, small fiscal deficits, and modest government debt to GDP ratio.
2.2.2.2 Strengthening Monetary Policy Coordination
Kuroda and Kawai (2002) point out that the creation of Asian Currency Unit (ACU) is likely to act as a statistical indicator summarizing the collective movement of Asian Currencies. This would enable the participating countries to stabilize their exchange rates against the ACU basket and improve the understanding for monetary and exchange rate policy coordination. The exchange rates of these currencies against those of neighboring countries are linked indeed by terms of trade and competitive prices (Kawai, Ogawa, and Ito, 2004). Ogawa, Kawasaki and Ito (2002) pointed out possible coordination failure in choosing an exchange rate system and exchange rate policy as long as one country‟s choosing the dollar-peg system has an adverse effect on others‟ choosing their own exchange rate systems through relative price effects.
Ito (2006) studies the possibility of yen as reference to the basket of currency system compared with dollar by taking its weight. The results suggest that in general the yen weight was found less susceptible to the US dollar rate as it is more stable and majority of Asian countries are pegging to yen as reference value. Therefore, keeping the exchange rate peg against yen would promote monetary policy coordination among Asian economies.
Ogawa and Shimizu (2006) argue that East Asian country economies have closer economic relationships with each other. Ogawa and Shimizu (2005) suggest that East Asian countries should to strengthening their economic relationships by establishing a network of bilateral and multilateral swap arrangements for managing a currency crisis in the member countries.the adoption of a common currency unit allows the monetary authorities to intervene in the foreign exchange markets to keep currency in the region against the other regional currencies within a band.strengthens that policy coordination among members should be reflected by establishing a regional common currency unit which conveys as an appropriate tool in identifying misalignment and excess volatility of intra-regional exchange rates. It is recommended that the monetary authorities would reach an agreement to define a certain kind of regional common currency unit for surveillance12, announce its value every day, and monitor deviation indicators of members currencies based on the regional common currency unit (Ogawa 2011).
2.3. Assessing the Implementation of Optimum Currency Area Theory in ASEAN-5
Numerous efforts have been undertaken in place by ASEAN to replicate the Euro experiences on formation on ASEAN currency, for example the Chiang Mai Initiative which was initiated at year 2000, ASEAN economic community (AEC) in 2002.
According to Jeffrey A. Frankel (1999), An optimum currency area is a region for which it is optimal to have its own currency and its own monetary policy. The optimum currency area criteria include the intensity of trade links and magnitude of income relation and when a political unit adopts the currency of neighbors it can gave a positive effect in incomes.
Without a single currency and a single monetary policy, the achievements made regarding economic integration and the deepening of the Single Market would be in danger (Otmar Issing, 2006).
Azali et.al (2007) examines the convergence criteria according to the Maastricht Convergence Criteria13. The results indicate that there exists a stable long-run relationship
12
Extending surveillance function to some actions, such as using monetary and fiscal policy to correct the deviation in the exchange rate from the basket value
13
among GDP per capita, exchange rate variation, interest rate, inflation rate, surplus or deficit ratio, and debt ratio in ASEAN-5 countries14. In addition, VAR results outline that exchange rate variability and debt ratio has a positive impact on economic growth in long run, while interest rate, inflation rate, and debt ratio have a negative sign (s). Therefore, the study shows that ASEAN-5 experienced the potential of economic productivity growth and supporting the ASEAN-5 countries to form a monetary union which is considered beneficial according to the Maastricht Criteria.
Hakim and Dahalan (2009) empirically investigate the effect of monetary transmission and financial market performance on possibility of ASEAN-5 economic integration. In terms of optimal monetary transmission, the monetary condition index (MCI) was utilized. In general, Indonesia and Thailand have similar pattern of monetary transmission with the interest rate is stronger than the exchange rate channel. Meanwhile, Malaysia, Philippines and Singapore indicate that the effect of exchange rate is stronger than interest rate. However, in general, these optimal monetary transmission have supported the possibility of ASEAN-5 economic integration In addition, Mundell (1961), McKinnon (1963), and Kennen (1969) highlighted that some conditions are needed to guarantee the sustainability of a monetary union. They can be summarized in terms of three concepts: symmetry, flexibility, and integration. To start with, countries in a monetary union should experience macroeconomic shocks that are reasonably symmetric (similar) since they are now consigned to an identical monetary response. Meanwhile, Asean Economic Community (AEC) conduct a free flow of skilled labour (Guntur Sugiyarto, 2014) and a currency union will be less costly if there is a high level of labor mobility within the union, and/or high degrees of wage and price flexibility, as both these conditions facilitate full employment, reducing the need for active policy, and, also diminishing the effectiveness of monetary policy, and thus the value of monetary independence (J.M.C. Santos Silva, 2010).
In addition, The consensus emerging from that literature is that ASEAN-5 countries do not experience many asymmetric shocks. For instance, Xu (2004) computes the percentage of the variation in demand and supply shocks that can be attributed to common shocks. These percentages are computed by first extracting the shocks using the Blanchard-Quah structural VAR procedure. The supply and demand shocks thereby obtained are then subjected to a factor analysis, which allows estimation of the common component in movement of these shocks15. The share of the total variation captured by this common component can be interpreted as expressing the degree of symmetry in the shocks. Overall, either supply and demand shocks seem similar, even though for Indonesia, they are relatively lower compared to the rest of the countries. In other words, the degree of symmetric shocks in AEAN-5 is compatible to further proceed by taking consideration on Euro zone shocks which appears to be only slightly lower16
- Government budget deficit of less than 3% of GDP
- Government national debt of less than 60% of GDP
- Price stability : an average rate of inflation no more than 1.5 percentage points above that of the three best performing member states
- Convergence of interest rates between countries : an average nominal long term interest rate not more than 2 percentage points above that of the three best performing member states
- Exchange rate stability : participation in the normal bands of the exchange rate mechanism for at least two years without devaluation
14
ASEAN-5 denotes for Indonesia, Malaysia, The Philippines, Thailand, and Singapore 15
This approach is widely used, but is subject to an important criticism. This is that the shocks identified as demand shocks are in fact temporary shocks, while the shocks identified as supply shocks are in fact permanent shocks
16
Finally, based on above analysis, we can come to conclude that ASEAN-5 economies economically are eligible to develop an index for currency union. However, as suggested by Ogawa and Ito (2002), ASEAN-5 monetary authorities should make deeper coordination and create steps towards exchange rate policies. Hence, for achieving such policies, it is good for each monetary authority to realize on linkages of ASEAN-5 currencies.
DATA AND METHODOLOGY 3.1Introduction
ASEAN-5 countries, in particular, are seeking the optimal framework in order to reach the ultimate goal of unification, namely an ASEAN-5 monetary union. Some possible basket scenario are proposed to adopt, (1) the Dollar, Euro, and Yen (DEY)17 and ASEAN Exchange rate Unit (AERU)18, (2) a currency basket composed of ASEAN-5 currencies (AERU), (3) or a strategy of regional monetary integration could make use of both kinds of baskets (Kawai, Ogawa, and Ito 2004).
3.2Variable Identification
The present research utilizes some economic variables in order to form an optimum currency area in ASEAN-5 countries. Some employed variables are as follows :
1. Trade volume (in million dollars) which is consists of the volume of export and import. This variable is based on each trade direction across ASEAN-519 countries. In addition, the trade volume is incorporated to compute the weight of each currency in the basket for calculating the AERU, either in normal period or crisis period. The trade direction also accounts for the amount of trading volume between ASEAN-5 countries with some developed nations, such as US, European Union20, Japan, and China21. The data span from 2004 to 2010 on yearly basis
2. Nominal GDP which is a set of GDP (in million dollars) in each ASEAN-5 countries and is used to calculate the AERU by taking its weight of each observable currency in the basket, either in normal or crisis period. The data span from 2004 to 2010 on yearly basis
3. GDP measured at Purchasing power parity which is a set of GDP at PPP (in million dollars) in each ASEAN-5 countries and used as one of economic criteria to calculate the AERU by taking its weight of each observable currency in the basket, either in normal or crisis period. The data span from 2004 to 2010 on yearly basis
4. International reserve minus gold (in million dollars) is also included for each ASEAN-5 countries as one economic criterion to calculate the AERU by taking its weight of each observable currency in the basket, either in normal or crisis period. The data span from 2004 to 2010 on yearly basis
5. Bath against US dollar (USD/THB), rupiah against dollar (USD/IDR), ringgit against dollar (USD/MYR), peso against dollar (USD/PHP), and Singapore dollar against dollar (USD/SGD). The data span from 2004 to 2010 on daily basis
17
DEY is a common basket based on own trade pattern 18
AERU grouped as individual-country baskets because it is based on common currency basket weights within the region (Castel et all, 2007)
19
ASEAN-5 countries denotes for Indonesia, Malaysia, the Philippines, Thailand, and Singapore 20
The European Union is United Kingdom, Germany, the Netherlands, France, Italy, Belgium, Luxembourg, Denmark, Ireland, Greece, Spain, Portugal, Austria, Finland, Sweden, and other countries in union
21
6. IDR22/AERU, MYR/AERU, PHP/AERU, THB/AERU, SGD/AERU. All data span from January, 02 2004 to October, 21 2011 on daily basis.
7. US$-Euro/AERU is defined as the value of the AERU in terms of a weighted average of the US dollar and the euro. The data span from January, 02 2004 to October, 21 2011 on daily basis
8. US$-Euro-Yen-Yuan/AERU is defined as the value of the AERU in terms of a weighted average of the US dollar, the euro, the Yen, and the Yuan. The data span from January, 02 2004 to October, 21 2011 on daily basis
9. US$-Euro-Yen/AERU is defined as the value of the AERU in terms of a weighted average of the US dollar, the Euro, and the yen. The data span from January, 02 2004 to October, 21 2011 on daily basis
10.US$/AERU is defined as the value of the AERU in terms of a weighted average of the US dollar. The data is range from January, 02 2004 to October, 21 2011 on daily basis
11.Euro/AERU is defined as the value of the AERU in terms of a weighted average of the Euro. The data span from January, 02 2004 to October, 21 2011 on daily basis
12.Yen/AERU is defined as the value of the AERU in terms of a weighted average of the yen. The data span from January, 02 2004 to October, 21 2011 on daily basis
13.Yuan/AERU is defined as the value of the AERU in terms of a weighted average of the Yuan. The data span from January, 02 2004 to October, 21 2011 on daily basis
14.Singapore dollar/AERU is defined as the value of the AERU in terms of a weighted average of the Singapore dollar. The data span from January, 02 2004 to October, 21 2011 on daily basis
The data used in this study are secondary data. However, the identifiable variable since no 5 to no 14 are categorized as the calculated data which I will do and these are not secondary data. All data are obtained from International financial statistic (IFS), Bank Indonesia (BI), Bank Negara Malaysia (BNM), Bank of Thailand (BOT), Central Bank of the Philippines (CBP), Monetary Authority of Singapore (MAS), and PACIFIC Exchange rate services.
3.3The ASEAN-5 Exchange Rate Unit (AERU) as a Proxy to Monetary Integration
Watanabe and Ogura (2006) has studied on the Regional Monetary unit (RMU). However, given that a currency union takes long to become a reality, it is proposed that an AERU be created even if no immediate prospect for the currency union. Eichengreen (2006) calls this a parallel currency approach
The paper considers the approach of Ogawa and Shimizu (2005), which follows the same principle of the European Currency Unit under the EMS, which is, computed as the weighted average of each country‟s currency in the region. In the same way that the ECU was defined as a basket of currencies of EU member countries, the AERU is defined as a basket currency of the ASEAN-5 (Indonesia, Malaysia, the Philippines, Singapore, and Thailand).
3.4Determining the Base Year23
It is very important to choose the base year as a benchmark year in order to calculate AERU deviation indicator. One of the most popular ways is to choose the year when a fundamental equilibrium of both internal and external sectors is achieved. In other words, the base year is chosen such that total international transaction of the members countries are as close
22
IDR = Indonesian Rupiah; MYR = Malaysian Ringgit; PHP = Philippines Peso; THB = Thailand Bath; SGD = Singapore Dollar
23
to being balanced as possible and their balances with the rest of the world are also small as possible. The base year calculation uses the balance of Trade (exports volume minus imports volume in US dollars) of ASEAN-5 countries (1) within ASEAN-5 countries, (2) with US, EU, Japan, and China, (3) with US, EU, and Japan, (4) with US and EU, (5) with US, (6) with EU, (7) with Japan, (8) with China, and (9) with Singapore. The yearly data observed span from the year 2004 to 2010
3.5 Determining The Periods Of Crisis and Normal
The proposed currency union is hopefully able to adopt the precedent and un-precedent pressure into currency union. For such purpose, the coming established currency union has to be able to maintain their stability and less volatility over various periods or we can call them as normal and crisis periods. Since the periods of observations are ranging from 2004 to 2010, we divide into two circumstances base on the standard deviation for normal period as well as for crisis period.
3.6Determining the Weights of Currency
One major issue to consider is to choose the weight for each component currency. Generally, the weight of the basket is supposed to represent the weight of the country‟s economic importance and contribution to economic cooperation in the region. The present paper uses four different kinds of economic size indicators which were adopted by Ogawa and Shimizu (2005)24. Then, we calculate the countries‟ shares of the optimal share weights25 for the most recent three years as the currency share of the AERU. Since the present paper is comparing the best currency peg for ASEAN-5, the normal period and crisis period is set separately by taking three years average of normal period26 (2004-2006) and four years average of crisis period27 (2007-2010). The average for the most recent three and four years for which data is available is used to calculate the currency shares of the observable economic size indicators in order to reflect the most recent trade relationship and economic condition of the ASEAN-5 countries for calculation of the AERU.
To obtain the exact weights for each economic size indicators, all variables in each country examined are summed up based on their categories. For instance, for measuring the weight share of trade volumes, we enumerate yearly trade volume for the recent three years according to specific period (normal or crisis), and then get the average over three years‟ time on each sampled country. The average trade volume on each sampled country is then weighted based on each country trade volume over total trade volume. Finally, the weighted value is transformed into percentage. Those steps are repeatedly used to compute the other weights according to different economic size indicators.
By employing various economic size indicators, we could obtain the best weights in which the currency stability in ASEAN-5 countries can be maintained and sustained either in normal or crisis period. Therefore, those selected weights are considered as the best indicators in reflecting
24
They used 1) trade volume; 2) Nominal GDP; 3) GDP measured at Purchasing Power parity; 4) International Reserves (minus Gold). From the stand point of stability vis-à-vis the US$-Euro basket currency, the PPP measured GDP and trade volume were chosen as weights
25
It is calculated by comparing the standard deviation of each the value of AERU in terms of a weighted average the numerous exchange rate regimes. Then, the two lowest of economic size indicators are incorporated by computing theirs arithmetic shares for normal as well as crisis period separately. 26
Three years for normal are determined by considering one year before and after the year of normal period, which is set in 2005 for ASEAN-5 national currencies against US dollar
27
the need for ASEAN-5 economies to integrate and strengthen their cooperation gradually in forming single monetary currency in near future.
3.7 Calculation the AERU
According to Ogawa and Shimizu (2005), for the benchmark period, the exchange rate of the AERU in terms of various baskets arrangement is set at unity. Setting for unity implies that a weighted trade proportion is set on a hundred percent for each benchmark calculation separately. Then, several steps are incorporated into calculation as follows:
3.7.1 Step 1: Calculating the Benchmark Exchange Rate for Each ASEAN-5 Currency in
terms of Observable Currency Baskets
a. Benchmark28 exchange rate calculation for each ASEAN-5 currency in terms of (US$-Euro/AERU) = average of ((USD/Each ASEAN-5 Currency X a weighted trade proportion29 with US) + (EURO/Each ASEAN-5 Currency X a weighted trade proportion with European Union)). For example, benchmark of IDR for US$-Euro/AERU = average of ((USD/IDR X 58%) + (Euro/IDR X 42%)).
b. Benchmark exchange rate calculation for each ASEAN-5 currency in terms of (US$-Euro-Yen-Yuan/AERU) = average of ((USD/Each ASEAN-5 currency X a weighted trade proportion with US) + (Euro/Each ASEAN-5 currency X a weighted trade proportion with EU) + (Yen/Each ASEAN-5 currency X a weighted trade proportion with Japan) + (Yuan/Each ASEAN-5 currency X a weighted trade proportion with China)). For example, benchmark of IDR for US$-Euro-Yen-Yuan/AERU = average of ((USD/IDR X 22%) + (Euro/IDR X 22%) + (Yen/IDR X 20%) + (Yuan/IDR X 36%)). c. Benchmark exchange rate calculation for each ASEAN-5 currency in terms of
(US$-Euro-Yen/AERU) = average of ((USD/Each ASEAN-5 currency X a weighted trade proportion with US) + (Euro/Each ASEAN-5 currency X a weighted trade proportion with EU) + (Yen/Each ASEAN-5 currency X a weighted trade proportion with Japan)). For example, benchmark of IDR for US$-Euro-Yen/AERU = average of ((USD/IDR X 34%) + (Euro/IDR X 35%) + (Yen/IDR X 31%)).
d. Benchmark exchange rate calculation for each ASEAN-5 currency in terms of (US$/AERU) = average of ((USD/Each ASEAN-5 currency X a weighted trade proportion with US)). For example, benchmark of IDR for US$/AERU = average of (USD/IDR X 100%).
e. Benchmark exchange rate calculation for each ASEAN-5 currency in terms of (Euro/AERU) = average of ((Euro/Each ASEAN-5 currency X a weighted trade proportion with EU)). For example, benchmark of IDR for Euro/AERU = average of (Euro/IDR X 100%) .
f. Benchmark exchange rate calculation for each ASEAN-5 currency in terms of (Yen/AERU) = average of ((Yen/Each ASEAN-5 currency X a weighted trade proportion with Japan)). For example, benchmark of IDR for Yen/AERU = average of (Yen/IDR X 100%).
28
The benchmark period refers to the year which the total international transaction of the members countries are as close to being balanced as possible and their balances with the rest of the world are also small as possible. The base year calculation uses the balance of Trade (exports volume minus imports volume in US dollars) of ASEAN-5 countries (1) within ASEAN-5 countries, (2) with US, EU, Japan, and China, (3) with US, EU, and Japan, (4) with US and EU, (5) with US, (6) with EU, (7) with Japan, (8) with China, and (9) with Singapore. It can be called as base year period, namely 2008 and one year before. Therefore, the benchmark period is 2007 and 2008
29
g. Benchmark exchange rate calculation for each ASEAN-5 currency in terms of (Yuan/AERU) = average of ((Yuan/Each ASEAN-5 currency X a weighted trade proportion with China)). For example, benchmark of IDR for Yuan/AERU = average of (Yuan/IDR X 100%).
h. Benchmark exchange rate calculation for each ASEAN-5 currency in terms of (Singapore dollar/AERU) = average of ((SGD/Each ASEAN-5 currency X a weighted trade proportion with Singapore)). For example, benchmark of IDR for SGD/AERU = average of (SGD/IDR X100%).
3.7.2 Step 2: Determining AERU Weights30
As mentioned previously, that the present paper is comparing four different economic size indicators and then trying to select which two out of four indicators is having the highest stability when each of them is applied on every single currency baskets observed31, either in normal or crisis period.
The AERU weight for each ASEAN-5 currency = Average Benchmark Exchange Rate for each ASEAN-5 country based on the each observable currency basket X economic size indicator32. For example, the AERU weight in terms of US$-Euro/AERU for IDR = Average benchmark for IDR in terms of US$-Euro X trade volume. We then can call it as the IDR weight in terms of US$-Euro.
3.7.3 Step 3: Calculating the Basket Currencies33
As mentioned, the present paper tries to compare various alternative basket currencies which could bring the best options in terms of their stability and finally be suitable to be used as the best parallel currency in forming a currency area at the end, both in normal and crisis period. Therefore, we will present the way of calculating on each observable basket currencies, as
Where: US$-Euro/Each ASEAN-5 currency = ((US$/Each ASEAN-5 currency*Trade Share36) + (Euro/Each ASEAN-5 currency*Trade Share))
Each ASEAN-5 currency/AERU = Each ASEAN-5 AERU weight on each economic size indicator/Each ASEAN-5 benchmark exchange rate in terms of US$-Euro
30
The AERU weight is an element to count the observable basket against AERU for every single AERU member participants
31
We observe eights different basket currencies, namely (1) US$-Euro, (2) US$-Euro-Yen-Yuan, (3) US$-Euro-Yen, (4) US$, (5) Euro, (6) Yen, (7) Yuan, (8) Singapore Dollar
32 Thailand Bath (THB), and Singapore Dollar (SGD)
36
b. The value of AERU in terms of a weighted average of the US$-Euro-Yen-Yuan (US$-Euro-Yen-Yuan/AERU)
- US$-Euro-Yen-Yuan/AERU = ((IDR weight)*(US$-Euro-Yen-Yuan /IDR)) +
((MYR Yen-Yuan /MYR) + ((PHP weight)*(US$-Euro-Yen-Yuan/PHP)) + ((THB weight)*(US$-Euro-Yen-Yuan/THB)) + ((SGD weight)*( US$-Euro-Yen-Yuan /SGD))
Where: US$-Euro-Yen-Yuan/Each ASEAN-5 currency = ((US$/Each ASEAN-5 currency*Trade Share) + (Euro/Each ASEAN-5 currency*Trade Share) + (Yen/Each ASEAN-5 currency*Trade Share) + (Yuan/Each ASEAN-5 currency*Trade Share)) Each ASEAN-5 currency/AERU = Each ASEAN-5 AERU weight on each economic size indicator/Each ASEAN-5 benchmark exchange rate in terms of US$-Euro-Yen-Yuan
c. The value of AERU in terms of a weighted average of the US$-Euro-Yen (US$-Euro-Yen/AERU)
- US$-Euro-Yen/AERU = ((IDR weight)*(US$-Euro-Yen/IDR)) + ((MYR
weight)*(US$-Euro-Yen/MYR) + ((PHP weight)*(US$-Euro-Yen/PHP)) + ((THB weight)*( US$-Euro-Yen/THB)) + ((SGD weight)*(US$-Euro-Yen/SGD))
Where: US$-Euro-Yen/Each ASEAN-5 currency = ((US$/Each ASEAN-5 currency*Trade Share) + (Euro/Each ASEAN-5 currency*Trade Share) + (Yen/Each ASEAN-5 currency*Trade Share))
Each ASEAN-5 currency/AERU = Each ASEAN-5 AERU weight on each economic size indicator/Each ASEAN-5 benchmark exchange rate in terms of US$-Yen-Yuan d. The value of AERU in terms of a weighted average of the US$ (US$/AERU)
- US$/AERU = ((IDR weight)*(US$/IDR)) + ((MYR weight)*(US$/MYR) +
((PHP weight)*(US$/PHP)) + ((THB weight)*(US$/THB)) + ((SGD weight)*(US$/SGD))
Where: Each ASEAN-5 currency/AERU = Each ASEAN-5 AERU weight on each economic size indicator/Each ASEAN-5 benchmark exchange rate in terms of US$ e. The value of AERU in terms of a weighted average of the Euro (Euro/AERU)
- Euro/AERU = ((IDR weight)*( Euro/IDR)) + ((MYR weight)*( Euro/MYR) +
((PHP weight)*(Euro/PHP)) + ((THB weight)*( Euro/THB)) + ((SGD weight)*( Euro/SGD))
Where: Each ASEAN-5 currency/AERU = Each ASEAN-5 AERU weight on each economic size indicator/Each ASEAN-5 benchmark exchange rate in terms of Euro f. The value of AERU in terms of a weighted average of the Yen (Yen /AERU)
- Yen/AERU = ((IDR weight)*(Yen/IDR)) + ((MYR weight)*(Yen/MYR) +
((PHP weight)*(Yen/PHP)) + ((THB weight)*(Yen/THB)) + ((SGD weight)*(Yen/SGD))
Where: Each ASEAN-5 currency/AERU = Each ASEAN-5 AERU weight on each economic size indicator/Each ASEAN-5 benchmark exchange rate in terms of Yen g. The value of AERU in terms of a weighted average of the Yuan (Yuan/AERU)
- Yuan/AERU = ((IDR weight)*(Yuan/IDR)) + ((MYR weight)*(Yuan/MYR) +
((PHP weight)*(Yuan/PHP)) + ((THB weight)*(Yuan/THB)) + ((SGD weight)*(Yuan/SGD))
Where: Each ASEAN-5 currency/AERU = Each ASEAN-5 AERU weight on each economic size indicator/Each ASEAN-5 benchmark exchange rate in terms of Yuan h. The value of AERU in terms of a weighted average of the Singapore Dollar
- SGD/AERU = ((IDR weight)*(SGD/IDR)) + ((MYR weight)*(SGD/MYR) + ((PHP weight)*(SGD/PHP)) + ((THB weight)*(SGD/THB)) + ((SGD weight)*(US$/SGD))
Where: Each ASEAN-5 currency/AERU = Each ASEAN-5 AERU weight on each economic size indicator/Each ASEAN-5 benchmark exchange rate .
RESEARCH FINDINGS AND DISCUSSION
4.1 CALCULATING THE AERU
4.1.1 Determining the Shares on the Basket Currency
As mentioned previously, the value of AERU would have been shared into several basket currencies. The shared average of particularly common basket currency is based on important trading partner with ASEAN-5 countries. Due to the common basket currency is quoted in terms of a shared average of the US$-Euro, the US$-Euro-Yen-Yuan, the US$-Euro-Yen, and some individual baskets currencies, the shares on those basket currencies are set unity
TABLE 2. THE SHARES OF TRADE BALANCE ON THE BASKET CURRENCY
Year Average US$-EURO
US$-EURO-YEN-YUAN
US$-EURO-YEN US$, EURO,
YEN, YUAN
2004-2010 58% : 42% 22%:22%:20%:36% 34%:35%31% 100%
Source: Author’s Calculation
4.1.2Determining Normal and Crisis Period
This part is important since the need for an anchor basket currency which is able to minimize pressures over various period of time is indeed demanded. Asian financial crisis and global crisis had devastated widely both economic and social cohesion in ASEAN-5 countries. Thus, this is the time that a stable currency system to be referred to, moreover in the context of currency union.
TABLE 3. THE STANDARD DEVIATION OF ASEAN-5 CURRENCY AGAINST US DOLLAR (2004-2010)
Country 2004 2005 2006 2007 2008 2009 2010
Thailand 0.944476 1.134852 1.080066 1.441643 1.582766 0.861185 1.159792 Indonesia 337.561 349.8856 164.6902 170.9217 829.8686 845.3673 137.4299 Malaysia 0.000327 0.015753 0.050923 0.05853 0.148811 0.091686 0.105851 Philippines 0.28551 0.837851 1.156569 2.18953 2.939415 0.706306 1.133471 Singapore 0.024649 0.023291 0.02753 0.032543 0.050613 0.047451 0.041192 Source: All figures are calculated by authors. The data are from Pacific Exchange Rate Service
Those are the range of will be utilized to calculate the value of the AERU in the crisis as well as
4.2.1Defining The Benchmark Period and Benchmark Exchange Rates
4.2.1.1 Defining the Benchmark Period
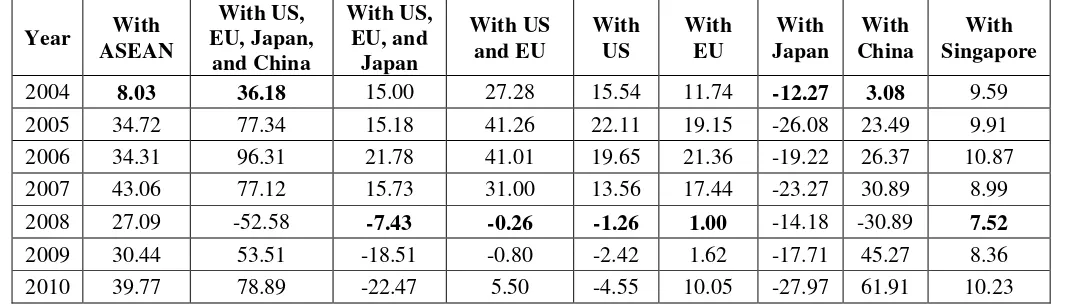
The benchmark period is chosen in order to calculate the benchmark exchange rates. The benchmark period is defined as the following; the total balance of trade of ASEAN-5 with ASEAN-5; with US, EU, Japan, and China; with US, EU, and Japan; with US and EU; with US; with EU; with Japan; with China; with Singapore; should be relatively close to zero. The table 6.15 shows the balanced of trade of the ASEAN-5 from 2004 to 2010. It shows that 2008 is the year which majority the balance of trade is close to zero. The purpose under such rule mentioned by De Grauwe (2007) is that the countries under monetary union are able to default their debts by creating surprise inflation and devaluation, which reduces the real value of the debts, but would nominally inflate nominal value and downgrade government credibility. The absence of trade deficits is one of the way out indicators to fully show their commitments to always maintain their trade balance at least closest to zero in order to preserve union from defaults.
TABLE 4. THE BALANCE OF TRADE OF ASEAN-5 WITH TRADE PARTNER
Year With
Source: author‟s calculation. Trade Direction data from Respective Central Banks databases. Data in Billion dollars
Then, assuming a one-year time lag before changes in exchange rates affect trade volumes, we should select 2007 and 2008 as the benchmark periods. Having set the period, we can define that the exchange rate of each ASEAN-5 currency in terms of AERU during the benchmark period as the benchmark exchange rates period.
4.2.1.2 Defining the Benchmark Exchange Rates
TABLE 5. THE BENCHMARK EXCHANGE RATE OF EACH ASEAN-5 EXCHANGE 1 US$-Euro/AERU 9.38728X10⁻⁵ 0.25978 0.01946 0.02695 0.60204
2
US$-Euro-Yen-Yuan/AERU 0.00269 7.44227 0.55644 0.77286 17.22865
3
US$-Euro-Yen/AERU 0.00375 10.33370 0.77262 1.07316 23.92139
4 US$/AERU 0.00011 0.29646 0.02217 0.03074 0.68715
5 Euro/AERU 0.00008 0.20913 0.01562 0.02171 0.48450
6 Yen/AERU 0.01188 32.77326 2.45036 3.40357 75.86513
7 Yuan/AERU 0.00078 2.15664 0.16125 0.22390 4.99405
8 SGD/AERU 0.00016 0.43252 0.03233 0.04489 0.68715
Source: Author‟s calculation. Benchmark Period 2007/2008 in daily basis
According to table 5, benchmark of IDR is the smallest against AERU for every currency basket. On the other hand, SGD shows the biggest values of benchmark against AERU. These imply that the value of IDR in every basket currency must be the highest, and SGD is vice-versa.
4.2.2 Determining the Most Stable Economic Size Indicators
As mentioned earlier, the present study uses four types of country weights. By using them, we calculate four types of AERU vis-à-vis the basket currency based on the four indicators, either during normal or crisis period. The particular calculation is undertaken in terms of rate change of several indicators. Thus, the selection on the most stable among the four types of indicators are based on the lowest standard deviation in terms of rate of change (%). Therefore, statistical measurement is highlighted on rates of change (%) since it captures the stability of ASEAN-5 currency against AERU (Ogawa Shimizu, 2005). Then, according to Ogawa and Shimizu work (2005), we will take the two most stable types of AERU and we will use them to calculate weights of currency basket in AERU for ASEAN-5 currencies
TABLE 6. THE SUMMARY OF SELECTED ECONOMIC SIZE INDICATORS OVER VARIOUS CURRENCY BASKETS UNDER NORMAL AND CRISIS PERIOD
No Currency Basket Economic Size Indicator
Normal Crisis
1 US$-Euro Trade Volume and International Reserve
Trade Volume and International Reserve
2 US$-Euro-Yen-Yuan Nominal GDP and GDP Measured at PPP
Nominal GDP and GDP Measured at PPP
3 US$-Euro-Yen Nominal GDP and GDP Measured at PPP
Nominal GDP and GDP Measured at PPP
4 US$ Trade Volume and International Reserve 8 Singapore Dollar Trade Volume and Nominal GDP Trade Volume and Nominal GDP
Table 6 provides the summary of selected best indicators over various baskets currency against AERU. The results shows that the nominal GDP and GDP measured at PPP are the most stable indicators over majority currency baskets proposed, either under normal and crisis periods.
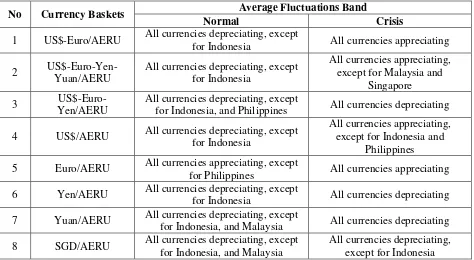
4.2.3Building A Currency Union Under Various Currency Basket Arrangements
Table 7 shows some important findings that once a country joins monetary union, they are required to maintain their currency from devaluation or encouraged for appreciation. In that case, once ASEAN-5 countries peg their national currencies to AERU, the appreciation exchange rate movement should be in place. According to the table 6.58, ASEAN-5 currencies would be appreciating if they value the AERU in terms US$-Euro and Euro, particularly during crisis period. In addition, as known that Indonesian rupiah, is the most volatile currency in the ASEAN-5, would benefit from the AERU establishment since her value is appreciating, either during normal and crisis period for almost currency baskets proposed.
TABLE 7
THE SUMMARY OF CURRENCY MOVEMENT OVER VARIOUS CURRENCY BASKETS UNDER NORMAL AND CRISIS PERIOD
No Currency Baskets Average Fluctuations Band
Normal Crisis
1 US$-Euro/AERU All currencies depreciating, except
for Indonesia All currencies appreciating
2 US$-Euro-Yen-Yuan/AERU
All currencies depreciating, except for Indonesia
All currencies appreciating, except for Malaysia and
Singapore
3
US$-Euro-Yen/AERU
All currencies depreciating, except
for Indonesia, and Philippines All currencies depreciating
4 US$/AERU All currencies depreciating, except for Indonesia
All currencies appreciating, except for Indonesia and
Philippines
5 Euro/AERU All currencies appreciating, except
for Philippines All currencies appreciating
6 Yen/AERU All currencies depreciating, except
for Indonesia All currencies depreciating
7 Yuan/AERU All currencies depreciating, except
for Indonesia, and Malaysia All currencies depreciating
8 SGD/AERU All currencies depreciating, except for Indonesia, and Malaysia
All currencies depreciating, except for Indonesia Source: Author‟s Calculation
4.3 ASSESSING THE VOLATILITY OF CURRENCY BASKETS IN TERMS OF
AERU
As mentioned in previous chapter that the criteria and the measurement for volatility is not clearly yet. However, the presence study will use the nominal deviation indicator (NDI) approach to measure the degree of volatility of every currency baskets for ASEAN-5 currencies
Number of Volatility on Various Currency Baskets Arrangements
Average Normal Crisis Average
U.S.$-euro/AERU 0.38 0.61 0.495
U.S.$-euro-Yen-Yuan/AERU 0.38 0.57 0.475
U.S.$-euro-Yen/AERU 0.65 0.59 0.62
U.S.$/AERU 0.42 0.02 0.22
euro/AERU 0.01 0.04 0.025
Yen/AERU 0.43 0.60 0.515
Yuan/AERU 0.00 0.02 0.01
SGD/AERU 0.08 0.02 0.05
Source: Author‟s Calculation
Table 8 shows that the degree of volatility varies among various currency baskets arrangement. During normal period, Yuan is having the lowest number of volatility, around 0.00. Moreover, during the crisis, Yuan, Euro, and SGD are also showing the lowest degree of volatility. Hence, in average, Yuan is yet considered the lowest one, roughly 0.01. It implies that she is selected as the most stable currency basket arrangements for ASEAN-5 currencies against AERU. The finding is in line with the study conducted by Shirono (2009) which suggested currency unions along with China tend to generate higher average welfare gains for East Asian, including ASEAN countries than currency unions with Japan or the United States. This trend is likely to continue if China‟s role continues to rise in the regional trade.
However, the current issue arises as the movement of Chinese Yuan is highly pegged to US Dollar and is well-known as a heavily manipulated currency against US dollar. This situation open further research, particularly on how to set a stable currency union in the mid of manipulated exchange rate policies by China‟s government.
In addition, this finding is also relevant with the growing role of China in global economy. In the context of exchange rate policy, this tren provide opportunity for strengthening economic relationship within ASEAN-5. In addition, choosing Yuan as a common anchor currency by ASEAN-5‟s is supported by the network effects theory. This theory states that the utility of a consumer on particular good is dependent on the number of other individuals consuming the same good (Katz and Shapiro, 1985). There are two implications for this, first, a minimum level of agents consuming the same good (critical mass) is necessary for the initial adoption of a network good (Farrel and Soloner, 1986); second, the demand for network commodities is associated with a bandwagon effect, i.e. the more individuals use the good, the more incentive for others to also use it. These implications will apply on money as a network good and will led to interesting results in the form of monetary integration.
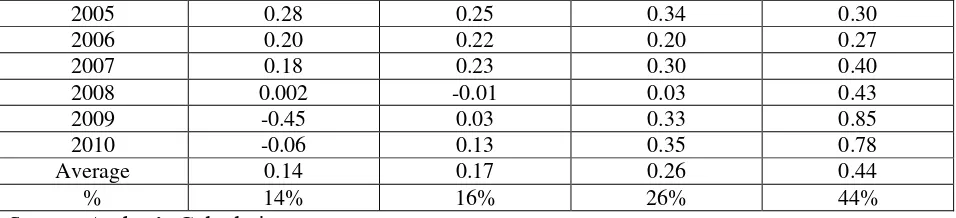
In reality, the network effect does occur in ASEAN-5 countries on their trade relationship with China. The table below demonstrates the growing importance of China within ASEAN-5 trade direction.
TABLE 9. TRADE DIRECTION OF ASEAN-5 TO SELECTED COUNTRIES
Year % AS % EU % Japan % China
2005 0.28 0.25 0.34 0.30
2006 0.20 0.22 0.20 0.27
2007 0.18 0.23 0.30 0.40
2008 0.002 -0.01 0.03 0.43
2009 -0.45 0.03 0.33 0.85
2010 -0.06 0.13 0.35 0.78
Average 0.14 0.17 0.26 0.44
% 14% 16% 26% 44%
Source: Author‟s Calculation
Table 9 shows ASEAN-5 countries are dominantly trading with China, around 44% of the four selected trading partner. Swoboda (1968) argues that if residents of a country can only hold non-interest bearing foreign currency assets, and their revenues or expenditures are at least partly denominated in a foreign currency, and also owing to transaction costs (e.g. brokers‟ fees, bookkeeping, psychological inconvenience, etc.), then it is profitable for them to hold foreign currency cash balances. Krugman (1980) develops a formal three-country, three-currency model, where the transaction costs decline as the size of the market increases. He shows that only the currency with dominant economy can serve as a vehicle currency. Moreover, once a currency serve as international medium of exchange, its vehicle role becomes self-reinforcing and may persist even when its economic power diminishes. This theoretical view is in line with high penetration of Cina towards ASEAN-5 market.
CONCLUSIONS AND RECOMMENDATIONS
5.1CONCLUSIONS
5.1.1 The paper tries to examine various currency baskets, either common baskets currency or individual baskets currency. The eight possible currency baskets are in place, namely US$-Euro/AERU, US$-Euro-Yen/AERU, US$-Euro-Yen-Yuan/AERU, US$/AERU, Euro/AERU, Yen/AERU, Yuan/AERU, and SGD/AERU. Therefore, by incorporating all above mentioned currency baskets, the paper aims at (1) developing the hypothetical currency unit in ASEAN-5 under normal and crisis period, (2) investigating under which currency baskets the AERU will have been stable or low volatility, both in normal and crisis period, and (3) proposing the member countries which are eligible to join monetary union or an optimum currency area.
5.1.2 The hypothetical currency unit is developed by including several steps into consideration, namely.
5.1.3 Determining the weights either on common baskets currencies (Euro, US$-Euro-Yen, US$-Euro-Yen-Yuan) or individual baskets currency (US$, Euro, Yen, Yuan, SGD) by taking the weights of each basket currency which are set to unity and based on their proportion of trade balance over total trade balance. For US$-Euro; US$-Euro-Yen; US$-Euro-Yen-Yuan, the weights are set 58%-42%; 34%-35%-31%; 22%-22%-20%-36%, respectively. While, for individual baskets currency, her share is set to unity, 100%, respectively.
2004. Thus, three years, 2004, 2005, 2006, are set for normal period, meanwhile four years, 2007, 2008, 2009, and 2010, are included into crisis period.
5.1.5 Calculating the country‟s shares over various economic sizes, both for normal and crisis period, namely: trade volume, nominal GDP, GDP measured at PPP, and international reserves (minus gold). The shares are distributed according the important role of respected ASRAN-5 countries in the economy. The results state that Indonesia hold the highest weights in terms of nominal GDP and GDP measured at PPP, around 30%-39%over both period. Trade volume and international reserve (minus gold) are dominated largely by Singapore, roughly 36%-59%, while Philippines has the lowest weights on all mentioned size indicators.
5.1.6 Determining the year 2008 as the benchmark period and benchmark exchange rate. it is selected for ASEAN-5 base period since ASEAN-5 trade balance with all observed currency baskets‟ countries are close to zero.
5.1.7 Determining the most stable economic size indicator based on the lowest rates of change on their standard deviation for every currency baskets against AERU. 5.1.8 Calculating the AERU conversion rate in terms of various currency baskets against
AERU as well as ASEAN-5 currencies against AERU, both in normal and crisis periods.
5.1.9 To measure the degree of volatility among various currency baskets arrangement, a technique is employed, namely the nominal deviation indicator (NDI)
5.1.10 The paper also tests the degree of deviation from central grid parity by monitoring their percentage movements. The results suggest that Yuan has the lowest number of average deviation, both in normal and crisis periods. Thus, ASEAN-5 currencies are recommended to value the AERU in terms of Yuan in order to maintain ASEAN-5 currencies‟ stability.
5.2RECOMMENDATIONS
5.2.1 Due to the AERU implementation necessitates stronger cooperation among member states in the region, so that they should establish consensus on many technical issues of AERU, including assignment of currency weights, selection of base year, and grouping of currencies included in the AERU, and period of weight revision. In terms of base year selection, it should be revised periodically in order to reflect current market condition. The chosen base year could be also based not only trade balance, but also inflation rates, interest rates, GDP growth, and ratio GDP over debt, ratio budget deficit over GDP. In terms of currency weights, to avoid the excess or the concentrated weights on one particular country, setting an upper limit of 33.3% to the weight of the largest share of a currency, could be an alternative way.


![Uji aktivitas antioksidan dengan metode spektrofotometri visibel menggunakan deoksiribosa dan penentuan kadar flavonoid total fraksi etil asetat buah ketapang [Terminilia catappa L.].](data:image/gif;base64,R0lGODlhAQABAIAAAP///wAAACH5BAEAAAAALAAAAAABAAEAAAICRAEAOw==)