CONTAMINATION VULNERABILITY ANALYSIS OF WATERSHED FOR WATER QUALITY MONITORING
Study in Gajahwong Watershed Yogyakarta Province
By:
Dra. M. Widyastuti, M.T., and Dr. Slamet Suprayogi, M.S. Faculty of Geography, Gadjah Mada University, Yogyakarta - Indonesia
ABSTRACT
T
his research is an early step to determine the location of rain gauge station for artificial neural networkmodeling. The implementation of this model is very useful for water quality monitoring. The objectives of this study are: 1) to study the distribution of watershed parameter, that are average annual precipitation, land use and land-surface slope, 2) to conduct vulnerability analysis of watershed contamination, 3) to determine the location of rain gauge station.
The study was performed by weighing and rating method of watershed parameters. The vulnerability degree of watershed to contamination is presented as vulnerability index. This index is determined by overall sum of all multiplication between score and weigh number of each parameter. All data manipulation and data analysis were performed by using Geographic Information System (ArcView version by 3.2). The vulnerability of watershed contamination map had been generated using overlay operation of parameters.
The results show that vulnerability index are varies between 10 up to 40 intervals. Hence, the indexes were categorized into three levels of watershed vulnerability, namely low (10 – 20), moderate (20 – 30) and high (30 – 40). It is found that the study area covered more by high vulnerability of watershed to contamination. The zoning of watershed vulnerability meant to determine the rain gauge location. There are three rain gauge stations on the area that they are in a high vulnerability level, whereas the other vulnerability level area has one rain gauge station. Each level of vulnerability area is able to represent the source of contaminant that it maybe influence the water quality of Gajahwong river.
Key words : vulnerability, contamination, watershed
INTRODUCTION
Clean water is a serious problem in urban society. Generally, the water resource of urban area is from the river. The prob-lem in urban area is river water contamina-tion. The development of river water moni-toring model (Artificial Neural Network – ANN) became important. There are some steps for those modeling, i.e.: taking sample of river water in outlet of tributary, staff gauge installation for water level recording
in outlet of tributary, rain gauge installa-tion in each sub catchments area (Suprayogi, et.al, 2005)
of vulnerable area. Each rainfall data will be paired by river water quality data for the ANN modeling necessity.
The chemical composition of natu-ral water is determined by many different sources of solute, including gases and aero-sol from the atmosphere, weathering, and erosion of rock and soils, solution or pre-cipitation reactions occurring below the land surface, and culture effects resulting from activities of man (Hem, 1970). River water quality changes rapidly than ground-water quality because the former is more open than the other. The river water is de-graded when its quality parameters are changed beyond their natural variation by introduction or removal of certain sub-stance. The degradation may impair the usefulness of water.
Contamination vulnerability concept of groundwater is introduced firstly than surface water vulnerability concept. The concept of groundwater vulnerability is based on the assumption that physical en-vironment may provide some degree of protection to contamination entering groundwater (Vrba and Zaporozec, 1994). That is meant the intrinsic vulnerability. The physical characteristics are the depth to water table, recharge, lithology, soil, and hydraulic conductivity. Rosen (1994) con-ducted the vulnerability of groundwater to contamination research on Swedish using DRASTIC method. The other research that is conducted using DRASTIC was devel-oped by Widyastuti (2004) to asses the groundwater to contamination. Ferreira (1997) distinguishes the term of ground-water to contamination and the pollution risk. The letter was not only based on the intrinsic vulnerability but also the sources of pollution.
There is no strict different concept between surface water and groundwater vulnerability. The rating and weight of watershed vulnerability parameters was dif-ferent to groundwater vulnerability param-eters. Eimers et al (2000) have done the research of watershed characteristics rat-ing. The factors applied for determination of watershed characteristic ratings are av-erage annual precipitation, land-surface slope, land cover or land use, and ground-water contribution. Different parts of the physical environment have varying capaci-ties for attenuation contaminants.
Geographic Information System (GIS) (Burrough, 1986) is a tool that is used to collect, to save, to active, to trans-form, and to present of phenomena spatial data on the earth for special objectives. Besides, GIS can supply analysis range widely and spatially from geographically and non spatially data. The technically mapping could be done manually or com-puterize using GIS (Vrba and Zaporosec, 1994). Some vulnerability of groundwater to contamination researches is based on the GIS approach.
Based on these fact, this research has three main objectives : 1) to study the dis-tribution of watershed parameter, which are average annual precipitation, land use and land-surface slope, 2) to analyze the conta-mination vulnerability of watershed , 3) to determine the location of rain gauge station.
METHODS
This research applies the Point Count System Model (PCSMs) to evaluate the vulnerable of watershed. This model em-ploys a numerical ranking system that as-signs relative weight to various parameters of watershed. The watershed characteris-tic rating is based on a combination of fac-tors that contribute to the likelihood that water will reach surface water by following the path of overland flow. The selected fac-tors, which can be represented as spatial data layer in the Geographic Information System (GIS), include average annual pre-cipitation, land-surface slope and land use. Each variable is given interval from 1 to 10, and further more each parameter has an interval of weight 1 to 3. A rating of 1 reflects a low contribution to inherent vul-nerability and 10 reflects a high contribu-tion. The most significant parameters have
weight of 3; while the least significant pa-rameters have weight of 1. Each factor and its rating and weight is listed on Tables 1 and 2. The rating for each interval is multi-plied by weight for the parameter and the products are summed to obtain the final numerical score that provides relative mea-sure of vulnerability. The simple formula is presented as follow:
VI = RwRr + TwTr + LwLr
where :
VI = vulnerability index R
w = weights assigned to average annual precipitation
R
r = ratings assigned to average annual precipitation
T
w = weights for topography (land-sur-face slope)
T
r = ratings for topography (land-surface slope)
L
w = weights for land use L
w = ratings for land use
Data processing and analyzing had been done by using GIS, i.e. Arc/View soft-ware version 3.2. The each factor was mapped the overlaid to obtain the contami-nation vulnerability of watershed.
Table 1. Factors that contribute to the watershed characteristic rating (modified from Eimers, et al., 2000)
Factor Relevance of the factor Weight
Land-surface slope The inclination, or change in elevation, of the land surface indicate the likelihood that precipitation will infiltrate or runoff
1
Average annual precipitation
The sources of water that travel overland to streams or lake
2
Land use The type of land use influences the likelihood of potential non-point source contamination
RESULT AND DISCUSSIONS
Land-surface Slope
Land-surface slope determines the amount of precipitation to become overland flow and surface water or ponds storage. The relation between slope and the occurrence of overland flow has underscored by its ef-fect on the water quality. Surface water is more vulnerable to contamination in areas of steeper surface slope. When all other fac-tors are the same, precipitation infiltrates into the subsurface in areas characterized by low slope, whereas precipitation runs off land surface in areas which has a high slope. Slope in the research area was divided into three categories, i.e. less then 8 %, 8 to 15 % and 15 to 25 %. Most of the study area had slope less than 8 % and they covered Sleman re-gency, Yogya city and Bantul regency. Small part of study area had slope more than 8 % and lay on the Sleman regency or the upper of Gajahwong watershed.
Average Annual Precipitation
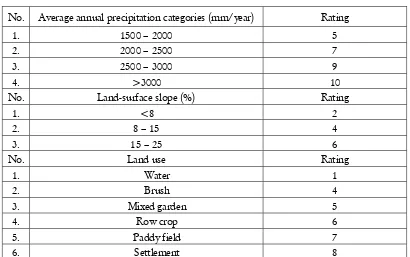
The average annual precipitation rep-resents the mass of water that becomes available for transport in a watershed. Pre-cipitation is the sources of overland flow to stream or lake. It is assumed that the higher amount of the rainfall is the greater chance of the contaminant transported through the overland flow. The period of rainfall data selection was last ten years (1994 –2003). In study area, average an-nual precipitation varies from 1500 to more than 3000 mm. The average annual precipi-tation was categorized in increment of 500 mm, from 1500 to more than 3000 mm. The distribution of rainfall related to its topography, the upper stream received more than 3000 mm/years. Small part of the study area received about 2500 to 3000 mm/year. It also covered in the upper of watershed. The rainfall distribution in the middle part of Gajahwong watershed was 2000 to 2500 mm/years, and then in the No. Average annual precipitation categories (mm/year) Rating
1. 1500 – 2000 5
2. 2000 – 2500 7
3. 2500 – 3000 9
4. > 3000 10
No. Land-surface slope (%) Rating
1. < 8 2
2. 8 – 15 4
3. 15 – 25 6
No. Land use Rating
1. Water 1
2. Brush 4
3. Mixed garden 5
4. Row crop 6
5. Paddy field 7
6. Settlement 8
lower stream was 1500 – 2000 mm/year. Average precipitation in the research area has a high categorized. The most of study area has average annual precipitation be-tween 1500 to 2500 mm/year.
Land use
Land use describes human activities on the land surface. This factor represents the potential generation of non point-source contamination resulted from human activities. Land use also influences the per-centage of precipitation that runs off as overland flow. Each land use type has dif-ferent contribution to the water quality. It depends on the amount of waste that it might be produced from each activity. It is also shown on the Table 2. The land use was predict has a high contribution on stream contamination; it has a high rated. The data source of land use is derived from topographical map. There are six catego-ries of the land use in the research area, i.e.: water (5 ha), brush (0,07 ha), mixed garden (111,8 ha), row crop (59,9 ha), paddy field (1891,83 ha) and settlement (2578,35 ha). The study area mostly covered by settlement and paddy field land use types. So, the land use in the study area has more contribution on the vulnerability level.
Contamination Vulnerability of Water-shed
Contamination vulnerability of watershed is the rate of sensitiveness to be polluted. Spatial distribution of watershed vulnerability is obtained by overlaying all
parameters map, i.e. land surface slope, ave-rage annual precipitation and land use. The map of contamination vulnerability of wa-tershed is presented on Figure 1. The vulne-rability index (VI) is an indication of water-shed vulnerability level. Those index ranges from 10 to 40, and they are categorized into three classifications (see on Table 3).
The areas of high vulnerability cat-egories is predominant, i.e. 3.203,393 ha (64,34%) in the research area. The moder-ate vulnerability cmoder-ategory areas occupy an area at 1.645,324 ha (33,87%), while the low vulnerability areas is 8,693 ha (1.79%). The result showed that the river in the study area is vulnerable to contamination. This vulnerable is influenced mostly by land use. It is assumed that the greater settle-ment tend to produce more domestic waste. Besides, the average annual precipitation also has a high contribution. Most of the study area is covered by a high rainfall.
Based on the vulnerability level in the research area, rain gauge stations are in-stalled. The distribution of rain gauge de-pends on the area of each vulnerability level. It is meant to be able to represent each vulnerability level area. There are three rain gauge stations that are installed in the high vulnerability areas, whereas in the other vulnerability levels there is one rain gauge station. Each rainfall data in each vulnerability degree in the study area will be paired by river water quality data for the ANN modeling necessity.
Table 3. Classification of Contamination Vulnerability in Study Area
No Vulnerability Index Categories
1. 10 – 20 Low
2. 20 – 30 Moderate
G
Projection : Universal Tranverse Mercator Zone 49 S
22 00 2 Kilometers2km
Source : Analysis 2005 stream
CONCLUDING REMARKS
The range of vulnerability index in study area is 10 – 40. They are divided into three categories, i.e. : low (10 – 20), mod-erate (20 – 30), and high (30 – 40). More than 50 % of the research area is catego-rized as high vulnerability. The areas of low vulnerability category are 8,693 ha (1.79%), moderate vulnerability category are 1.645,324 ha (33,87%) and high vulnerabil-ity category are 3.203,393 ha (64,34%). This vulnerable is influenced mostly by land use, and also the average annual precipita-tion. The installation of rain gauge station represents area of each vulnerability level.
There are three rain gauge stations that are installed in the high vulnerability areas, whereas in the other vulnerability levels there is one rain gauge station.
ACKNOWLEDGEMENT
Part of this study is funded by a Di-rectorate of High Education, Ministry of Education (Fiscal Year 2005 : 11 April 2005; Number : 034/SPPP/PP/ DPPM/ 2005). The authors wish to extend their gratitude to Mr. Junun Sartohadi, PhD, M.Sc. and Arif Ismail, S.Si., for their helps during the finishing of this article.
REFERENCES
Borrough, PA. 1986. Principle of Geographical Information System for Land Resources Assesment. Clarendon Press, Oxford.
Eimers, J.L., Weaver, J.C., Terziotti, S. and Midgette, R.W. 2000. Method of Rating Unsaturated
Zone and Watershed Characteristic of Public Water Supplies in North Carolina. USGS, Raleigh,
North Carolina
Ferreira, J.P.L dan Oliveira, M.M. 1997. DRASTIC Groundwater VulnerabilitY Mapping of Portugal. Proceeding of the 27th Conggress of The International Association for Hydraulic Research. San Fransisco, USA.
Ferreira, J.P.L. 1997. GIS and Mathematical Modelling for the Assesment of Vulnaribility and Geographical Zoning for Groundwater Management and Protection. Paper of NATO Advanced Workshop. Vilnius, Lithuania.
Hem, J.D., 1970. Study and Interpretation of the Chemical Characteristic of Natural Water. United State Government Printing Office, Washington.
Rosen, L. 1994. A Study of the DRASTIC Methodology with Empahsis on Swedish Condition. Groundwater 32 (2), 278 - 285.
Slamet Suprayogi, Budi Indra Setiawan, Widyastuti, M., Harjito, Rudiyanto. 2005. Penerapan Model Artificial Neural Network untuk Monitoring Kualitas Air. Laporan Penelitian
Hibah Bersaing XII. Lembaga Penelitian, Universitas Gadjah Mada, Yogyakarta.