ABSTRAK
Kajian ini merupakan penilaian prestasi produktiviti industri pembuatan yang menghasilkan bahagian-bahagian elektrik. Penilaian menggunakan teknik simulasi. Objektif kajian ini selain daripada penilaian prestasi sistem semasa, juga akan mencadangkan beberapa peningkatan produktiviti. Simulasi membantu dalam memberi gambaran tentang bagaimana yang baik adalah kerja-kerja sistem sebenar. Ia juga menunjukkan pengukuran prestasi sistem dan keadaan sistem sebenar dalam industri. Terdapat banyak produk di kilang ini. Sistem pengeluaran mengikuti pekerjaan model kedai, di mana pengeluaran bermula apabila terdapat suatu perintah daripada pelanggan. Susun atur pengeluaran berikut susun atur proses, di mana mesin mengatur dalam proses. Oleh kerana banyak produk, projek ini telah memberi tumpuan pada bahagian elektrik produk Panjang Lampu Lurus sahaja. Lain-lain produk berasaskan sebahagian daripada syarikat itu tidak akan dibincangkan dalam laporan ini. Dari simulasi yang dijalankan, ia telah dikenal pasti keadaan kesesakan dalam sistem pengeluaran bahagian elektrik semasa. Untuk memperbaiki keadaan ini, beberapa penyelesaian alternatif telah dicadangkan. Tiga penyelesaian alternatif telah dicadangkan. Alternatif ini adalah: 1) Mengurangkan saiz kumpulan, 2) Menambah satu Mesin Kimpalan; 3) Gabungan meminimumkan kumpulan dan menambah satu mesin kimpalan. Antara alternatif, gabungan mengurangkan saiz kumpulan dan menambah satu mesin kimpalan model telah dipilih kerana dapat mengurangkan masa pemprosesan dan masa menunggu.
ABSTRACT
This study is an evaluation of productivity performance of manufacturing industry which produces electrical parts. The evaluation uses simulation techniques. The objectives of this study other than evaluation of current systems performance, also would proposed some productivity improvement. Simulation helps in giving the overview about how good is the real system works. It also shows the measurement of the system performance and condition of the real system in the industry. There are many products in this factory. The production systems follow job shop modeling, where the production starts when there is an order from the customer. The layout of production follows process layout, where the machine arrange in process. Due to many products, this project was focusing on electrical part of Straight Lighting Long product only. Others part based product of the company will not be discussed in the report. From the simulation conducted, it was identified a bottleneck situation in the current production system of electrical part. To improve the situation, some alternatives solution has been proposed. Three alternatives solution has been proposed. These alternatives are: 1) Minimizing batch size; 2) Adding one Welding Machine; 3) A combination of Minimizing batch and adding one welding machine. Among the alternatives, combination of minimizing batch size and adding one welding machine model was selected due to reduce processing time and waiting time.
DEDICATION
To my beloved parents
I dedicate this technical report to my parents. Without their patience, understanding, support, and most of all love, the completion of this work would not have been
possible.
To my faculty supervisor for his guidance throughout the project
ACKNOWLEDGEMENT
I would like to thank my faculty supervisor Prof. Dr. Adi Saptari for his guidance throughout the project and his willingness to spend his time to discuss with me about the project. I also would like to thank my parents for supporting me mentally and physically.
TABLE OF CONTENT
2.2.1 Basic Simulation Concepts 10
2.2.1.1 Basic Simulation Model Component 11
2.2.5 Disadvantages of Simulation Models 18
3.3 Flowchart in Second Semester of Final Year Project (PSM 2) 28 3.3.1 Observation in Real System 29
4.3.3.1 Statistical Description 55
4.3.3.2 Determination of Sample Size 56
4.3.3.3 T-Test 58
CHAPTER 5: MODEL EXPERIMANTATION, RESULT
AND DISCUSSION 59
5.1 Result 59
5.2 Model Experimentation 63
5.2.1 Minimizing Batch Size Model 63 5.2.2 Adding One Welding Machine Model 64 5.2.3 Combination of Minimizing Batch Size and Adding One Welding
Machine Model 65
5.1 Discussion 68
CHAPTER 6: CONCLUSION AND RECOMMENDATION 70
6.1 Conclusion 70
6.2 Recommendation 71
REFERENCES 73
APPENDICES
A Gantt chart B Cycle Time
LIST OF TABLES
4.1 The total production quantity and its percentage of electrical products produce in Jati Beringin Sdn. Bhd.
33
4.2 Summary of electrical part in Straight Lighting Long product’s production flow
38
4.3
4.4
4.5
Electrical part in Straight Lighting Long product’s production system illustration
Sample data of cycle time for first 20 units cutting part Material P3 (Mild Steel Part)
Details for each elements in the simulation
40
Buffer of the system and its detail Shift Pattern in the production line
Result summarized of replication of total average output per month for electrical part in Straight Lighting Long product
49 50 54
4.9 Statistic description for the total average output per month 55
5.1 The average waiting time in the buffer for each machine 60 5.2 Comparison of current production with the improvement
alternatives
67
LIST OF FIGURES
2.1 Factors Affecting Productivity 8
2.2 Basic simulation model component 11
2.3 2.4 2.5 2.6 2.7
Single server – single queue model Single Servers – Server Queue model Several Server – Single Queue model Several Server – Several Queue model Multiple Server in a series model
13 13 13 14 14
3.1 The overall flowchart of the project 24
3.2 Process flowchart for research PSM 1 25
3.3 Framework of the step in simulation 27
3.4 Process flowchart for research PSM 2 28
4.1 Pareto diagram for total production quantity of electrical products in Jati Beringin Sdn. Bhd.
34
4.2 Production flow for electrical part in Straight Lighting Long product
36
4.3 Descriptive statistic for cycle time of cutting and marking machine for Material P3 (Mild Steel Part)
42 4.4 Histogram for cycle time of cutting for Material P3 (Mild Steel
Part)
43
4.5 Probability plot of the data for normal distribution 44 4.6 Probability plot of the data for exponential distribution 44 4.7 Probability plot of the data for extreme value distribution 45 4.8 Probability plot of the data for logistic distribution 45
4.9 The simulation model in Witness 51
4.10 Verification process flow diagram of electrical part in Straight Lighting Long
52
4.11 The simulation model after run 53
4.12 Statistic description for the total average output per month 55
4.13 Specify values required to obtain the sample size of total average output per month
5
4.14 Result of power and the sample size of total average output per month
57
4.15 Graph of power and sample size required for total average output per month of electrical part in Straight Lighting Long product
57
4.16 T-test for total average output per month 58
5.1 Illustration of simulation model for current system of electrical part
61
5.2 Result of simulation model for current production system of electrical part in Straight Lighting Long product
62
5.3 Result of minimizing batch size 63
5.4 Result of average waiting time in buffer for welding machine 64
5.5 Result of adding one welding machine 64
5.6 Result of average waiting time in buffer for welding machine 65 5.7 Result of combination of minimizing batch size and adding one
welding machine model
65
5.8 Result of average waiting time in buffer for welding machine 66 5.9 Combination of minimize batch size and adding one welding
machine model
66
5.10 Comparison on the average total cycle time of one complete product
68
5.11 Comparison on the duration to complete the company target 68 5.12 Comparison on the total average output per month 69 5.13 Comparison of waiting time in buffer for welding machine with
the improvement alternatives
69
LIST OF ABBREVIATIONS, SYMBOLS AND
NOMENCLATURE
FIFO - first-in-first-out LIFO - last-in-first-out
SPT - shortest processing time LPT - longest processing time
JIT - just-in-time
WIP - work-in-process
JBSB - Jati Beringin Sdn. Bhd.
This chapter presents the background of study, problem statements, objectives, and scope and limitation of study. In addition, the significance of study and the report outlines are also provided in this chapter.
1.1 Background of Study
Productivity is the entire measurement of ability for production of a good or service. In other definitions, productivity is the measurement of specified resources which had been managed to achieve the goals of quality and quantity on its time (Gough et
al., 2006). Definition of productivity is also known as an index that shows the
measurement of the output (goods and services) relative to the input (labor, materials, energy, etc., used to produce the output) (Gough et al., 2006). Besides that, productivity also can be expressed as the ratio of outputs (good and services) divides by the input (resources, such as labor and capital) (Stevenson et al., 2007).
Productivity = Output
Input
INTRODUCTION
CHAPTER 1
There are three element that should be consider for enhance the productivity which are physical capital, human capital and technology. The resources that can be made by human are known as physical while the human that have abilities and skills known as human capital. Technology is means as the technical that involve in production of goods and services. It can be simplified as the improvement of productivity will be increase due to the increasing of these three elements.
Flow process improvement is necessary for the production of industry in order to enhance the productivity of the product. The process should be continuous improve to increase the effectiveness and efficiency of the process in the production in term of human and machine. Reduction of variation process and elimination of non value added activities are the steps that can be taken by industry in order to enhance the improvement of the process flow. Therefore, the productivity of industry can be increase where the process flows on the production run without produce any kind of waste and unnecessary process.
To improve the flow process, the simulation can be used as a tool to enhance the productivity in industry. By using simulation, the industry can evaluate behaviour of a manufacturing process with different of situation to identify better flow process. Simulation can increase the understanding of the system operates and minimizing the waste that associated by experimenting on the actual system. For example of the application of manufacturing simulation are implementing new manufacturing concept, improving existing process production scheduling and improving resources utilization(George et al., 1999).
Simulation is the imitation of the operation of a real-world process or system over time (Banks et al., 2010). According to Mike Peterman (2000), process simulation has become a particular important tool where they can eliminate non value adding steps from the processes and enhance the efficiency of human and equipment. Many of the manufacturing industry used simulation as represent the dynamic manufacturing process in the computer model graphically and simulate the data collected from the real process to the model. Simulation also allows the industry to predict and forecast their production then test it with various parameters.
This study is about to develop the simulation model that analyzes the real process for identify production bottleneck and determine where the productivity improvement can be made in the process flow in electrical part manufacturing. Simulation also allows various scenarios to be tested without involving large investment on setting up the line or disrupting the production. The method to collect the data is take the data that recorded in industry that related to the process flow such as machine breakdown, tools availability, machine changeover etc.
1.2 Problem Statement
This study will be conducted at manufacturing industry which produces electric supporting parts. From preliminary observations, the industry wants to improve their productivity by eliminating the problem that affect the production performance. The flow process issues can be divided into several problems as summarized as follow:
a) The electrical part had to wait in the buffer until they are processed. It always happened in assembly area. It enhances the rate of inventory in the production.
b) The production need to improve their cycle time of product in order to increase the productivity of company since there are various products is produced by the company.
c) The worker available is not enough in the welding area. This cause of the bottleneck during the various productions.
1.3 Objectives
This study embarks the following objectives:
a) To investigate the problems those occur on the current process flow of production area.
b) To improve process flow of manufacturing production by constructing various alternative scenarios of flow process.
c) To propose alternative solution for production to reduce queuing and bottleneck problem.
1.4 Scope and Limitation of Study
This study focuses on flow process improvement through the simulation in electrical part manufacturing. WITNESS simulation software is used as the student tool in this study. This study is conducted at Jati Beringin Sdn. Bhd. which had been selected as the manufacturing industries for getting all the data and information for this study. Moreover, the implementation of suggested solution does not covered on this study. This study is to evaluate the performance of the production in the company in form of conceptual model and to identify problem faced and solution for the problems.
1.5 Significance of Study
This study may contribute to help the industry to enhance their productivity focus on the process flow improvement in the production. The industry also can consider all the solution of their problem for improvement in the short time by seeing the evaluation result in different scenarios on the simulation model without interrupt their production.
Moreover, this study can be as future reference and research for the academicians and industrials. The results from the study can be delivered to industry to enhance productivity of the production.
1.6 Report Outlines
This study starts with the investigation of flow process improvement through simulation in manufacturing. After analyse the process flow, the problem on production will be observed.
Chapter one provides background of study, problem statements, objectives, scope of the study and significance of study. The problem that occurs in production is clearly identified with objectives and scopes are set to concentrate on solving the particular problem.
In chapter two, the literature review of application flow process improvement through simulation on the manufacturing are presented. The details of simulation application that be used for design of manufacturing process, process improvement and production control.
Chapter three is all about methodology. It provides the methodology in identifying problem happen in the process flow in production. The definition of problem
formulation, define objective, constraint and scope, model verification and validation, documentation and present result and alternative solution and improvement will be shown in this chapter.
Chapter four explained the conceptual modeling of the electrical part in the production line and the data collected for the project. Besides that, it shows the model scopes, level of detail of the model, validation and verification of the simulation model.
Chapter five presents the results obtained from simulation model and validation from the experiment. The model has been constructed into various scenarios in order to find the optimal solution for the real production. The model must be validated for progress actions.
Chapter six provides the conclusion and recommendation about the improvement on the process flow of production. By observing the output results from previous chapter, the most effective among those suggested alternatives will be proposed to the industry. Further improvement and recommendations for this industry might also be included in this chapter.
This chapter presents the information regarding the literature review which related to the study. The information that related to the study that had been discussed in this chapter will be used in the methodology and discussion of the study in the study in order to assist the author to achieve the feasible results that needed based on the objectives of this study.
2.1 Productivity
According to Levary (1991), the relationship between the quantity of output and the quantity of input used to produce that output is called as productivity. Basically, the measurement of effectiveness and efficiency of organisation in producing output with the resources provided. Its measurement also used for identification and estimation of the proper output and input measures. In short, productivity is defined as the ratio of output to input.
Productivity is a significant element in economic growth. With expresses the relationship between the output and input in ratio, the production process can be measured in physical terms (Lee, 1987). The measure of productivity is the measures of the efficiency to the resources used. It shows that the productivity can measure every production system within the industry. The measurement of productivity will act as the benchmark for help to ease make improvement on the production of industry (Nachum, 1999).
LITERATURE REVIEW
CHAPTER 2
2.1.1 Factors Influence Productivity
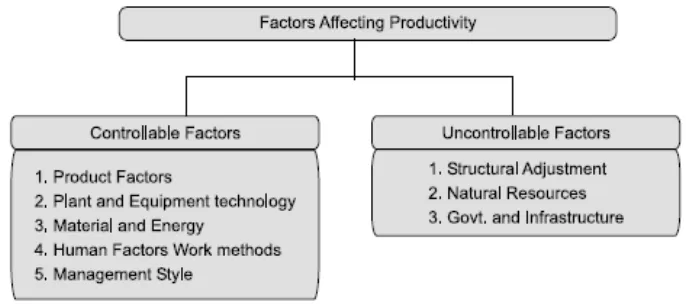
According to Buffet (2007), there are two categories of factors that influence the productivity which are:
a) Controllable (or internal) factors; b) Uncontrollable (external) factors.
Figure 2.1 shows the factors affecting the productivity (Buffet, 2007).
Figure 2.1: Factors Affecting Productivity (Buffet, 2007)
Controllable or Internal Factors
(a) Product factor
In term of productivity, it means the measurement on how the product meets output requirement by its usefulness.
(b) Plant and Equipment Technology
The availability of the plant increase through the increased of proper maintenance and the idle time reduction will enhance the productivity. The latest technology will help to increase the productivity.
(c) Material and Energy
Material reductions also enhance the productivity improvement. (d) Human Factors Work Methods
To enhance the productivity, the work method must be improved. (e) Management Style
Dynamic management style has a better approach to achieve the higher of productivity.
Controllable or External Factors
(a) Structural Adjustment
It includes economic and social changes which plays significant role in the improvement of productivity.
(b) Natural Resources
Man power, land and raw materials are vital to the productivity improvement. (c) Government and Infrastructure
It significant influences the productivity to the higher extent.
2.2 Simulation Modelling and Analysis
Simulation can be used for assessing the productivity of manufacturing system. Simulation has become important in the past few years and allows designers imagine new systems and enable them to quantify and observed the system behavior. Whether the system is a production line, an operating room or an emergency-response system, simulation can be used to study and compare alternative designs or to troubleshoot existing systems. Several researchers have studied performance by using simulation techniques with the first uses dating back to at least the early 1960’s (Hosseinpour and Hajihosseini, 2009).
Simulation modeling tools and techniques has been used numerously to improve manufacturing efficiency over the last four decades. An increasing number of manufacturing system decisions are being made based on the use of models, their use is still sporadic in manufacturing environments (Fowler and Rose, 2004).
Simulation is the imitation of the operation of real-world process or system over time (Banks et al., 2009). Simulation modeling and analysis however is the process of creating and experimenting with computerized mathematical model of a physical system (Chung, 2003). Obaidat and Papadimitrou (2003) define the simulation as the