Sci.Int.(Lahore),26(4),1487-1491,2014 ISSN 1013-5316; CODEN: SINTE 8 1487
AUTOMATION-TESTING FOR MONITORING THE NETWORK
HEALTH OF MANUFACTURING WEB-BASED APPLICATION
Zakiah Ayop 1, Nuridawati Mustafa 1, Jonathan Chang2, Wong Boon Min2, Zaheera Zainal Abidin1,Lim Jie Hui2 and Syarulnaziah Anawar1
1
Faculty of Information and Communication Technology, Melaka National Technical University, Hang Tuah Jaya, 76100 Durian Tunggal, Melaka, Malaysia
2
Factory Integration, Infineon Technologies (Malaysia) Sdn. Bhd., Free Trade Zone, Batu Berendam, 75350 Melaka, Malaysia.
Email: [email protected], [email protected], [email protected], [email protected], [email protected], [email protected], [email protected] ABSTRACT : In this research, automation-testing approach is proposed to monitor the manufacturing
web-based health application. Current monitoring system indicates that all components such as servers, applications, services, ports and URLs are not in critical condition, but operator on the production site could not operate the manufacturing application. The proposed approach will monitor the standard operation in manufacturing web-based application and determine the health state of the whole production. Automated script is executed and response time is captured as the performance indicator. A web-based reporting will display response times mapped in different graphs. From the preliminary testing result, graphs are compared and analyze. Finally, the comparison result will determine the abnormalities of the manufacturing application.
KEYWORDS: automation, monitoring, manufacturing application
1.0
INTRODUCTIONA collaborative monitoring system between system-level monitoring, application-level monitoring, end-to-end monitoring, custom monitoring, log analysis and with notifications integration is commonly adopted in global manufacturing companies to increase and improve the coverage of anomaly detection within short span of time. In distributed manufacturing systems such as oilfields, research has been conducted to monitor the steps of the productive process and to support decision-making into oilfields onshore. This specific ontology has been developed with the aim to provide agents with sufficient knowledge to manager components of oilfields [2]. This research is essential where some configuration changes in its components are required and due to complex decisions and too many intervening variables should be made by the managers and operators.
According to [3], this rating system and monitoring scheme is to monitor textile-stitching nonconformities conditions based on fuzzy weight and charting scheme. It is vital due to
intensified competition in the global marketplace that has
made organizations around the world realize that their survival highly depends on whether their provided products or services meet or surpass customer’s expectations. This demerit-fuzzy rating system, monitoring scheme and
classification is essential to monitor online manufacturing
processes.
A typical semiconductor backend assembly and test facility generally has a wide variety of products with each requiring different route specifications which resulting a considerable amount of process flows or routings. Monitoring is part of Modelling and Simulation Application component in backend assembly and test facility whereby monitoring agents monitor key performance indicators of the physical system. The status of the manufacturing system is collected by the monitoring agents to be updated into the database [1].
The monitoring agent will report any anomalies in the emulated system and triggers a what-if analysis to carry out simulation-based optimization to decide the best approach for handling the situation.
Automation testing is applied in managing product testing to minimize impact on manufacturing output [4]. Integrated test automation is used to run simulation of production wafers in a set of high-volume level prior to the production release. However, this study [1,4] does not monitor production in real time.
SOCRADES architecture [5], integrates web services from all corporate functions via Service-Oriented Architecture on the shop floor providing flexible processes with information visibility. This research focused on Internet-based process control has only resulted in small-scale capability.
Back-End operation in semiconductor manufacturing used integration from several software and tools for their high volume production. To ensure smooth operation, these tools and all components affected are monitored and managed 24x7 through customized web monitoring system. However, problems arise when software, servers, services and ports are healthy but the production sites could not operate the manufacturing application.
based on different variables (loading, operators, etc) for the next phase of analysis such as stabilizing the performance to an accepted time response.
This paper is organized as follows: The next section explains implementation details of automation-testing approach which entails theoretical framework of this study, methodology, automation testing design, data collection, data validation and data pre-processing. the process flow, performance indicator and experimental setup. Section 4.0 provides the preliminary result and discussion. Section 5.0 concludes some remarks and future work.
2.0
IMPLEMENTATION DETAIL
2.1
Theoretical FrameworkAutomation-testing approach is based on web-based test automation framework in Figure 1 as it can be adapted to other tools. For this project, we added database (DB) for storing a mass of Test Data to pump into the test script and result data returned from the test. Section 2.3.2 explains the test script design proposed for this study.
Figure 1:Web-based test automation framework [8]
Figure 2: Methodology for monitoring manufacturing application through automation testing approach
Automation Test Monitoring Server Login
Grant access
Access Menu MySQL
Automation Test Monitoring Dashboard Display Menu
Query equipment
Automate Script
Display Lots
Calculate time taken
Calculate ti me taken
Logout session
Store respo
nse ti
me Display Graph
Monitoring Application System Pump Response Time
Troubleshooting Team Notify
View
Manufacturing Web-based Application
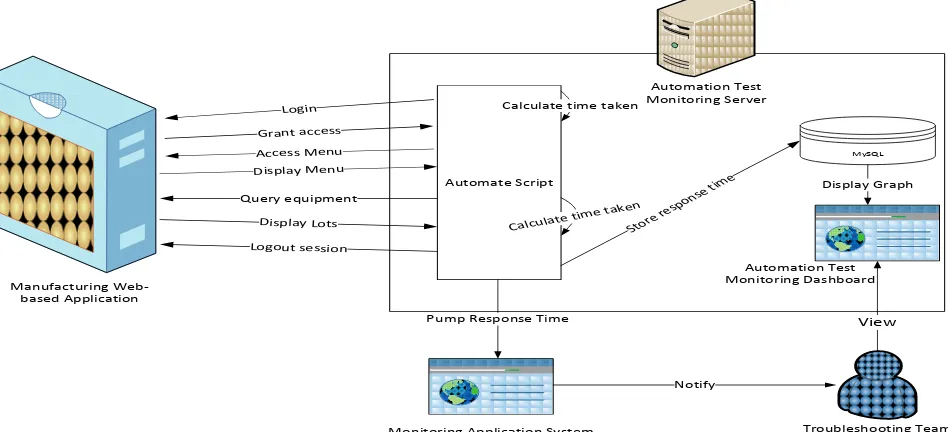
Figure 3: The proposed automation-testing for monitoring network health
RT
A=
(RTT × Turns) +
+ SPT + CPT
- R
z(1)
where
RTT = Round Trip Time;
SPT
= Server Processing Time;
CPT
= Client Processing Time;
R
z= hop-to-hop RTT
Analysis of Existing System
Automation Pilot Test
Data Collection
Data Validation
Data Pre-processing
Evaluation Test Config Test Type (UI Test or Loading Test)
Test Case
Test Script Test Report
Web Application
Run Test Action Return Result DB
Sci.Int.(Lahore),26(4),1487-1491,2014 ISSN 1013-5316; CODEN: SINTE 8 1489
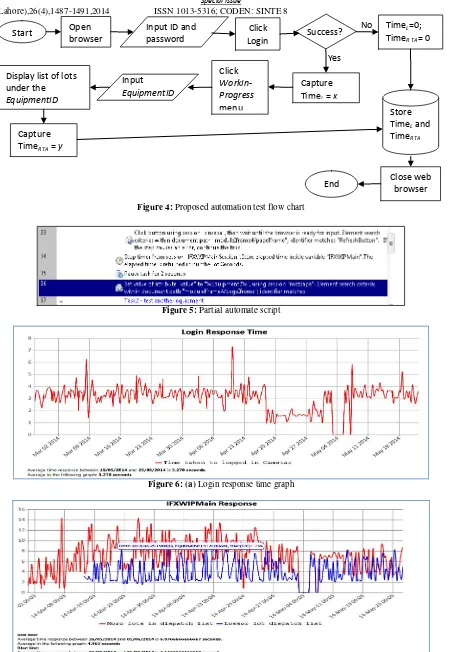
Figure 4: Proposed automation test flow chart
Figure 5: Partial automate script
Figure 6: (a) Login response time graph
Figure 6(b): WorkInProgress response time graph display
Start Open browser
Input ID and password
Click
Login Success?
TimeL=0;
TimeR TA= 0
No
Click WorkIn-Progress menu
Capture TimeRTA = y
Yes
Input EquipmentID
Capture TimeL = x
Display list of lots under the EquipmentID
Store TimeLand
TimeRTA
2.2
MethodologyOur methodology of carrying out this study is illustrated in Figure 2. Analysis of existing system consists of interviewing users, testing, manufacturing application and analysis of current monitoring system. Automation pilot test is done in staging environment where we are running automation test to applications that is not used for manufacturing chips in the production but mainly for simulation. Based on data collected in pilot test, we start to carry out the real automation testing in data collection phase. In this phase, configuration and scripting is done in real environment and data is collected will be validated to the next phase. Data collected is validated through a series of testing in the script to avoid noise data. Data pre-processed is where data collected is represented into a form of report. Lastly, evaluation is the phase where the engineers and IT admin analyse the information given and evaluate the current status of the system.
2.3
Automation-Testing Design 2.3.1 Performance IndicatorWe derive response time of the manufacturing application web page based on the formula in [6]. Response time is measured by executing additional scripts from the client side that will include not only server processing time but it will also include time required to establish connection as well as transmission time over network. Although measuring response-time at client side will give accurate representation of quality of service experienced by web-users, it involves those components which are not governed by web-server and may not be helpful in gaining deep insight into current status of server and measuring web-server performance alone. On the other side, if we measure response-time at server side, it will incur some overhead on server and will consume some amount of system resources which may compete with running applications and hinder their performance [7].
In accordance to the project objective, scripts is executed in client side to measure QOS experience by the operators. In addition, the web monitoring application in Infineon has already monitored the server side. To measure the performance of login process and WorkInProgress process, the equation (1) is used.
The script testing is running on one site. However, if the script testing is automated to another region where the script is reside, the Rz needs to be subtracted from RTA to exclude
the routers hop in the calculation. This is due to the automation license.
2.3.2 Proposed Automation-Testing
The overall operating flowchart of the proposed approach is shown in Figure 3. Standard transaction in manufacturing web-based application is automated through a customized script. Although it does not monitor the current transaction running by human operator, it does monitor standard transaction and eliminate the idle time between actions like human do. In this case, it will represent the health of the Manufacturing Web-based application flow process
2.4
Automation-Testing Design 2.3.1 Performance IndicatorWe derive response time of the manufacturing application web page based on the formula in [6]. Response time is measured by executing additional scripts from the client side that will include not only server processing time but it will also include time required to establish connection as well as transmission time over network. Although measuring response-time at client side will give accurate representation of quality of service experienced by web-users, it involves those components which are not governed by web-server and may not be helpful in gaining deep insight into current status of server and measuring web-server performance alone. On the other side, if we measure response-time at server side, it will incur some overhead on server and will
2.5
MethodologyAutomate test script is written based on Figure 4. Essentially, Automate Script is divided to 2 parts: part one is capturing the response time of Login process and part two is capturing the response time of WorkInProgressMain
Equipment ID query. Partial automate script can be seen in troubleshooting purposes. In this case, during a critical case occurred, the IT engineer do not need to be inside the system, as they can just click this button to identify the current situation.
2.6
Data CollectionThe overall environment of the system used Microsoft Server 2008. The manufacturing web-based application used IE8 which the client would access from. The software used for automating the process was scripted using Automate 9. The automation pilot test is done in one month whereas for data collection phase is in 3 months. Sampling data collected from this automation test are the client response time. We employed sampling data collection every hour. Due to heavy production, running the automation testing is scheduled per hourly as it must not hinge the manufacturing system.
2.7
Data Validation and Data Pre-ProcessingSci.Int.(Lahore),26(4),1487-1491,2014 ISSN 1013-5316; CODEN: SINTE 8 1491
MySQL and generate graph based on sites. It plots the data into graphs every 5 seconds and length of results display are set to daily or depends on the user. Figure 6(a) and (b) shows the graph modules display.
3.0
ANALYSIS AND EVALUATION
The preliminary results are illustrated in Figure 6(a) and (b). Graph in Figure 6(a) will determine the connection to the server. Y axis indicates time in seconds where as X axis is date and time of the script is tested. If the plot goes down to 0, it indicates the connection to the server is down and will notify the administrator of the server status through email or sms.
While in Figure 6(b), the graph determines the time taken to execute request to the database and displaying the result to webpage of WorkInProgress. If time of the script is plotted as 0 in login graph, the same logic is applied to the
WorkInProgress graph.
By comparing both graphs average to the normal average time expected by the administrator, this graph will determine abnormalities of the manufacturing application. In this case, when login graph is normal, WorkInProgress graph is expected to be normal too. But if the WorkInProgress graph average does not reflect the login graph average, then there are abnormalities in the manufacturing application such as poor database query management or poor QOS management.
4.0
CONCLUSION AND FUTURE WORKS
An extensible approach to the web monitoring system of the backend manufacturing operation was suggested. The testing results conclude that automation-testing able to determine the issues arise in the standard operation transaction. Although the result is still in preliminary stage, the automation-testing contributed into two fold; a new approach in monitoring system by giving real representation of quality of service experience by the production worker. Secondly, automation testing can be used as troubleshooting network health by integrating php script to the automation tool and deploy one click away feature to the monitoring system. This features, integrate into mobile application as part of future works will enable real time monitoring accessible anywhere and anytime.
ACKNOWLEDGEMENTS
This project is part of Infineon Melaka University
Collaboration Program under the Application “FI Application Overall Monitoring Framework”. The authors
gratefully acknowledge the technical contribution of Dr.
Jonathan Chang, Wong Boon Min, Lim Jie Hui, and BEAR Operation Team, Infineon Technologies. We thank our many partners from the Malacca and Singapore factories for their active participation.
REFERENCES
[1] M.Y.H. Low, K.W. Lye, P. Lendermann, S.J. Turner,
R.T.W. Chim, and S.H. Leo (2005). “An agent-based approach for managing symbiotic simulation of
semiconductor assembly and test operation.” In Proc. of the 4th International joint conference on Autonomous agents and multiagent systems (AAMAS '05). ACM, New York, NY, USA, 85-92..
[2] V. L. C. de Oliveira, A. P. M. Tanajura, H. A. Lepikson, and S. Gorender, (2013). An Ontology For Monitoring Of Control Oilfields Onshore. 22nd International Congress of Mechanical Engineering (COBEM 2013). ABCM, SP, BRAZIL.
[3] M. H. Shu, C. C. Chiu, T. L. Nguyen, & B. M. Hsu, (2014). A Demerit-fuzzy rating system, monitoring scheme and classification for manufacturing processes. Expert Systems with Applications. Expert Systems with
Applications (2014).
http://dx.doi.org/10.1016/j.eswa.2014.06.035
[4] Bisgrove, J.; Dayao, R.; Houser, B.; Jones, T.; Mayes, J. C.; McGinnis, M.; Schmidt, M.; Skyles, G.; Tan, B. K. (1997). "Integrated test facility (ITF)-automation testing to support Intel's manufacturing output,"
Semiconductor Manufacturing Conference Proceedings, 1997IEEE International Symposium on , vol., no., pp.D17,D21.
[5] De Souza, Luciana Moreira Sá, et al. "Socrades: A web service based shop floor integration infrastructure." The internet of things. Springer Berlin Heidelberg, 2008. 50-67.
[6] A. Savoia (2001), “Web Page Response Time 101:
Understanding and measuring performance test
results,” STQE Magazine, pp. 48–53.
[7] Vora, M. N. (2013). A Nonintrusive Approach to Estimate Web Server Response Time. International Journal of Computer & Electrical Engineering, 5(1). [8] Fei Wang; Wencai Du, "A Test Automation