CONSTRUCT VALIDITY OF TEST INSTRUMENTS FOR
HEALTH BELIEF MODEL (HBM) IN CERVICAL CANCER
SCREENING BEHAVIOR
Ganissufi Kautsar*, Luh Putu Suta Haryanthi
Faculty of Psychology Islamic State University Jakarta
[email protected] (Ganissufi Kautsar)
Abstract
Health Belief Model (HBM) has been one of the most widely used conceptual frameworks in health behavior research since the early 1950s (Glanz, Rimer & Viswanath, 2008). This concept explains about the change and maintenance of health-related behavior and becomes a guiding framework for health behavior interventions such as screening for cervical cancer. The HBM contains several primary dimensions including perceived susceptibility, perceived severity, perceived benefits, perceived barriers, cues to action, and self-efficacy. In fact, it has been used to measure women’s beliefs on cervical cancer screening behavior. However, the validity of HBM in assessing Indonesian women’s beliefs should be re-examined. This study was aimed to examine the construct validity of HBM scale for cervical cancer screening behavior using a non probability sample of 227 married women aged between 21-70 years old in South Tangerang, Indonesia. The method of Confirmatory Factor Analysis (CFA) was applied and the findings indicated that out of 32 items of HBM scale, two items were evidenced to be invalid (dropped), i.e. items number 22 and 28.
Keywords: Health Belief Model, cervical cancer screening behavior, validity.
Presenting Author's Biography
Ganissufi Kautsar is a psychology student at the Islamic State University Jakarta. She has completed a thesis entitled “The Study of Cervical Cancer Screening Behavior in South Tangerang Women”.
INTRODUCTION
Individuals are essential units of health education and health behavior theory, research, and practice. A wide range of health professionals, including health educators, physicians, psychologists, dietitians, and nurses, focus all or most of their efforts on changing the health behavior of individuals [1]. In the 1950s, U.S. public health researchers began to develop psychological models which were designed to enhance the effectiveness of health education programmes [2].
evidence-based health education [2]. Psychologists are interested in the role of health beliefs in people’s practices of health behavior. A comprehensive research and prominent theory on why people do and do not practice particular behaviors is called the Health Belief Model [3]. The Health Belief Model is the most influential attitude theory of why people practice health behaviors [4].
The Health Belief Model (HBM) was originally developed by Godfrey Hochbaum and other psychologists in the U.S. Public Health Service in the early 1950s as they sought to apply the theories and methods of behavioral science to understand and predict people health behaviors [5]. The original work in this area grew out of an attempt to understand the limited utilization of public health programs for disease prevention and screening, including tuberculosis screening [5].
Much research has used quantitative methods to explore and predict health behaviors. For example, Kristiansen (1985) carried out a correlational study looking at the seven health behaviors defined by Belloc and Breslow (1972) and their relationship to a set of beliefs. In fact, most of the research that has aimed to predict health behaviors has emphasized beliefs [6]. During the period 1974-1984, HBM was conducted for 46 studies. Twenty-four studies examined preventive-health behaviors (PHB), 19 explored sick-role behaviors (SRB), and three addressed clinic utilization [7].
One of the studies in preventive-health behaviors using the theoretical framework of HBM is the study of cervical cancer screening behavior. HBM theory has been widely used to measure women's belief against cervical cancer screening behavior. The dimensions of HBM used in several previous studies had different formulation of any researcher. Although the HBM has been widely used in cervical cancer screening behavior research, but the results are different from one another. Therefore, the authors used the theoretical framework of HBM to determine beliefs that drive cervical cancer screening behavior of women in Indonesia.
Champion and Skinner reformulated the dimension of HBM in the case of medically established illness (rather than merely risk reduction) by including the acceptance of the diagnosis, personal estimation of susceptibility to consequences of the illness, and susceptibility to illness in general [1]. The HBM instrument in this study was the dimensions from Champion and Skinner are composed of six dimensions consisting of perceived susceptibility, perceived severity, perceived benefits, perceived barriers, cues to action, and self-efficacy [1]. The total amount of items was 32. These six dimensions were used because it was in accordance with the target behavior and the most salient beliefs in the target population.
One of the most important limitations in both descriptive and intervention research on the HBM is that it has variability in the measurement quality and dimensions. Several important thing of HBM instrument measurement is construct definitions need to be consistent with HBM theory as originally conceptualized; measures need to be specific to the behavior being addressed (barriers to mammography may be quite different from barriers to colonoscopy); and relevant to the population among whom they will be used [1].
The existence of HBM instrument for cervical cancer screening behavior in Indonesia is very important, thus, measurement and test on the validity in measuring what is supposed to be measured, i.e. cervical cancer screening behavior, is required. If the instrument is absolutely valid, then we will obtain accurate information that leads to appropriate attempts of what can be done to improve preventive health behaviors in women, i.e. cervical cancer screening behavior. In Indonesia, there is no instrument for the purpose of cervical cancer screening behaviors whose construct validity is tested with appropriate methods. From the existing of the instruments HBM, the authors investigated all of the six dimensions that measure the cervical cancer screening behavior.
The aims of this study was to measure the construct validity of HBM instrument for cervical cancer screening behavior by the method of CFA (Confirmatory Factor Analysis), therefore this instrument can be used to guide both descriptive and intervention studies on cervical cancer screening behavior among Indonesian women.
HEALTH BELIEF MODEL
HBM (Health Belief Model) predicts why people will take action to prevent, screen, or control illness conditions. It contains several primary dimensions including perceived susceptibility, perceived severity, perceived benefits and perceived barriers to a behavior, cues to action, and most recently, self-efficacy. If the individuals regard themselves as susceptible to a condition, believe that the condition would have potentially serious consequences, believe that an available course of action would be beneficial in reducing either their susceptibility or severity to the condition, and believe on the benefit of anticipation in taking action outweigh the barriers of (or costs) the action, they are likely to carry out what they believe will reduce their risks. Definitions of the HBM dimensions from Champion and Skinner follow [1].
Dimensions
There were six dimensions of HBM being investigated in this study:
Perceived Susceptibility. Perceived susceptibility refers to beliefs about the likelihood of getting a disease or condition.
Perceived Severity. Feelings about the seriousness of contracting an illness or of leaving it untreated include evaluations of both medical and clinical consequences (for example, death, disability, and pain) and possible social consequences (such as effects of the conditions on work, family life, and social relations). The combination of susceptibility and severity has been labeled as perceived threat.
Perceived Barriers. Belief about the tangible and psychological costs of the advised action or the potential negative aspects of a particular health action may act as impediments to undertaking recommended behaviors.
Cues to Action. Strategies to activate “readiness” that can trigger actions, such as media
publicity.
Self-efficacy. Belief in one’s ability to take action.
METHOD
Participant
Population of this study was married women aged between 21-70 years old who live in South Tangerang. The sample consisted of 227 married women who were selected using a non probability method because of the difficulty in applying random sampling in this study. The detection of cervical cancer in this study was made through either the method of Visual Inspection with Acetate Acid (VIA) or pap smears among women aged 20-74 who were married [8].
Data were collected in the primary health care units (Puskesmas) which already had cervical cancer screening services or at the nearest integrated primary health care units in the villages (Posyandu).
The Instruments
HBM instruments used in this study was a modified version of the scale developed by Champion [9], which was specially related to cervical cancer screening behavior based on the components proposed by Champion and Skinner [1]. All the items were using Likert scale with four points ranging from "strongly disagree (1)" up to "strongly agree (4)". The reason of using four point Likert scale was to avoid the tendency of choosing the middle points among the respondents. Most of the statements were “favorable” and only some of them in the form of “unfavorable”. Table 1 shows the blueprint for dimensions of Health Belief Model.
Tab. 1. Blue Print Item Health Belief Model.
No. Dimensions Indicator No. Item Total
2. Perceived severity Belief about how serious a condition and its sequelae are.
29,30,31,32 28 5
3. Perceived benefits Belief in efficacy of the advised action to reduce risk or seriousness of impact.
1,2,3,4,5 5
shame, and fear of pain) of the advised action.
5. Cues to action Provide how-to information, promote awareness through
6. Self-efficacy Belief in one’s ability to take
action by use progressive
As can be seen in Table 1, each of the dimensions consisted of five items except “the perceived barriers” which consisted of seven items.
Data Analysis
The validity of the HBM instrument in this study was investigated using Confirmatory Factor Analysis (CFA). The procedure involved testing of a unidimensional model for each of the HBM dimensions. It was assumed that within each of the dimension, the item measured only one dimension. For example, all of the five items in the first dimension should measure the construct “perceived susceptibility”. In other word, all of the five items were highly correlated to one another because they should measure the same construct (one dimension). Therefore, if those five items fit unidimensional (one factor) CFA model then it could be concluded that all the items were valid in measuring the construct “perceived susceptibility”. Only if the unidimensional model fit the data well, then the authors was in position to test the significance of each item in measuring the construct. In this case, a statistical significance test was carried out for each of the items [10].
The sequence of steps carried out in implementing the CFA can be described as follow [10]:
1. After a concept or trait was defined operationally, questions or statements can be developed. In this case, the trait was called factor while the measurement of the factor was conducted through an analysis of the responses (answers) on items (statement).
2. Each item was theorized only to measures or provide information about a particular factor (which in this case was the dimensions of HBM). This means that all items within each dimension were unidimensional.
3. With the available data (correlation matrix between item), the parameter of CFA model can be estimated. Using parameter estimates, the expected correlation matrix of the items (is called sigma, Σ) was calculated to explain that the model was unidimensional. Measurement of model fit was done by comparing the observed correlation matrix (is called S) with the expected (Σ). In statistical terminology, it tested a null hypothesisμ Ho: S-Σ = 0 meaning that “there is no difference between the observe correlation and the expected correlation given the unidimensional model.”
the matrix S and Σ" was not rejected. This means that unidimensional model can be accepted and can be concluded that all items measure only one factor.
5. If the theory was accepted (model fit), then the next step was to test whether each of the items was significant (or not) in measuring what it supposed to be measured. In this case, the statistical significance was carried out using t-test. If the t-test was insignificant, then the item was not significant in measuring what should be measured and should be dropped, eventually. In this study, the authors used significance level of 5% in order to make decisions regarding with the item.
6. If the coefficient of factor loading of an item was significant but with negative loading factor, then the item should be dropped. However, many items in psychological scale are claimed to be unfavorably. In this case, the core of the item must be reversed before the CFA was taken place.
7. Frequently, the model fit was achieved only after modification of the unidimensional model was made. In this case, typically partial correlation between items (correlated residuals) was taken into account. This was the case, when some of the items were multidimensional. It should be considered carefully the extent to which the multidimensional feature of an item could affect the true score resulted by the model. For example, an item may be dropped if it had more than two correlated errors.
RESULTS
Construct Validity of Perceived Susceptibility
There were five items to be measured in this dimension. The CFA result did not fit the data (Chi-Square = 18.22, df = 5, P-Value = 0.00268, RMSEA = 0.108). After one modification to the model by freeing measurement error correlation among the two items, the model fit was achieved with the Chi-square = 5.90, df = 4, P-Value = 0.20698, RMSEA = 0.046. The path diagram is presented in figure 1. In this case, it was found that two of the items have a correlated measurement error, which means that the model was not perfectly unidimensional. These two items seemed to be multidimensional. However, since the coefficient of factor loadings was statistically significant and there was only one correlation among the measurement errors, the authors considered that in overall, those items were acceptable.
The next step was to determine which items should be dropped by using three criteria:
1) Whether the coefficient of factor loading was negative. 2) If the t-value was insignificant (t < 1.96).
3) Number of correlated error of an item was more than two.
The CFA result for perceived susceptibility dimension is presented in table 2.
Tab. 2. Factor loading of the items in perceived susceptibility.
No. Item Coefficient Standard Error t-value Significant
23 0.74 0.06 12.21 √
24 0.88 0.06 15.67 √
25 0.78 0.06 13.12 √
26 0.43 0.07 6.38 √
27 0.69 0.06 11.28 √
Descriptionμ sign √ = significant (t> 1.λ6), X = insignificant.
Therefore, all of the items were considered to be valid in measuring what is supposed to be measured.
In table 2, the coefficient of factor loading for item 24 was the accurate among all of the items, which was with a value of 0.88. The statement of item 24 was, "My current health condition, susceptible to cervical cancer (Kondisi kesehatan saya saat ini, rentan terkena kanker serviks)". According to the authors, this item became the most accurate item because it was implicitly in line with a claim stated bythe Ministry of Health [8] that the risk factors for cervical cancer was generally associated with sexual activity, especially premarital sex, multiple sexual partners, low socioeconomic, smoking, use of birth control pills, the sexually transmitted disease, and immune disorders. The statement of item 24 showed that the respondents have belief that, due to her life experience, they were in a condition that was prone to develop cervical cancer.
While the item 26 had a coefficient value of 0.43, the lowest value among the items in the dimension of perceived susceptibility. The item 26 stated, "The susceptibility to contracting cervical cancer is influenced by the pattern of my life thus far (Kerentanan terhadap terjangkitnya kanker serviks dipengaruhi oleh pola hidup saya sejauh ini)".
According to the authors, this item became the most inaccurate item because it measured other things than the perceived susceptibility, which in this case was “social desirability factor” (ambiguous answer because the item inquired the respondents’ lifestyle which she might want to hide). As can be seen from the path diagram, item 26 had a correlation error with item 27.
Construct Validity of Perceived Severity
Tab. 3. Factor loading of the items in perceived severity.
No. Item Coefficient Standard Error t-value Significant
28 0.04 0.07 0.62 X
29 1.00 0.07 14.38 √
30 0.48 0.07 7.09 √
31 0.45 0.07 6.77 √
32 0.71 0.07 10.45 √
Descriptionμ sign √ = significant (t> 1.λ6), X = insignificant.
Among the five items that measured the dimensions of perceived severity, there was one item that had t-value <1.96, i.e. items 28, it indicated that the items 28 was dropped, it means the item was not included in the analysis. After that, the authors analyzed the model without item 28, and found that the CFA yield a Chi-Square = 0.00, df = 0, P-Value = 1.00000, RMSEA = 0.000, which fit the data well. The path diagram is presented in figure 2. Although there was item with two correlated errors, the authors still considered them as acceptable. As can be seen in figure 2, only item 31 caused such correlated measurement error. Without this item the model would actually be perfectly unidimensional.
Fig. 2. Model fit dimension of perceived severity.
The CFA result for perceived severity dimension is presented in table 4.
Tab. 4. Factor loading of the items in perceived severity.
No. Item Coefficient Standard Error t-value Significant
29 0.948 0.071 13.299 √
30 0.503 0.068 7.427 √
31 0.479 0.070 6.882 √
32 0.751 0.069 10.808 √
Descriptionμ sign √ = significant (t> 1.λ6), X = insignificant.
seriousness infected or affected by a disease that had two consequences. Medical consequences such as death, disability, or pain, and social consequences such as impact on employment, family life and social relationships [1].
While the item 28 was dropped because it had insignificant t-value (t <1.96). The item 28 stated, "I do not want to do cervical cancer screening, because I do not want to know the results of the investigation (Saya tidak mau melakukan pemeriksaan dini kanker serviks, karena saya tidak ingin mengetahui hasil pemeriksaan tersebut)”. According to the authors, this item was dropped because of its insignificancy and its social desirability factor (invalid answer because the item inquired the respondents’ behaviors dealing with the absence of cervical cancer screening which she might want to hide).
Construct Validity of Perceived Benefits
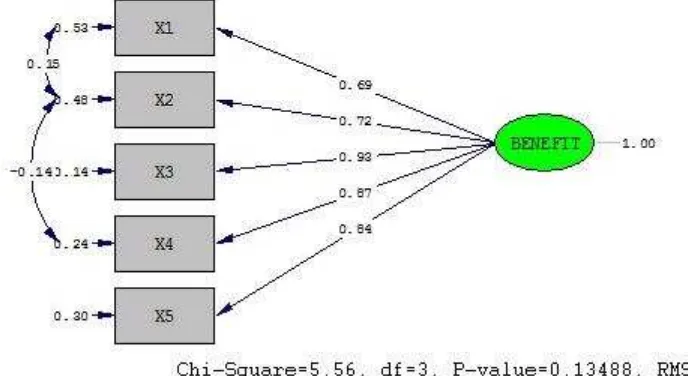
There were five items to be measured in this dimension. The CFA result did not fit the data (Chi-Square = 56.51, df = 5, P-Value = 0.00000, RMSEA = 0.213). After two modification to the model by freeing measurement error correlation among the two items, the model fit was achieved with the Chi-Square = 5.56, df = 3, P-Value = 0.13488, RMSEA = 0.061. The path diagram is presented in figure 3. Although there was item with two correlated errors, the authors still considered them as acceptable. As can be seen in figure 3, only item 2 which caused such correlated measurement error. Without this item, the model would actually be perfectly unidimensional.
Fig. 3. Model fit dimension of perceived benefits.
The CFA result for perceived benefits dimension is presented in table 5.
Tab. 5. Factor loading of the items in perceived benefits.
No. Item Coefficient Standard Error t-value Significant
1 0.69 0.06 11.50 √
2 0.72 0.06 12.02 √
3 0.93 0.05 18.07 √
4 0.87 0.05 16.20 √
5 0.84 0.05 15.37 √
Therefore, all of the items were considered to be valid in measuring what is supposed to be measured.
In table 5, the coefficient of factor loading for item 3 was the best among all of the items, which was with the value of 0.93. The statement of item 3 was "If I was doing cervical cancer screening regularly, then my chances of developing cervical cancer is low (Jika saya melakukan pemeriksaan dini kanker serviks secara teratur, maka peluang saya terkena kanker serviks rendah)". According to the authors, this item was the most accurate item because the respondents realized the benefits of cervical cancer screening behavior if they performed it regularly that could prevent the occurrence of cervical cancer.
While the item 1 had a coefficient value of 0.69 or the lowest value among the items in the dimension of perceived benefits. The item 1 stated: "If cervical cancer is detected early, the treatment success rate is higher (Jika kanker serviks terdeteksi dini, maka tingkat keberhasilan pengobatan lebih tinggi)". According to the authors, this item became the most inaccurate item because it measured other things than the perceived benefits. The item 1 had an ambiguous statement which may be interpreted by the respondents that the statement was addressed to women who had cervical cancer. As can be seen from the path diagram, item 1 had a correlation error with item 2.
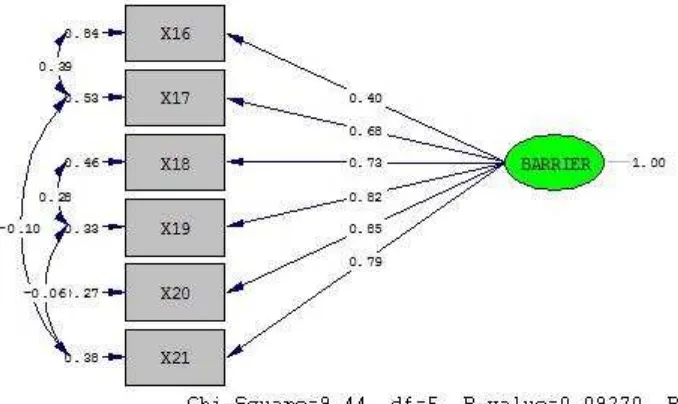
Construct Validity of Perceived Barriers
There were seven items to be measured in this dimension. The CFA result did not fit the data (Chi-Square = 149.96, df = 14, P-Value = 0.00000, RMSEA = 0.207). After four modification to the model by freeing measurement error correlation of the two items, the model fit was achieved with the Chi-Square = 16.05, df = 10, P-Value = 0.09824, RMSEA = 0.052.
Tab. 6. Factor loading of the items in perceived barriers.
No. Item Coefficient Standard Error t-value Significant
16 0.40 0.07 5.80 √
Descriptionμ sign √ = significant (t> 1.λ6), X = insignificant.
Fig. 4. Model fit dimension of perceived barriers.
The CFA result for perceived barriers dimension is presented in table 7.
Tab. 7. Factor loading of the items in perceived barriers.
No. Item Coefficient Standard Error t-value Significant
16 0.40 0.07 5.82 √
17 0.68 0.06 10.88 √
18 0.73 0.06 12.19 √
19 0.82 0.06 14.01 √
20 0.85 0.06 15.01 √
21 0.79 0.06 13.06 √
Descriptionμ sign √ = significant (t> 1.λ6), X = insignificant.
In table 7, the coefficient of factor loading for item 20 was the best among all of the items in the dimension of perceived barriers, which was with a value of 0.85. The statement of item 20 was, "The cost for cervical cancer screening are not affordable (Biaya untuk pemeriksaan dini kanker serviks tidak terjangkau)". According to the authors, it indicated that the respondents had beliefs that one of the barriers of cervical cancer screening behavior was in the fee.
While the item 22 was dropped because it had insignificant t-value (t <1.96). The item 22 stated, "I am not burdened with cervical cancer screening because the help of health funds (BPJS) from the government (Saya tidak terbebani melakukan pemeriksaan dini kanker serviks dengan adanya bantuan dana kesehatan (BPJS) dari pemerintah)". The authors perceived that the statement in item 22 was in contrary to the statement of item 20, so that it can be conclude that the item 22 did not measure what was supposed to be measured, that means the respondents had barriers dealing with the cost problem for cervical cancer screening.
Construct Validity of Cues to Action
fit was achieved with the Chi-Square = 4.93, df = 3, P-Value = 0.17666, RMSEA = 0.053. The path diagram is presented in figure 5. In this case, it was found that four of the items had a correlated measurement error, which means that the model was not perfectly unidimensional. These four items seemed to be multidimensional. However, since the coefficient of factor loadings was statistically significant and there was only one correlation among the measurement errors, the authors considered that these items were acceptable.
Fig. 5 Model fit dimension of cues to action.
The CFA result for cues to action dimension is presented in table 8.
Tab. 8. Factor loading of the items in cues to action.
No. Item Coefficient Standard Error t-value Significant
6 0.67 0.06 10.68 √
7 0.71 0.06 11.39 √
8 0.78 0.06 12.85 √
9 0.88 0.06 14.95 √
10 0.72 0.06 11.31 √
Descriptionμ sign √ = significant (t> 1.λ6), X = insignificant.
Therefore, all of the items were considered to be valid in measuring what were supposed to be measures.
In table 8, the coefficient of factor loading for item 9 was the best among all of the items, which was with a value of 0.88. The statement of item 9 was "Education about cervical cancer reminded me of the importance of cervical cancer screening regularly (P enyuluhan tentang kanker serviks mengingatkan saya akan pentingnya melakukan pemeriksaan dini kanker serviks secara teratur)". According to the authors, this item became the most accurate item based on the theory of Glanz, Rimer and Viswanath (2008) as the external information in the form of education was useful as a trigger, so that the respondents will be aware and eager to adopt healthy behaviors [1].
authors, this item became the most inappropriate item because it measured other things than cues to action, which in this case was “social desirability factor” (invalid answer because the item inquired the respondents’ knowledge which they might not understand). As can be seen from the path diagram, item 6 had a correlation error with item 7. Item 7 was related to the item 6, the statement of item 7 was, “Information about cervical cancer delivered by the health service cadres, encouraged me to do inspection of cervical cancer early (Informasi tentang kanker serviks yang disampaikan oleh ibu kader, mendorong saya untuk melakukan pemeriksaan dini kanker serviks)”. According to the statements of item 6 and 7, it can be seen
that the respondents may rarely obtain information about cervical cancer screening from the doctors, midwives, or health consultants. Respondents usually more often obtained information about cervical cancer screening from the health service cadres (a small group of people specially trained for a particular purpose or profession).
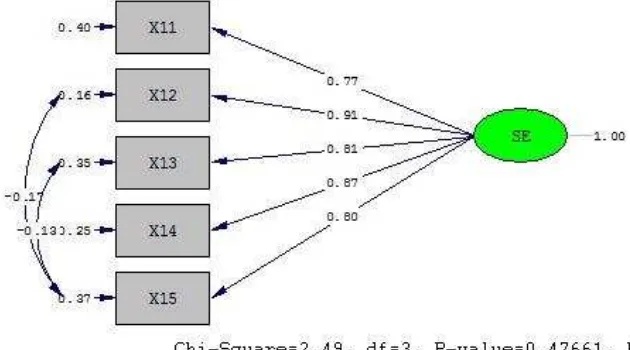
Construct Validity of Self-Efficacy
There were five items to be measured in this dimension. The CFA result did not fit the data (Chi- Square = 28.24, df = 5, P-Value = 0.00003, RMSEA = 0.143). After two modification to the model by sparing the measurement error correlation of the two items, the model fit was achieved with the Chi-Square = 2.49, df = 3, P-Value = 0.47661, RMSEA = 0.000. The path diagram is presented in figure 6. Although there were items with two correlated errors, it can be still considered that it is acceptable. As can be seen in figure 6, only item 15 which caused such correlated measurement error. Without this item, the model would actually be perfectly unidimensional.
Fig. 6. Model fit dimension of self-efficacy.
The CFA result for self-efficacy dimension is presented in table 9.
Tab. 9. Factor loading of the items in self-efficacy.
No. Item Coefficient Standard Error t-value Significant
11 0.77 0.06 13.63 √
12 0.91 0.05 17.38 √
13 0.81 0.06 14.35 √
14 0.87 0.05 16.11 √
15 0.80 0.06 13.33 √
Therefore, all of the items were considered to be valid in measuring what were supposed to be measured.
In table 9, the coefficient of factor loading for item 12 was the best among all of the items, which was with a value of 0.91. The statement of item 12 was "I am able to set goals for preventing the contracting of cervical cancer (Saya mampu meneta pkan tujuan untuk mencegah terjangkitnya kanker serviks)". According to the authors, it can be seen from the statement of the item 12 that the respondents had beliefs to set goals in the prevention of cervical cancer. So that, we can conclude that the respondents were in condition that had good self-efficacy in cervical cancer screening behavior.
While for the item 11 with a coefficient value 0.77 was the lowest value among the items in the dimension of self-efficacy. The item 11 was: "I have a commitment to be able to undergo cervical cancer screening as recommended by the medical (Saya memiliki komitmen untuk mampu menjalani pemeriksaan dini kanker serviks sesuai dengan anjuran pihak medis)". According to the authors, the statement from item 11 illustrated that the commitment of respondents in conducting cervical cancer screening as recommended by the medical was still low. It was allegedly caused by many factors, for example, the absence of time to go to medical center to have cervical cancer screening because of their jobs.
DISCUSSIONS
The results showed that from 32 examined items of Health Belief Model scale, there were two items that were invalid (dropped), i.e. items number 22 and 28. The analysis of those two items resulted t-value <1.96. In overall, it can be concluded that the items in HBM for cervical cancer screening behavior was proven to have good validity. It means that the items in HBM consisting of the perceived susceptibility, perceived severity, perceived benefits, perceived barriers, cues to action, and self-efficacy dimensions are capable in assessing what is supposed to be measured, i.e. women’s belief on cervical cancer screening behavior, except for items 22 and 28. However, as previously discussed, there are some items that are inaccurate since they measure non-targeted dimension. Therefore, it is recommended that minor refinement of the statement in those items are carried out before the utilization of this instrument as a standardized tool.
This study aimed to examine the construct validity of a modified version of HBM instrument from Champion [9], particularly related to cervical cancer screening behavior based on the components proposed by Champion and Skinner [1]. The modifications were made in regard with the language, content, form of the answer choices and the number of items. From the results, it can be said that inoverall, only one construct that are defined in the items of HBM. Based on the item’s factor loadings, there is no items that are negatively loaded. This means that the items are in accordance with the nature of the items that are positive (favorable).
that cross validations can be made. In addition, in-depth analysis on sources of bias in this sort of instrument including the social desirability factor, is significantly required.
ACKNOWLEDGEMENTS
The authors would like to thank Mr. Jahja Umar, Ph.D who has provided input and guidance for the completion of this study.
REFERENCES
[1] Glanz K, Rimer BK, & Viswanath K (2008) Health behavior and health education: Theory, research, and practice. Jossey-Bass A Wiley Imprint 4, 42;47-49;51.
[2] Conner M, & Norman P (2005) Predicting health behaviour: Research and practice with social cognition models. Open University Press 2, 28.
[3] Sarafino EP & Smith TW (2011) Health psychology : Biopsychosocial interactions.
John Wiley & Sons7, 140.
[4] Taylor SE (2006) Health psychology. McGraw-Hill 6, 55.
[5] Anderson NB (2004) Encyclopedia of health and behavior. Sage Publications, 474.
[6] Ogden J (2007) Health psychology. Open University Press 4, 17-18.
[7] Janz NK & Becker MH (1984) The health belief model: A decade later. Health education and behavior 1, 1-47.
[8] Kementerian Kesehatan (2015) Panduan pelayanan kanker. Available at:
http://kanker.kemkes.go.id/guidelines/PanduanPelayananKanker.pdf. accessed in November 2015.
[9] Murray M & McMillan C (1993) Health beliefs, locus of control, emotional control and women's cancer screening behaviour. British journal of clinical psychology 1, 87-100.
[10] Umar J (2013) Basic statistical concepts. A lecture presentation material. An