DEVELOPMENT OF A PROCESS FOR PRODUCING
RED TEA SYRUP USING VACUUM EVAPORATOR EVAP-50
OWNER FOOD MACHINERY
JENNY AN NISA
DEPARTMENT OF FOOD SCIENCE AND TECHNOLOGY
FACULTY OF AGRICULTURAL ENGINEERING AND TECHNOLOGY BOGOR AGRICULTURAL UNIVERSITY
STATEMENT OF MANUSCRIPT AND SOURCE OF
INFORMATION AND TRANSFER OF COPYRIGHTS*
I declare with the truth that this manuscript entitled Development of a Process for Producing Red Tea Syrup Using Vacuum Evaporator EVAP-50 Owner Food Machinery is my own work with guidance of the advisors, and has not been submitted in any form at any college, except Bogor Agricultural University and Mae Fah Luang University. Sources of information derived or quoted are from published and unpublished works of the other authors mentioned in the text and listed in the References at the end of this manuscript.
I hereby bestow the copyrights of my papers to Bogor Agricultural University and Mae Fah Luang University.
Bogor, February 2014
ABSTRACT
JENNY AN NISA. Development of a Process for Producing Red Tea Syrup Using Vacuum Evaporator EVAP-50 Owner Food Machinery. Supervised by NATTHAWUDDHI DONLAO, PIYAPORN CHEUMCHAITRAKUN, YADI HARYADI
Tea is the most popular beverage next to water. Preparation of tea from dried tea leaves require many steps and is time-consuming. The goal of this research is to make a convenient way to prepare tea syrup with vacuum evaporation process. In the present study the effect of vacuum evaporating condition on the properties of tea syrup and the most suitable condition for making tea syrup were investigated with rating hedonic approach. Dried red tea leaves (Camellia sinenesis var. assamica) were supplied from Boon Rawd Farm Co., Ltd in Chiang Rai. The samples were ground using hammer mill. Samples (1720 grams) were extracted with 43 L boiled water, infused for 5 minutes with stirring. Solids were filtered. Sucrose was added to tea extract until TSS of 26 oBrix was reached. These initial concentration was evaporated until 68 oBrix under vacuum with various pressures (-500 mmHg and -400 mmHg) and temperatures (70 oC and 60 oC). Sensory characteristics were evaluated for tea syrup and tea drink. There was difference in value of sensory characteristics of tea syrup and tea drink of different treatment. Based on panelists, the highest score of both tea syrup and tea drink were at treatment of 70 oC/-400 mmHg/28 h 30’. The shortest time of processing was at treatment of 70 oC/-500 mmHg/8 h 35’. Meanwhile, the treatment resulted in the highest total polyphenol was at treatment of 60 oC/-500 mmHg/35 h 8’. Keeping tea syrup in room temperature for around 3 weeks that had once been opened, the growth of molds was observed. Hence, the addition of preservative is suggested.
BACHELOR THESIS (SKRIPSI)
Submitted as a partial fulfillment of the requirements for the degree of
SARJANA TEKNOLOGI PERTANIAN at the Department of Food Science and Technology Faculty of Agricultural Engineering and Technology
Bogor Agricultural University
DEVELOPMENT OF A PROCESS FOR PRODUCING
RED TEA SYRUP USING VACUUM EVAPORATOR EVAP-50
OWNER FOOD MACHINERY
DEPARTMENT OF FOOD SCIENCE AND TECHNOLOGY
FACULTY OF AGRICULTURAL ENGINEERING AND TECHNOLOGY BOGOR AGRICULTURAL UNIVERSITY
BOGOR 2014
Title : Development of a Process for Producing Red Tea Syrup Using Vacuum Evaporator EVAP-50 Owner Food Machinery
Name : Jenny An Nisa NIM : F24090102
Approved by
Dr Ir Yadi Haryadi, MSc Academic Advisor in Bogor Agricultural University
Acknowledged by
Dr Ir Feri Kusnandar, MSc
Head of Department of Food Science and Technology
FOREWORD
Praise The Lord that He gives me His blessings and mercies so this manuscript could be completed. The research entitled “Development of a Process for Producing Red Tea Syrup Using Vacuum Evaporator EVAP-50 Owner Food Machinery” that was carried out in Mae Fah Luang University from June to October 2013.
By the completion of this research and manuscript, the author would like to express great appreciation and sincere thanks to:
1. Dr Ir Yadi Haryadi, M.Sc as academic advisor, for the advise, guidance, time, concern, patience, care, kindness, knowledge during study in Bogor Agricultural University.
2. Aj. Natthawuddhi Donlao as advisor for his patience, kindness, time, knowledge to the author during completion of research in Mae Fah Luang University
3. Dr Piyaporn Cheumchaitrakun as co-advisor for her time, patience, knowledge and all lecturers in School of Agro-Industry who have helped solving the problems during the research in Mae Fah Luang University. 4. Bown Rood Farm who already supported raw material for the research. 5. My lovely mama for her loves and blessings and Kiky, and also my papa
for his supports.
6. DIKTI for full financial support during the research, Ambassador RI and Education and Culture Attaché RI in Thailand for their supports, and the Committee of AIMS Program in IPB (Pak Eko, Bu Dias, Bu Antung, Pak Pungki) for a chance to do research in Mae Fah Luang University.
7. International Affairs Division of Mae Fah Luang University; Mrs. Warunee Kaewbunruang as a coordinator in AIMS Program 2013; all friends in School of Agro Industry; and other friends which cannot be mentioned one by one, for the unforgettable moments during stay in Thailand.
8. AIMS Students 2013, i.e. Ardy, Sarida, Desi, Olga, Afi, Stella and Ardiyansah for togetherness, cooperation, helps, care, supports, sharings in Thailand.
9. All staffs in Labortorium S4, P’Tik, P’ Kwan, P’Sud, P’Pin, P’Nen, staffs in Tea Institute, P’Ab, P’Fon, P’Ni, P’Wa, P’Wow, P’ Pla and also Pak Gatot (IPB) for their helping and support during research.
10. My roomate Santika, Mazmur (Sisca, Faithy, Gloria, Meta, and Uthy), Cicely for their supports, love, care.
11. All friends in Komisi Diaspora and ITP 46 for every moments that we had been through for almost 4 years.
Last but not least, hopefully this manuscript is useful for the readers and gives a real contribution in the food science development particularly in the manufacture of tea syrup.
LIST OF CONTENT
LIST OF TABLES LIST OF FIGURES LIST OF APPENDICES
INTRODUCTION 1
Background 1
Objectives 2
METHOD 2
Raw Materials and Chemical Agents 2
Equipments 2
Sample Preparation 3
Determination of Processing Time 3
Analysis of the Physicochemical Characteristics of Raw Material 5 Analysis of the Physicochemical Characteristics of Tea Extract and
Tea Syrup 5
Sensory Analysis 7
RESULT AND DISCUSSION 7
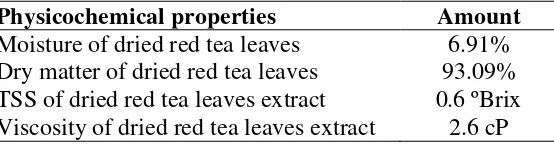
Characteristics of Raw Material 7
Characteristics of Tea Extract 8
Effect of Temperature and Pressure on Processing Time 8 Effect of Processing on the Characteristics of Tea Syrup 9 Effect of Processing on the Characteristics of Tea Syrup and Tea
Drink 11
Sensory Characteristics of Tea Syrup 13
Evaluation of Machine 16
Additional Observation 17
CONCLUSION 17
SUGGESTION 17
REFERENCES 18
APPENDICES 20
LIST OF TABLES
1 Physicochemical properties of raw material 8 2 Particle size measurement of ground-dried red tea leaves 8 3 Physicochemical properties of tea extract 8
4 Processing time of tea syrup 9
5 TSS of tea syrup 9
6 aw of tea syrup 10
7 Viscosity of tea syrup 10
8 Total polyphenol content of tea syrup 11
9 Total reducing sugar of tea syrup 11
10 pH of tea syrup and tea drink 12
11 ΔL*, Δa*, Δb* of tea syrup 12
12 Color (ΔE) of tea syrup and drink 13
13 Gallic acid calibration curve 24
14 Gallic acid concentration (µg/mL) obtained from calibration
curve 25
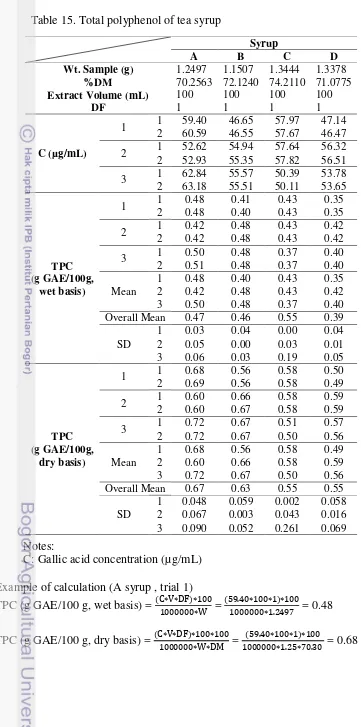
15 Total polyphenol of tea syrup 26
LIST OF FIGURES
1 Diagram of tea syrup preparation 4
2 Result of sensory analysis of tea syrup 14 3 Result of sensory analysis of tea drink 15
4 Gallic callibration curve 24
5 Hydraulic pressure 32
6 Hammer mill 32
7 Sieve Retsch 32
8 Digital viscometer Brookfield 32
9 Vacuum evaporator EVAP-50 OFM 32
LIST OF APPENDICES
1 Moisture content and dry matter of dried red tea leaves 20 2 Particle size measurement of ground-dried red tea leaves 20
3 Color of tea syrup 21
4 Color of tea drink 22
5 Dry matter of tea syrup 23
6 Total polyphenol content of tea syrup 24
7 Total reducing sugar of tea syrup 27
8 Sensory analysis of tea syrup 28
9 Sensory analysis of tea drink 30
INTRODUCTION
Background
Tea is the most popular beverage next to water in the world and consumed by a range of age groups in all levels of society. Making tea drink involves pouring hot water on the dried leaves of the tea plant, Camellia sinensis (Hicks 2001; Grigg 2002). Camellia have two majors varieties, Camellia sinensis var. sinensis and Camellia sinensis var. assamica, originating from the tropical rain forests of China and Assam, respectively. The difference of the two varieties is Assam variety has larger leaf than pure China variety. The pure China variety has very small leaves, only a few centimetres in length even when mature (Clifford 1997).
There are three types of tea products based on fermentation time, i.e. unfermented (green tea), partially fermented (oolong tea), and fully fermented (black tea). Fermentation, in this case, refers not to a microbial process, as with beer or wine, but the natural browning reaction catalyzed by enzymes endogenous in the plant (Harbowy and Balentine 1997).
According to Cheevajit poll conducted on Bangkok residents in 2006 revealed that tea (54.6%) was an indispensable item that is regularly consumed after carbonated drinks (55.7%) (Ekachampaka and Wattanamano 2007). Red tea is popular and one of the main ingredients to make popular Thai tea. Thai tea is a native-grown red-leafed tea, sometimes spiced with star anise seed is adde (depends on company), which is usually brewed strong and then blended with a rich swirl of evaporated milk and a lot of ice (Commins and Sampanvejsobha 2008). Red tea comes from full fermentation of Camellia sinensis var. assamica, but the fermentation time is shorter than black tea.
Consumption of red tea is the same way as other teas that need to be brewed in hot/boiled water and then filter the leaves. These steps take time, a simple way should be provided by making tea syrup. Tea syrup a simple product to help people consume tea drink in a convenient way and also one of new product development of tea. Syrup is a drink product made from mixing sugar and water with minimal 65% of sugar solution, with or without other ingredient food, with or without food additives which is allowed by law (BSN 2013). Syrup contains high concentration of sugar which helps to extend the shelf life. When consumed, it needs to be added with water (Wijaya 2002).
2
Objectives
The objectives of this study are to evaluate the effect of vacuum evaporating condition on the physicochemical and sensory analysis of tea syrup and tea drink and to investigate the most suitable condition of evaporation process for making tea syrup which has total soluble solids (TSS) of 68 oBrix.
METHOD
Raw Materials and Chemical Agents
Dried red tea leaves (Camellia sinensis var. assamica) were supplied by Boon Rawd Farm Co., Ltd in Chiang Rai. Refined sugar was obtained from local market. Copper (II) sulfate pentahydrate (CuSO4·5H2O), gallic acid, zinc sulfate
heptahydrate (ZnSO4·7H2O), potassium sodium tartarate tetrahydrate
(KNaC4H4O6·4H2O), sodium carbonate anhydrous (Na2CO3), sodium
hydroxide (NaOH), K4Fe(CN)6·3H2O, methylene blue, Folin-Ciocalteu, aquades,
Whatman filter paper No. 5 and Advantec filter paper 5A (Whatman filter paper No. 41) were obtained from Chemical Laboratory of Mae Fah Luang University.
Equipments
This research used vacuum evaporator EVAP-50, which have never been used before in main research in Processing Laboratory of Mae Fah Luang University. The type of evaporator is batch pan evaporator that has long product residence time. The batch pan is jacketed with oil as heat transfer medium. Heater heats oil in the jacket layer. Exposure of the food liquid to high temperatures for long time is likely to cause changes in the color and flavor of the liquid. In some cases such changes may be acceptable. However, in the case of heat-sensitive liquids, such changes are undesirable. To reduce such heat damage, the pressure above the liquid in the evaporator may be reduced below atmospheric pressure by means of vacuum pump as suggested by Brennan (2006).
The other equipment used were sieve Retsch Type AS200, digital pHmeter (pH cyberscan 510), Color Quest XE/Hunter Lab, digital viscometer Brookfield model DV-III, hand refractometers (1–32 oBrix ATAGO Model N-2E and 58–90 oBrix ATAGO Model N-3E, Japan), hydraulic pressure (Owner Food Machinery Co., Ltd Thailand), aw meter of Novasina, measurable plastic
Sample Preparation
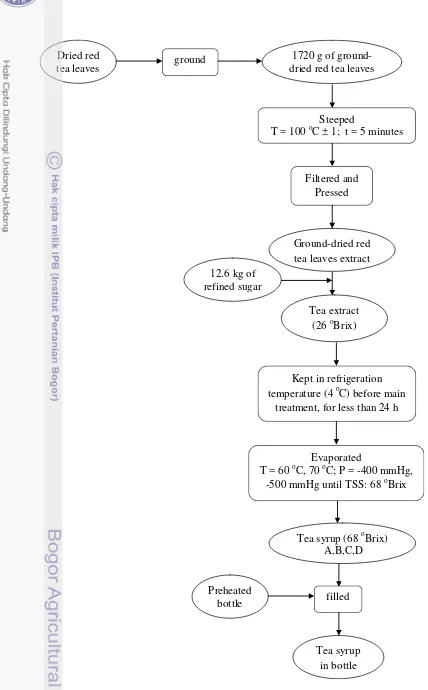
Dried red tea leaves (Camellia sinensis var. assamica) were ground with hammer mills (to increase surface area) and kept at room temperature before use. Ground red tea leaves (1720 g) were extracted by 43 L of boiled water for 5 minutes while stirring. Ground-dried red tea leaves extract were filtered through 4 layers of filter cloth. The residues were pressed using hydraulic pressure machine to get more filtrate. Refined sugar was added until the concentration of solution reached TSS of 26 oBrix. The tea extract was kept in refrigerator at temperature of 4 oC for less than 24 hours before further processing.
Determination of Processing Time
4
Figure 1 Diagram of tea syrup preparation Preheated
bottle
Kept in refrigeration temperature (4 oC) before main
treatment, for less than 24 h
Tea syrup (68 oBrix) A,B,C,D
filled
Tea syrup in bottle Tea extract
(26 oBrix)
Evaporated
T = 60 oC, 70 oC; P = -400 mmHg, -500 mmHg until TSS: 68 oBrix
1720 g of ground- dried red tea leaves Dried red
tea leaves ground
12.6 kg of refined sugar
Steeped
T = 100 oC ± 1; t = 5 minutes
Filtered and Pressed
Analysis of the Physicochemical Characteristics of Raw Material
Moisture content and dry matter of dried red tea leaves (ISO 1980)
Around 5 g of dried red tea leaves, weighed to the nearest 0.001 g, were placed in a moisture can and heated in an oven at 103 ± 2 oC for at least 16 h until constant weight was reached.
Particle size distribution of ground-dried red tea leaves (Sonaye and Baxi 2012)
A representative weighed sample (1720 g of ground-dried red tea leaves) was poured into the largest screen openings of 4 mm at the top of sieve. Each lower sieve in the column had smaller openings than the one above. A round pan/the receiver was at the base. Every sieve in the column was placed in a mechanical shaker. The shaker was operated the column for 20 minutes. After the shaking was completed, the material on each sieve was weighed. The weight of the sample of each sieve was divided by the total weight to give a percentage retained on each sieve. To find the percent of aggregate passing through each sieve, found the percent retained in each sieve first. To do so, the following equation was used:
% Retained = ������
������ × 100%
% Cumulative passing = 100% – % cumulative retained
Total soluble solids of dried red tea leaves extract (Borse et al. 2002)
Total soluble solids (TSS) of dried red tea leaves extract were determined using a refractometer after sample preparation. Dried red tea leaves (2 g) was added to 140 mL boiling distilled water in a clean beaker and allowed to boil (infuse) for 4 minutes. The dried red tea leaves extract was filtered through Whatman No. 5 filter paper, using a Buchner funnel, by applying a vacuum pump. A drop of well-mixed of cooled dried red tea leaves extract was placed on the prism of the refractometer. Readings were taken in triplicate and an average taken as TSS (%).
Viscosity of dried red tea leaves extract
Sixteen mL of dried red tea leaves extract was placed in the digital viscometer Brookfield model DV-III. A suitable spindle, keeping the RPM constant, was selected by trial and error. Readings were taken in triplicate and an average taken as the final viscosity of the dried red tea leaves extract.
Analysis of the Physicochemical Characteristics of Tea Extract and Tea Syrup
TSS
6
Viscosity
Tea extract and tea syrup were conditioned in room temperature (25 ± 1 oC). Sixteen mL of tea extract was fed into viscometer with spindle ULA. Six hundred mL of tea syrup was placed in a beaker glass (have 3 inches of inside diameter) and rested for at least 12 hours (overnight) to release the small bubbles to surface, so that small bubbles could be removed by spoon. Incorporation of air to tea syrup was occurred during replacing tea syrup from evaporator. Bubbles could affect measurement of viscosity. Tea syrup was measured its viscosity using viscometer with the presence of guard leg and using spindle LV2.
Color measurement
Color of tea syrup and tea syrup after dilution (tea drink) were measured by using of Color Quest XE/Hunter Lab (USA) expressed as CIE L*, a*, and b* values. The results were calculated using ΔE formula. ΔE = (∆L*2 + ∆a*2 +
∆b*2)1/2. ∆L* = L*tea syrup/drink – L*tea extract
Total polyphenol (ISO 2005)
The total polyphenol content of tea syrup (TPC) was determined by spectrophotometer, using gallic acid as standard, according to the method described by the International Organization for Standardization (ISO) 14502-1 (ISO 2005). Briefly, 1.0 mL of the diluted sample extract (50–100 fold dilution) was transferred in duplicate to separate tubes containing 5.0 mL of a 1/10 dilution of Folin-Ciocalteu’s reagent in water. Then, 4.0 mL of sodium carbonate solution (7.5% w/v) was added. The tubes were then allowed to stand at room temperature for 60 minutes before absorbance at 765 nm was measured against water. The TPC was expressed as gallic acid equivalents (GAE) in g/100 g material. The concentration of polyphenols in samples was derived from a standard curve of gallic acid ranging from 10 to 100 µg/mL,
Total phenolic content, TPC (g GAE /100 g db) = � . � . �� .100 10000 . � . % ��
C = gallic acid concentration (µg/mL) obtained from calibration curve V = volume of tea syrup solution (mL)
DF = dilution factor
% DM = dry matter of tea syrup W = weight of tea syrup (g) Water activity
Water activity of tea syrup were measured by using aw meter Novasina.
Total reducing sugar (AOAC 2000)
Accurately weighed samples (about 11–15 g of tea syrup) was transferred to a 250 mL volumetric flask and distilled water was added to about 2/3 volume. Five mL of Carez I solution and 5 mL of Carez II solution were added. The flask was shaken vigorously after each addition and then diluted to the volume (V1 = 250 mL). The solution was filtered through Whatman No. 41
burette. Ten mL of mixed Fehling’s solution was transferred into a 250 mL erlenmeyer flask. Around 3–5 glass beads and 10 mL solution A were added to erlenmeyer and boiled by hot plate for exactly 2 minutes. Three or four drops of methylene blue indicator were added. Hot titration was completed by sample solution A from burette within 3 minutes. Experiment was carried out in duplication. Average volume of sample solution was determined.
Reducing sugar (% w/w) = � ×�1 ×100 �� ×1000 × �
F = invert sugar factor for 10 mL of Fehling’s solution
V1 = Total volume of sample solution A (mL) (in this experiment = 250)
100 = conversion factor from 1 g to 100 g
Va = accurate volume of sample solution A used for titration (mL)
1000 = conversion factor from mg to g W = weight of tea syrup(g)
Dry matter of tea syrup (AOAC 2002)
Around 2–5 g of tea syrup was dried in flat dish (Alumunium) for 12 h at ≤ 70 °C, under pressure 50 mmHg (6.7 kPa). Dish was removed from the oven, cooled in desiccators, and weighed. (Redry 1 h and repeat process until change in weight between successive dryings at 1 h intervals is 2 mg ).
Sensory Analysis
Sensory analysis was carried out on all samples using rating hedonic 9-scale for tea syrup and tea drink in D1 canteen, Mae Fah Luang University. Around 10 mL of tea syrup from 4 treatments were placed in plastic containers and determined for appearance, odor, and overall acceptance by 35 untrained panelists. The panelists were students or staffs of MFU. Each syrup was diluted until 12 oBrix of TSS was obtained. The ratio for water and syrup could be obtained by calculating using Pearson square. For tea drink, around 20 mL was determined for appearance, tea aroma, tea flavor, sweetness, and overall acceptance by 35 panelists untrained. Data from 29 panelists of 35 panelists were analyzed. Six of them were dropped due to unacceptable data. Around 25– 50 panelists were needed in hedonic scale ratings (for the nine-point hedonic scale) for laboratory scale (Stone and Sidel 2004).
RESULT AND DISCUSSION
Characteristics of Raw Material
8
Characteristics of Tea Extract
The tea extract obtained before evaporation process has the characteristics as shown in Table 3. It had pH of 4.90, viscosity of 3.34 cP, TSS of 26 ºBrix, L* of 26.24, a* of -0.013, and b* 5.38. In the process of evaporation, it was expected that the TSS will increase to 68 ºBrix.
Effect of Temperature and Pressure on Processing Time
The objective of this research is to obtain tea syrup which have total soluble solids of 68 oBrix using vacuum evaporator EVAP-50 at temperature of 60 oC and 70 oC and pressure of -400 mmHg and -500 mmHg. Table 4 shows processing time to obtain tea syrup of 68 oBrix. The shortest time to obtain tea syrup of 68 oBrix was 8 h 35’, at the treatment of 70 oC/-500 mmHg.
Table 3. Physicochemical properties of tea extract Physicochemical properties Amount
pH 4.90
Viscosity 3.34 cP
TSS 26 oBrix
Color (L*, a*, b*) 26.24, -0.013, 5.38
Table 2. Particle size measurement of ground-dried red tea leaves Sieve size % Cumulative Passing
4 mm 99.91
1 mm 95.95
600 µm 79.56
500 µm 74.33
250 µm 32.23
125 µm 8.41
63 µm 4.24
Processing time of each treatment was different. The longest processing time was 35 h 8’, 34 h, 28 h 30’, and 8 h 35’ for A syrup at treatment of 60 o C/-500 mmHg, B syrup at treatment of 60 oC/-400 mmHg, at treatment of D syrup 70 oC/-400 mmHg, and C syrup at treatment of 70 oC/-500 mmHg, respectively. It took 30 minutes to concentrate palm sugar syrup until 40 oBrix was obtained using vacuum evaporator at temperature of 80 oC, while 20 minutes at temperature of 70 oC (Naknean et al. 2009). It was clear that by increasing temperature, the processing time reduced. Similiarly, by increasing the vacuum condition from -400 mmHg to -500 mmHg the processing time tend to reduce. The tea syrups obtained by those processing conditions were then analyzed for their physicochemical characteristics.
Effect of Processing on the Characteristics of Tea Syrup
Total Soluble Solids (TSS)
The TSS of tea syrup is presented in Table 5. The highest TSS was A syrup at treatment of 60 oC/-500 mmHg/35 h 8’, 68.8 oBrix, while the lowest TSS was D syrup at treatment of 70 oC/-400 mmHg/28 h 30’, 64 oBrix.
In Thailand, standard TSS for palm sugar syrup shall not be less than 65 oBrix. In Canada have similiar rule for finished maple syrup. Finished maple syrup shall not less than 66 oBrix in order to prevent growth of micro-organisms during storage under room temperature (Naknean et al. 2013). TSS in this research were suppossed to be 68 oBrix, D syrup had TSS of 64 oBrix due to systematic error when reading at that treatment.
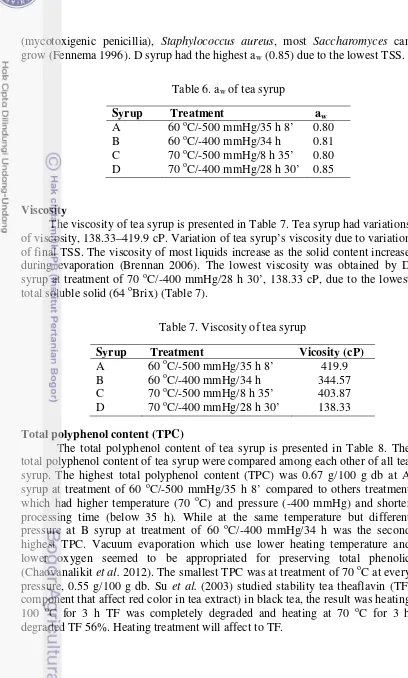
Water Activity (aw)
The aw of tea syrup is presented in Table 6. Concentration process are
conducted primarily for the purpose of decreasing the water content of a food, simultaneously increasing the concentration of solutes and thereby decreasing perishability (Fennema 1996), in this case water activity of syrup. In this research, temperature, pressure, and time did not affect to aw. Most of aw in the
range of 0.80–0.85 for all tea syrup. In this range of aw (0.80–0.87), most molds
Table 5. TSS of tea syrup
Syrup Treatment TSS
A 60 oC/-500 mmHg/35 h 8’ 68.8 oBrix B 60 oC/-400 mmHg/34 h 68 oBrix C 70 oC/-500 mmHg/8 h 35’ 68 oBrix D 70 oC/-400 mmHg/28 h 30’ 64 oBrix
Table 4 Processing time of tea syrup
Syrup Treatment Time (h)
10
(mycotoxigenic penicillia), Staphylococcus aureus, most Saccharomyces can grow (Fennema 1996). D syrup had the highest aw (0.85) due to the lowest TSS.
Viscosity
The viscosity of tea syrup is presented in Table 7. Tea syrup had variations of viscosity, 138.33–419.9 cP. Variation of tea syrup’s viscosity due to variation of final TSS. The viscosity of most liquids increase as the solid content increase during evaporation (Brennan 2006). The lowest viscosity was obtained by D syrup at treatment of 70 oC/-400 mmHg/28 h 30’, 138.33 cP, due to the lowest total soluble solid (64 oBrix) (Table 7).
Total polyphenol content (TPC)
The total polyphenol content of tea syrup is presented in Table 8. The total polyphenol content of tea syrup were compared among each other of all tea syrup. The highest total polyphenol content (TPC) was 0.67 g/100 g db at A syrup at treatment of 60 oC/-500 mmHg/35 h 8’ compared to others treatment which had higher temperature (70 oC) and pressure (-400 mmHg) and shorter processing time (below 35 h). While at the same temperature but different pressure at B syrup at treatment of 60 oC/-400 mmHg/34 h was the second highest TPC. Vacuum evaporation which use lower heating temperature and lower oxygen seemed to be appropriated for preserving total phenolic (Chaovanalikit et al. 2012). The smallest TPC was at treatment of 70 oC at every pressure, 0.55 g/100 g db. Su et al. (2003) studied stability tea theaflavin (TF, component that affect red color in tea extract) in black tea, the result was heating 100 oC for 3 h TF was completely degraded and heating at 70 oC for 3 h degraded TF 56%. Heating treatment will affect to TF.
Table 7. Viscosity of tea syrup
Syrup Treatment Vicosity (cP)
A 60 oC/-500 mmHg/35 h 8’ 419.9 B 60 oC/-400 mmHg/34 h 344.57 C 70 oC/-500 mmHg/8 h 35’ 403.87 D 70 oC/-400 mmHg/28 h 30’ 138.33
Table 6. aw of tea syrup
Syrup Treatment aw
Tea syrup have 6 times dilution based on weight or 8 times based on volume. It means 100 g tea drink from dilution of tea syrup have 0.112 g GAE from tea syrup that had the highest total polyphenol in this research. In other side, the total polyphenol in black tea according to Astill et al. 2001 was 14.4% or 14.4 g in 100 g tea extract. The difference is high, probably because application of heat for long time.
Sucrose and other Maillard compounds in syrup will interfere the test which use Folin-Ciocalteu by enhancing the development of the blue color so the data certainly overestimate (Payet et al. 2006).
Total reducing sugar (TRS)
Total reducing sugar was detected in the tea syrup. Sucrose was used as sweetener and to increase TSS. During process, sucrose was inverted to invert sugar. Panpae et al. (2008), sucrose inversion in various sugar cane juice samples strongly depended on temperature and pH. Increase in temperature during heating and decrease in pH value tend to increase in rate of sucrose inversion. The highest content of reducing sugar was obtained by D syrup at treatment of 70 oC/-400 mmHg/28 h 30’, 0.08% w/w (Table 9). It was shown at D syrup that had the highest content of TRS had the second lowest pH value. In contrast, at A syrup the lowest TRS had the highest pH value. Invert sugar is not only undesirable due to its hygroscopy so can reduce shelf life but also desirable to prevent crystallization. Caramelization could not happen since this reaction effectively undergo at temperature of 120 oC or above (Naknean et al. 2013).
Effect of Processing on the Characteristics of Tea Syrup and Tea Drink
pH
The pH of tea syrup and drink are presented in Table 10. If pH of tea extract was 4.90 (Table 3) is compared to that of tea syrups, it was clear that there was tendency of decrease for all treatment (Table 10). Decrease also
Table 9 Total reducing sugar of tea syrup
Syrup Treatment TRS
A 60 oC/-500 mmHg/35 h 8’ 0.04 B 60 oC/-400 mmHg/34 h 0.05 C 70 oC/-500 mmHg/8 h 35’ 0.05 D 70 oC/-400 mmHg/28 h 30’ 0.08
Table 8 Total polyphenol content of tea syrup
Syrup Treatment TPC (g GAE /100
12
happened at tea drink. Heat and pressure might decrease acidity of tea syrup. Furthermore, acidity of tea drink are below than that of tea syrup and tea extract.
The biggest decrease (Δ/delta) of tea syrup from tea extract was 0.14, 0.13, 0.10, and 0.03 for B syrup at treatment of 60 oC/-400 mmHg/34 h, D syrup at treatment of 70 oC/-400 mmHg/28 h 30’, C syrup at treatment of 70 oC/-500 mmHg/8 h 35’, and A syrup at treatment of 60 oC/-500 mmHg/35 h 8’, respectively. From these data, decrease of A syrup is not as much as B, C, and D syrup. The biggest decrease (Δ/delta) of tea drink from tea syrup was 0.12, 0.11, 0.08, and 0.06 for C, B, A, and D, respectively. It was clear that decrease in tea syrup from tea extract was bigger than tea drink from tea syrup. Hence, the biggest decrease between tea extract and tea drink was 0.25, 0.22, 0.19, 0.11 for B, C, D, and A, respectively.
Tea drink had range 4.65–4.71 (Table 10). Street et al. 2006 examined 30 samples of tea samples (green tea, black tea, semi-fermented, and white tea) from different origins. Those pH of the tea infusions, which measured by potentiometer, were in range of 4.04–5.08 (average 4.42).
In term of temperature at 60 oC, pH syrup showed slightly decrease compared to 70 oC. As well as at pressure of -500 mmHg pH syrup showed slightly decrease compared to -400 mmHg. The pattern was same with pH of tea drink.
Color
Table 11 showed ΔL*, Δa*, Δb* for tea syrup. The color differences of tea syrup and drink are presented in Table 12.
Table 11. ΔL*, Δa*, Δb* of tea syrup
Syrup Treatment ΔL* Δa* Δb*
A 60 oC/-500 mmHg/35 h 8’ -0.45 -1.52 -0.82 B 60 oC/-400 mmHg/34 h -1.46 -2.36 0.42 C 70 oC/-500 mmHg/8 h 35’ -4.96 -1.29 -1.53 D 70 oC/-400 mmHg/28 h 30’ -1.87 -2.18 0.89 Notes :
ΔL* : L*tea syrup – L*tea extract ; -ΔL* : darker ; ΔL* : lighter
Δa* : a*tea syrup – a*tea extract ; -Δa* : more blue ; Δa* : more red
Δb* : b*tea syrup – b*tea extract ; -Δb* : more green ; Δb* : more yellow
Table 10. pH of tea syrup andteadrink
Syrup Treatment pH - syrup pH - drink
A 60 oC/-500 mmHg/35 h 8’ 4.87 4.79
B 60 oC/-400 mmHg/34 h 4.76 4.65
C 70 oC/-500 mmHg/8 h 35’ 4.80 4.68
Color was measured using CIE L*, a*, b* scale. Among L*, a*, b* value, L* value had the greatest variances and this value represents light-dark spectrum. All treatments showed decrease in ΔL* value of tea syrup. Color darkens because of high solid content and chemical changes, especially the Maillard reaction (Nindo et al. 2007). The highest value of ΔL* was C syrup which had the highest temperature and the lowest pressure and processing time.
Naknean et al. (2013) studied properties changes of palm sugar syrup produced by an open pan dan vacuum evaporator. They found palm sugar syrup produced by open pan was the highest decrease in L* value. Decrease in L* value of palm sugar syrup produced by vacuum evaporator at temperature of 80 oC was higher than 70 oC. It was clear that vacuum evaporator with lower temperature helped to reduce effect of thermal degradation. Value of a* and b* also decrease in all treatments, just a slight increase at b* value of syrup D. These decrease indicated that color had less red and yellow component.
Total color differences (ΔE) indicated the magnitude of overall color difference between tea extract and tea syrup, also between tea extract and tea drink. The ΔE value of tea syrup was bigger than tea drink. Dissolving tea syrup with addition of water (tea drink) tend to decrease the ΔE value. In other words, color after dissolving tea syrup almost return to the tea extract. Data showed C syrup (70 oC/-500 mmHg/8 h 35’) which had the biggest ΔE at tea syrup, had the smallest of ΔE after diluting.
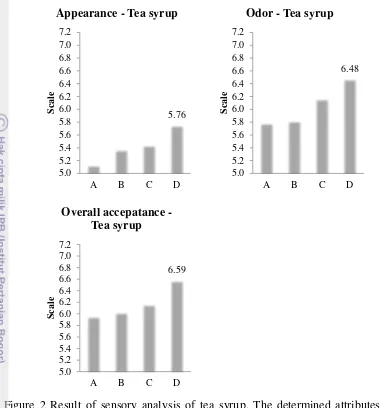
Sensory Characteristics of Tea Syrup
Appearance, odor and overall judgment by panelists of tea syrup are presented in Figure 2, whereas appearance, tea aroma, tea flavor, sweetness, and overall of tea drink are presented in Figure 3.
Table 12. Color (ΔE) of tea syrup and drink
Syrup Treatment ΔE - syrup ΔE - drink
A 60 oC/-500 mmHg/35 h 8’ 1.95 2.87
B 60 oC/-400 mmHg/34 h 3.05 3.05
C 70 oC/-500 mmHg/8 h 35’ 5.39 2.75
14
Figure 2 Result of sensory analysis of tea syrup. The determined attributes were appearance, odor, and overall acceptance (from left to the right). A (60 oC/-500 mmHg/35 h 8’), B (60 oC/-400 mmHg/34 h),
Appearance - Tea syrup
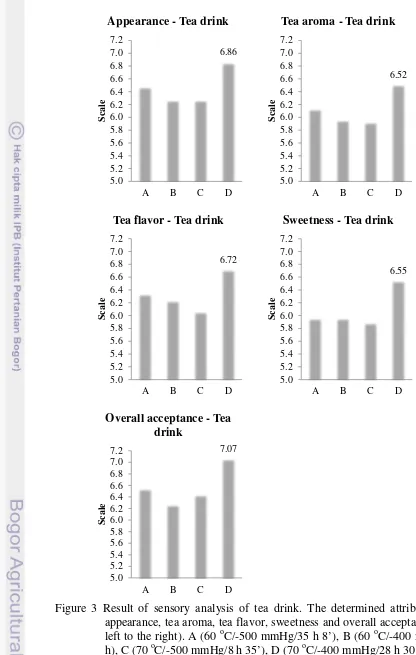
Figure 3 Result of sensory analysis of tea drink. The determined attributes were appearance, tea aroma, tea flavor, sweetness and overall acceptance (from left to the right). A (60 oC/-500 mmHg/35 h 8’), B (60 oC/-400 mmHg/34
Appearance - Tea drink
6.52
Sweetness - Tea drink
7.07
16
The highest average score of tea syrup and drink was D syrup at treatment of 70 oC/-400 mmHg/28 h 30’ for each attribute (for tea syrup: appearance, odor, and overall acceptance; for tea drink: appearance, tea aroma, tea flavor, sweetness, and overall acceptance).
There were some comments from panelist during sensory analyzing. For tea syrup: “improve appearance for consumption, attract to drink”. “The syrup can be more diluted and if container is small will be easier and more convenience”. “Physicochemical among samples are same, difficult to give the score”. For tea drink: “some cups are delicious, some cups are too sweet”. “I like tea that have combination of bitter and sweet, I like tea that have less sweet”. “All of samples are sweet”. “Reduce sweet and increase the aroma”. “I like sample with code of 756 (C syrup, 70 oC/-500 mmHg/8 h 35’), but never smell aroma”.
All comments can be concluded that all tea syrups were almost same and the appearance should be improve. Tea drink were too sweet for panelists (Thailand) and the aroma could not be detected. In fruit juices, concentration using evaporator would lose the aroma due to volatile compound that were readily destroyed by heat even vacuum (MacDowell et al. 1948). This case was same with this research. MacDowell et al. (1948) offered addition a portion of fresh, single strength to strong concentrate (syrup), hence a concentrate of medium strength that have subtantially portion of the original aroma, flavor, and palatability were obtained.
Volatile compound which contribute to aroma was lost on the first hour of processing due to valve of pressure was opened to meet setting point. In other word, the system was open so there was mass transfer between system and environment. In this case, volatile compound was transferred from system to environment that cause loss of aroma. Vacuum evaporation will lose volatile compound resulting in a concentrate with poor organoleptic qualities. Other technologies can be used as alternative way to get a simple way of drinking tea such as spray drying and freeze drying which result in powder form.
Evaluation of Machine
In addition to the loss of tea flavor, second disadvantage of the machine is the lack of part for indicating the TSS of syrup inside the evaporator for TSS determination without opening it. The third disadvantage is the lack of automatic mechanisms to stop the vacuum pump once the vacuum condition was set as experimental factor.
Additional Observation
Two levels of temperature and two levels of pressure were introduced in combination to obtain tea syrup having total soluble solids (TSS) of 68 oBrix. The aim of producing tea syrup with TSS of 68 oBrix is to have a shelf stable tea syrup at room temperature. It was found that with different combinations, the processing time to obtain tea syrup with TSS of 68 oBrix also varies. The shortest time to obtain tea syrup of 68 oBrix was at the combination of 70 o C/-500 mmHg (8 h 35’), whereas the longest was at the combination of 60 oC/-500 mmHg (35 h 8’). By increasing the temperature from 60 oC to 70 oC, the processing time was reduced. Similiarly, by increasing the degree of vacuum condition the processing time was also reduced. From this preliminary experiment, it was found that the the combination of 70 oC/-500 mmHg treatment was the best processing option because of the shortest processing time. However, based on the preference of panelists, it was found that D syrup (obtained by treatment of 70 oC/-400 mmHg/28 h 30’) was the most preferred (in term of of odor, appearance, overall acceptance). Similiar judgment was also obtained for tea drink (in term of appearance, tea aroma, tea flavor, sweetness, and overall acceptance).
In the surface of tea syrup that had been kept in room temperature for around 2–3 weeks and that had once been opened, suspected-mold was observed. Hence, the addition of additive to increase shelf life was needed.
At A syrup which had the highest TSS (68.8 oBrix), a little crystal sugar were observed in the bottom of bottle after keeping in refrigeration temperature for 1 month. While others syrup, which were also kept in refrigeration temperature, crystal sugars were not detected for 2 weeks.
CONCLUSION
The best tea syrup and drink obtained was D syrup at treatment of 70 oC/-400 mmHg/28 h 30’ which had the highest score based on sensory analysis. The highest total polyphenol content was A syrup at treatment of 60 oC/-500 mmHg/35 h 8’. Preservative was needed to make shelf life longer if stored at room temperature. Final TSS is supposed to lower than 68.8 oBrix to prevent crystallization. Evaporator type batch pan was not suitable for evaporating tea due to lost of aroma.
SUGGESTION
18
done. Preservative is needed to increase shelf life such as potassium sorbate. Mixing with invert sugar such as glucose and fructose can prevent crystallization. Research about how to prevent loss tea aroma is needed. Another technology to make tea syrup is needed to make comparation which technology will give the best procedure to make tea syrup.
REFERENCES
[AOAC] Association of Official Analytical Chemists. 2000. Official methods of analysis of AOAC International. 17th edition. Gaithersburg (US): Association of Analytical Communities.
[AOAC] Association of Official Analytical Chemists. 2002. Official methods of analysis of AOAC International. 17th edition. 1st revision. Gaithersburg (US): Association of Analytical Communities.
Astill C, Birch MR, Dacombe C, Humphrey PG, Martin PT. 2001. Factors affecting the caffeine and polyphenol contents of black and green tea infusions. J. Agric Food Chem. 49:5340-5347.
Borse BB, Rao LJM, Nagalakshmi S, Krishnamurthy N. 2002. Fingerprint of black teas from India: identification of the regio-specific characteristics. Food Chemistry 79:419-424.
Brennan JG. 2006. Evaporation. Brennan JG, editor. In Food Processing Handbook. Weinheim (DE): WILEY-VCH Verlag GmbH & Co. KGaA. [BSN] Badan Standarisasi Nasional. 2013. Sirup. SNI 3544:2013.
Chaovanalikit A, Mingmuang A, Kitbunluewit T, Choldumrongkool N, Sondee J, Chupratum S. 2012. Anthocyanin and total phenolics content of mangosteen and effect of processing on the quality of mangosteen products. International Food Research J. 19(3):1047-1053.
Clifford MN. 1997. Hot Beverage. Ranken MD, Kill RC, Baker CGJ, editor. In Food Industries Manual 24th edition. Blackie Academic & Professional Commins T, Sampanvejsobha S. 2008. Development of the tea industry in
Thailand. As. J. Food Ag-Ind. 1(1):1-16.
Diaz N, Clotet R. 1995. Kinetics of the caramelization of simpel sugar solution. Alimentaria (259):35-38
Earle RL, Earle MD. 1983. Unit Operation in Food Processing. British (GB): Pergamon Press.
Ekachampaka P, Wattanamano N. 2007. Situation and Trends of Health Determinants. Wibulpolprasert S, editor. In: Thailand Health Profile 2005-2007. Thailand: Printing Press.
Fennema OR. 1996. Water and Ice. Fennema OR, editor. In Food Chemistry third edition.New York (US): Marcel Dekker, Inc.
Grigg D. 2002. The worlds of tea and coffee: Patterns of consumption. GeoJ. 57:283-294.
Harbowy ME, Balentine DA. 1997. Tea Chemistry. Critical Reviews in Plant Sciences 16(5):414-480.
[ISO] International Standard Organisation. 1980. ISO 1573. Determination of loss in mass at 103oC. Switzerland: International Standard Organisation. [ISO] International Standard Organisation. 2005. ISO 14502-1. Determination of
substances characteristic of green and black tea-Part 1: Content of total polyphenols in tea-Calorimetric method using Folin-Ciocalteu reagent. Switzerland: International Standard Organisation.
MacDowell LG, Lakeland, Moore EL, Atkins CD, Haven W, Fla, inventor; United States Patent Office 1948. Method of preparing full-flavored fruit juices concentrates. November 9, 1948. Patent USA ID 2453109.
Naknean P, Meenune M, Roudat G. 2009. Changes in physical and chemical properties during the production of palm sugar syrup by open pan and vacuum evaporator. As. J. Food Ag-Ind. 2(04):448-456.
Naknean P, Meenune M, Roudaut G. 2013. Changes in properties of palm sugar syrup produced by an open pan and a vacuum evaporator during storage. International Food Research J. 20(5):2323-2334.
Nindo CI, Powers JR, Tang J. 2007. Influence of Refractance Window evaporation on quality of juices from small fruits. LWT 40:1000–1007. Sonaye SY, Baxi RN. 2012. Particle size measurement and analysis of flour.
International J. of Engineering Research and Application 2(3):1839-1842. Stone H, Sidel JL. 2004. Sensory Evaluation Practices Third Edition. California
(US): Elsevier Academic Press.
Street R, Száková J, Drábek O, Mládková L. 2006. The status of micronutrients (Cu, Fe, Mn, Zn) in tea and tea infusions in selected samples imported to the Czech Republic. Czech J. Food Sci., 24:62–71.
Su YL, Leung LK, Huang Y, Chen ZY. 2003. Stability of tea theaflavin and cathechins. Food chemistry 83:189-195.
Panpae K, Jaturonrusmee W, Mingvanish W, Nuntiwattanawong C, Chunwiset S, Santudrob K, Triphanpitak S. 2008. Minimmization of sucrose losses in sugar industry by pH and temperature optimization. The Malaysian J. of Analytical Sciences 12(3):513-519.
Payet B, Sing ASC, Smadja J. 2006. Comparison of the concentrations of phenolic constituents in cane sugar manufacturing products with their antioxidant activities.
Wijaya APH. 2002. Pembuatan sirup teh hijau (green tea) rendah kalori [manuscript]. Bogor (ID): Institut Pertanian Bogor.
20
APPENDICES
Appendix 1 Moisture content and dry matter of dried red tea leaves
Notes:
W : weight of sample before drying (g) W1 : weight of sample + dried empty cup (g)
W2 : weight of empty cup (g)
Example of calculation (trial 1): =W−(W1−W2)
W ∗100
=5.0008−(17.2123−12.5414)
5.0008 ∗100 = 6.60 g/100 g
Appendix 2 Particle size measurement of ground-dried red tea leaves
Example of calculation:
% ������= ������
��� ∗100
% ����������= 100− ���������� % ������
% ������= 17281.5
.6∗100% = 0.09%
% ����������= 100%−0.0868% = 99.91
sieve size retain (gr) % retain % cumulative cumulative (gr)
4 mm 1.5 0.09 99.91 1727.1
1 mm 68.5 3.96 95.95 1658.6
600 µm 283.4 16.39 79.56 1375.2
500 µm 90.3 5.22 74.33 1284.9
250 µm 727.8 42.10 32.23 557.1
125 µm 411.7 23.82 8.41 145.4
63 µm 72.1 4.17 4.24 73.3
bottom 73.3 4.24 0 0
sum 1728.6 100 - -
Trial W W1 W2 dried tea MC % DM
1 5.0008 17.2123 12.5414 4.6709 6.60 93.40 2 5.0008 16.6268 11.9778 4.6490 7.04 92.96 3 5.0004 16.7550 12.1100 4.6450 7.11 92.89
Mean 6.91 93.09
Appendix 3 Color of tea syrup
Notes:
A syrup : 60 oC/-500 mmHg/35 h 8’ B syrup : 60 oC/-400 mmHg/34 h C syrup : 70 oC/-500 mmHg/8 h 35’ D syrup : 70 oC/-400 mmHg/28 h 30’
Sample – tea syrup
Trial Tea extract
Syrup
A B C D
L*
1 26.59 25.29 24.1 21.24 23.75 2 25.54 25.43 24.88 21.39 24.41 3 26.59 26.64 25.35 21.21 24.95
Mean 26.24 25.79 24.78 21.28 24.37
a*
1 -0.01 -1.39 -2.33 -1.16 -2.25
2 0 -1.57 -2.36 -1.49 -1.95
3 -0.03 -1.63 -2.44 -1.25 -2.37
Mean -0.013 -1.53 -2.38 -1.3 -2.19
b*
1 5.98 4.38 5.8 3.85 6.32
2 4.56 4.52 6.29 4.05 5.94
3 5.6 4.79 6.02 3.66 6.54
Mean 5.38 4.56 6.04 3.85 6.27
ΔL* 1 2 - - -0.11 -1.3 -2.49 -0.66 -5.35 -4.15 -2.84 -1.13
3 - 0.05 -1.24 -5.38 -1.64
Mean - -0.45 -1.46 -4.96 -1.87
Δa* 1 2 - - -1.38 -1.57 -2.32 -2.36 -1.15 -1.49 -2.24 -1.95
3 - -1.6 -2.41 -1.22 -2.34
Mean - -1.52 -2.36 -1.29 -2.18
Δb* 1 2 - - -0.04 -1.6 -0.18 1.73 -2.13 -0.51 0.34 1.38
3 - -0.81 0.42 -1.94 0.94
Mean - -0.82 0.42 -1.53 0.89
ΔE 1 2 - - 2.48 1.57 2.9997 3.41 5.87 4.44 3.63 2.64
3 - 1.79 2.74 5.85 3.01
Mean - - 1.95 3.05 5.39 3.09
22
Appendix 4 Color of tea drink
Notes:
A drink : dilution of A syrup B drink : dilution of B syrup C drink : dilution of C syrup D drink : dilution of D syrup
Example of calculation (A drink, trial 1)
Δa* = -1.11 – (-0.01) = -1.1 Δb* = 5.98 – 5.18 = -0.8
ΔE = ((2.18∗2.18)2 + ((−1.1)∗(−1.1))2+ ((−0.8)∗(−0.8)2)1 2⁄ = 2.57
Appendix 5 Dry matter of tea syrup
Notes:
A syrup : 60 oC/-500 mmHg/35 h 8’ B syrup : 60 oC/-400 mmHg/34 h C syrup : 70 oC/-500 mmHg/8 h 35’ D syrup : 70 oC/-400 mmHg/28 h 30’
W : weight of sample before drying (g) W1 : weight of sample + dried empty cup (g)
W2 : weight of empty cup (g)
Example of calculation (A syrup , trial 1)
= 100%−( W−(W1−W2)
W ∗100%)
= 100%− � 2.07−(14.00−12.55)
2.07 ∗100%� = 100%−29.70% = 70.30%
Parameter Trial Syrup
A B C D
W 1 2.0684 2.1035 2.1610 2.1410
2 2.0169 1.9280 2.1418 1.9275
W1 1 14.0014 13.5029 13.7139 13.3700 2 14.5197 13.7144 15.6528 13.4150
W2
1 12.5474 11.9843 12.1160 11.8481 2 13.1035 12.3252 14.0576 12.0451
% MC 1 29.70 27.81 26.06 28.92
2 29.78 27.95 25.52 28.93
DM 1 70.30 72.19 73.94 71.08
2 70.22 72.05 74.48 71.07
Mean - 70.26 72.12 74.21 71.08
24
Appendix 6 Total polyphenol content of tea syrup
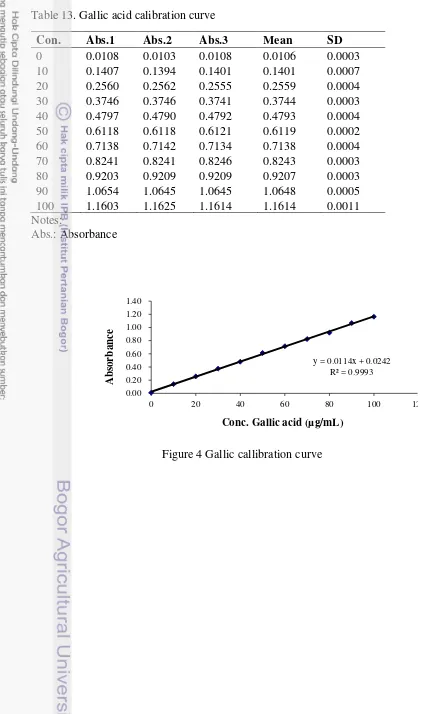
Table 13. Gallic acid calibration curve
Con. Abs.1 Abs.2 Abs.3 Mean SD
0 0.0108 0.0103 0.0108 0.0106 0.0003 10 0.1407 0.1394 0.1401 0.1401 0.0007 20 0.2560 0.2562 0.2555 0.2559 0.0004 30 0.3746 0.3746 0.3741 0.3744 0.0003 40 0.4797 0.4790 0.4792 0.4793 0.0004 50 0.6118 0.6118 0.6121 0.6119 0.0002 60 0.7138 0.7142 0.7134 0.7138 0.0004 70 0.8241 0.8241 0.8246 0.8243 0.0003 80 0.9203 0.9209 0.9209 0.9207 0.0003 90 1.0654 1.0645 1.0645 1.0648 0.0005 100 1.1603 1.1625 1.1614 1.1614 0.0011 Notes:
Abs.: Absorbance
Figure 4 Gallic callibration curve
y = 0.0114x + 0.0242 R² = 0.9993
0.00 0.20 0.40 0.60 0.80 1.00 1.20 1.40
0 20 40 60 80 100 12
A
bs
o
r
ba
nc
e
Notes:
A syrup : 60 oC/-500 mmHg/35 h 8’ B syrup : 60 oC/-400 mmHg/34 h C syrup : 70 oC/-500 mmHg/8 h 35’ D syrup : 70 oC/-400 mmHg/28 h 30’ Abs. : Absorbance
C : Gallic acid concentration (µg/mL)
Example of calculation (A syrup , trial 1), in search of C:
�= 0.0114�+ 0.0242 0.70 = 0.0114�+ 0.0242
�= 0.70−00 .0242
.0114 = 59.40 µg/mL
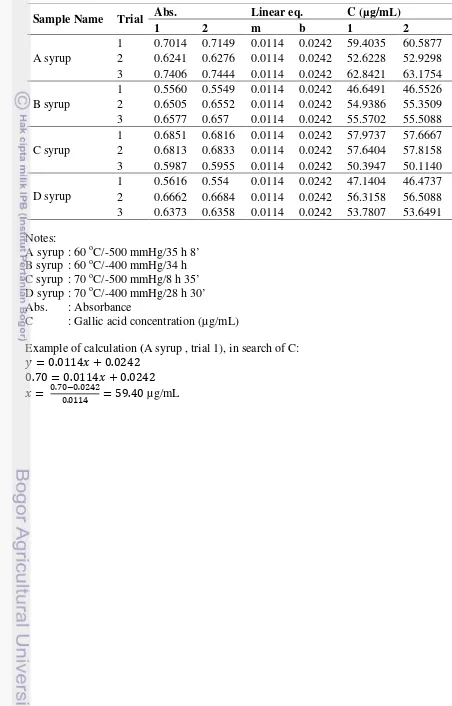
Table 14. Gallic acid concentration (µg/mL) obtained from calibration curve
Sample Name Trial Abs. Linear eq. C (µg/mL)
1 2 m b 1 2
A syrup
1 0.7014 0.7149 0.0114 0.0242 59.4035 60.5877 2 0.6241 0.6276 0.0114 0.0242 52.6228 52.9298 3 0.7406 0.7444 0.0114 0.0242 62.8421 63.1754 B syrup
1 0.5560 0.5549 0.0114 0.0242 46.6491 46.5526 2 0.6505 0.6552 0.0114 0.0242 54.9386 55.3509 3 0.6577 0.657 0.0114 0.0242 55.5702 55.5088 C syrup
1 0.6851 0.6816 0.0114 0.0242 57.9737 57.6667 2 0.6813 0.6833 0.0114 0.0242 57.6404 57.8158 3 0.5987 0.5955 0.0114 0.0242 50.3947 50.1140 D syrup
26
Notes:
C: Gallic acid concentration (µg/mL) Example of calculation (A syrup , trial 1) TPC (g GAE/100 g, wet basis) = (C∗V∗DF)∗100 Table 15. Total polyphenol of tea syrup
Appendix 7 Total reducing sugar of tea syrup
Notes:
A syrup : 60 oC/-500 mmHg/35 h 8’ B syrup : 60 oC/-400 mmHg/34 h C syrup : 70 oC/-500 mmHg/8 h 35’ D syrup : 70 oC/-400 mmHg/28 h 30’
F : invert sugar factor for 10 mL of Fehling’s solution
V1 : total volume of sample solution A (mL) (in this experiment = 250)
100 : conversion factor from 1 g to 100 g
Va : accurate volume of sample solution A used for titration (mL)
1000 : conversion factor from mg to g W : weight of sample (g)
Reducing sugar (% w/w) = � ×�1 ×100 �� ×1000 × �
Example of calculation (A syrup , trial 1) Reducing sugar (% w/100w) =
F∗V1∗100 Va∗1000∗W∗DM =
52.2∗250∗100
44.5∗1000∗11.58∗70.26 = 0.04
Sampel Trial W Va F %DM TRS Mean SD
A syrup
1 11.5840 44.5 52.2 70.2563 0.0360
0.04 0.01 2 11.5098 29.5 51.5 70.2563 0.0540
3 11.9965 39.8 52.0 70.2563 0.0388 B syrup
1 12.3738 25.5 51.2 72.1240 0.0562
0.05 0.00 2 11.0728 33.9 51.7 72.1240 0.0477
3 13.3745 27.4 51.4 72.1240 0.0486 C syrup
1 13.3902 29.9 51.5 74.2110 0.0433
0.05 0.01 2 13.0461 28.2 51.4 74.2110 0.0471
3 13.372 22.4 51.0 74.2110 0.0574 D syrup
1 11.6075 22.7 51.0 71.0775 0.0681
0.08 0.01 2 12.6500 18.1 50.8 71.0775 0.0780
28
Appendix 8 Sensory analysis of tea syrup
Panelis A syrup B syrup
appearance odor overall appearance odor overall
1 5 3 3 5 4 3
2 6 7 6 5 7 6
3 6 7 7 6 9 9
4 5 7 7 7 5 4
5 4 5 7 3 5 4
6 8 8 8 5 5 5
7 5 6 2 5 5 5
8 4 6 7 4 6 7
9 4 3 3 3 3 4
10 6 4 5 8 8 8
11 3 6 6 3 6 6
12 3 3 4 6 6 6
13 6 4 7 6 4 7
14 7 8 8 5 7 7
15 5 7 6 6 7 6
16 8 7 8 7 6 6
17 3 5 4 3 5 3
18 5 5 5 5 5 5
19 5 6 6 5 7 7
20 5 4 5 8 7 8
21 5 6 6 5 5 5
22 5 8 7 7 4 6
23 4 7 7 4 7 8
24 3 7 6 3 7 6
25 6 7 7 6 7 7
26 6 7 8 7 6 8
27 4 6 5 6 7 6
28 6 4 7 6 4 7
29 7 5 6 7 5 6
30* 4 8 12 7 9 16 31* 3 2 5 4 6 10
32 5 7 6 5 7 6
33* 4 5 7 7 8 6
34 9 9 9 8 8 8
Sensory analysis of tea syrup (cont’d)
Notes:
* Unacceptable data on sensory analysis of tea syrup A syrup : 60 oC/-500 mmHg/35 h 8’
B syrup : 60 oC/-400 mmHg/34 h C syrup : 70 oC/-500 mmHg/8 h 35’ D syrup : 70 oC/-400 mmHg/28 h 30’
Panelis C syrup D syrup
appearance odor overall appearance odor overall
30
Appendix 9 Sensory analysis of tea drink
Notes:
** Unacceptable data on sensory analysis of tea drink A drink : dilution of A syrup
B drink : dilution of B syrup C drink : dilution of C syrup D drink : dilution of D syrup
Sensory analysis of tea drink(cont’d)
Pa-32
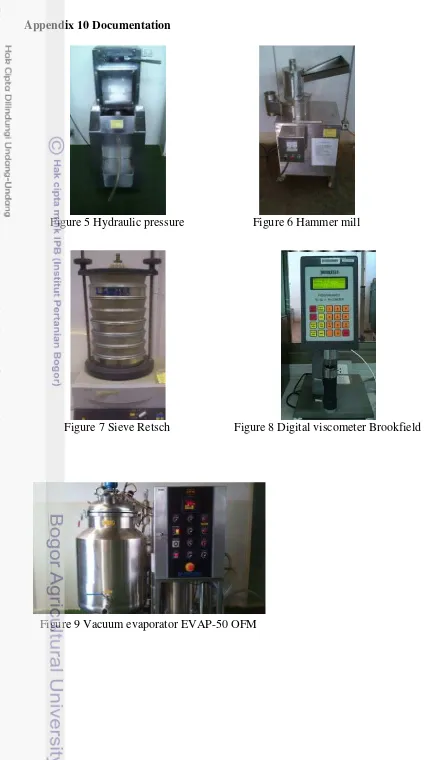
Appendix 10 Documentation
Figure 9 Vacuum evaporator EVAP-50 OFM
Figure 8 Digital viscometer Brookfield Figure 6 Hammer mill
Figure 5 Hydraulic pressure