IJG Vol. 45, No.1, June 2014 (89 - 98) © 2014 Faculty of Geography UGM and he Indonesian Geographers Association
Land use planning of paddy ield using geographic information
system and land evaluation in West Lombok, Indonesia
Widiatmaka, Wiwin Ambarwulan, Rudi P. Tambunan, Yusanto A. Nugroho, Suprajaka, Nurwadjedi, Paulus B.K. Santoso
Received: 07 01 2014 / Accepted: 22 01 2014/ Published online: 30 06 2014 © 2014 Faculty of Geography UGM and he Indonesian Geographers Association
Abstract Planning analysis to increase rice production either through intensiication of existing paddy ield area or ex-tensiication in potential land area was conducted in West Lombok Regency, West Nusa Tenggara Province, Indonesia. Existing paddy ield was delineated using high-resolution data from IKONOS imagery of 2012. Land use and land cover outside existing paddy ield were interpreted using SPOT-5 imagery of 2012. he Automated Land Evaluation System (ALES) was used for land suitability analysis for paddy. he results are interpreted in terms of the potential of paddy ield intensiication in existing paddy ield area and the potential of extensiication in land potentially used for paddy ield. he result of analysis showed that in West Lombok Regency, there are still possible to do intensiication and extensiica-tion of paddy ield to increase rice producextensiica-tion in order to improve regional food security.
Abstrak Analisis perencanaan peningkatan produksi padi melalui intensiikasi pada lahan sawah eksisting dan eksten-siikasi pada lahan yang potensial disawahkan dilakukan di Kabupaten Lombok Barat, Provinsi Nusa Tenggara Barat, Indonesia. Penggunaan lahan dan tutupan lahan diinterpretasi menggunakan citra SPOT-5 tahun 2012. Sawah eksisting didelineasi menggunakan citra beresolusi tinggi IKONOS tahun 2012. Evaluasi lahan menggunakan Automated Land Evaluation System (ALES) digunakan untuk analisis kesesuaian lahan untuk padi sawah. Hasil analisis menunjukkan bah-wa di Kabupaten Lombok Barat, masih dimungkinkan dilakukan intensiikasi pada lahan sabah-wah eksisting dan ekstensii-kasi pada lahan potensial sawah untuk peningkatan produksi beras dalam rangka peningkatan ketahanan pangan wilayah. Keywords: Automated Land Evaluation System, soil survey, land quality, land characteristic, image interpretation.
Kata kunci: Sistem evaluasi lahan otomatis, survey tanah, kualitas lahan, karakteristik lahan, interpretasi citra.
Indonesia’s dependence on rice as staple food is very high, and even worrisome when viewed from the spatial distribution of rice production locations. According to recent statistical data [BPS, 2013a], the harvested area of paddy ield in Java Island in 2012 is 6,165,079 Ha, constituted of 46.89% from the total Indonesian har-vested area. Such harhar-vested area produces rice as many as 34,404,557 tons, or constituted of 52.32% from the national rice production. In other words, Java Island,
Widiatmaka
Dept. of Soil Sciences and Land Resources, Bogor Agricultural University, Indonesia
Email: [email protected]; [email protected]
W. Ambarwulan, Suprajaka, Nurwadjedi Geospatial Information Agency, Indonesia
R. P. Tambunan
Center for Applied Geography Research, University of Indonesia, Indonesia
Y. A. Nugroho
Alumny, University of Gadjahmada, Indonesia
P. B. K. Santoso
Center for Agricultural Data and Information, Ministry of Agriculture, Indonesia
which is only about 6.9% of the land area of Indonesia, contributing to 52.32% of Indonesia’s rice production.
island to compensate the yield loss due to decreasing productivity of the current paddy ields.
Various eforts are needed to ensure Indonesian food security, such as by increasing rice production, controlling the rice consumption levels as well as con-trol of rice needs. One of the eforts which can be done to increase the production are intensiication of the ex-isting paddy ield and, if possible, extending paddy ield to the potential land, especially in outside Java Island. Eforts to increase the production in a speciic region are needed, at least so that an area will not depend on the other areas, which then will reduce the actual na-tional food security in the aggregate. Even if possible, an area should provide a surplus which can contribute to national food security. However, such intensiication and extensiication oten meet with many challenges. he main threats to the future food security include decreasing agricultural land, depleting water resources, declining trends in soil fertility and productivity, deple-tion of groundwater table [Devi & Ponnarasi, 2009] as well as, in case of Indonesia, ineicient land resources utilization.
West Lombok Regency is one of regencies in Lom-bok Island where its natural resources provide high possibilities for paddy ield intensiication as well as extensiication. According to the latest statistical data [BPS, 2013b], West Lombok Regency is able to pro-duce 152,686 tons of rice from irrigated paddy ields. hat amount, when added with 4,833 tons from non-irrigated paddy ield production, and with a population of 606,044 people in 2011, is expected to be adequate for self-suiciency of the regency, and even it can still provide a surplus as an addition to the regional and national food security. However, an increasing number of population which is faster than the growth of pro-duction in the future, may cause a productivity reduc-tion, which in turn can reduce the regional food secu-rity. Similar phenomena has been reported in previous study in Nusa Tenggara Province [Nazam et al., 2011]. herefore, eforts to increase the production should be implemented, at least to keep pace with population growth.
Both intensiication and extensiication need to be coupled with knowledge of the land properties. Eforts to increase rice production should be done by site-spe-ciic management. For example, Phosphate (P) fertilizer needs to be done only on land with P deiciency. In term of precision, land management should be done in the right time, amount, and place [Robert et al., 1994], as well as the source and manner [Khosla, 2010].
he objective of this paper is to present an analy-sis and planning to increase rice production, either through intensiication on existing paddy ields or extensiication on potential land in West Lombok Re-gency, West Nusa Tenggara, Indonesia. he plan is determined based on land suitability for paddy ields and site-speciic biophysical factors. his research can provide an important input for the government since
increasing the productivity of rice remains to be the major challenge for local governments and researchers in this countriy.
2.he methods
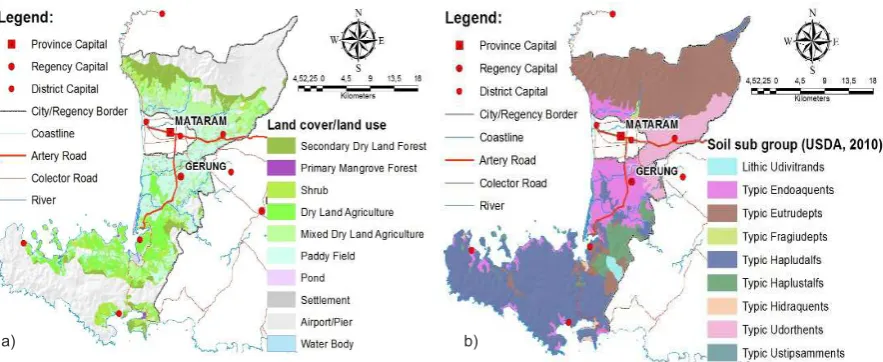
he research was conducted in West Lombok Regency, West Nusa Tenggara Province, Indonesia. Geographi-cally, the regency is located at 115.46°-116.20°E, and 8.25°-8.55°S. he research location is presented in Fig-ure 1. Average annual rainfall of the region is 1,586 mm, and average monthly rainfall is 132.2 mm, while aver-age number of rainy days is 14.1 days in a year [BPS, 2013b].
Land cover of the regency was irst delineated using SPOT-5 imagery acquired in 2012. Image classiication was done by supervised classiication, followed by ield checking. he classiication was done using ERDAS Imagine sotware. Imagery analysis produces 28 type of land use and land cover. However, to simplify the result, the land use and land cover were grouped into 13 type of land use and land cover. For existing paddy ield, a more accurate data were used for map correction based on Ministry of Agriculture agricultural data. his data was produced from paddy ield measurement activity using high resolution imagery IKONOS acquired in 2012.
A soil survey was conducted in 2013 in the study area as a part of survey conducted in the whole island of Lombok, initiated by Geospatial Information Agency, Indonesia. In that survey, 103 soil samples were taken from whole Lombok Island. he site sample locations in West Lombok Regency, as well as in other regencies in whole Lombok Island are given in Figure 1.
he analysis of physical and chemical [Widiatmaka et al., 2013a] soil properties was performed in Labora-tory of the Department of Soil Science and Land Re-sources, Faculty of Agriculture, Bogor Agricultural University and Laboratory of Center for Agricultural Land Resources, Bogor, Indonesia. he results of the survey were drawn on 1:25,000 map available at Geo-spatial Information Agency, Indonesia. In this paper, only the result in West Lombok Regency is presented.
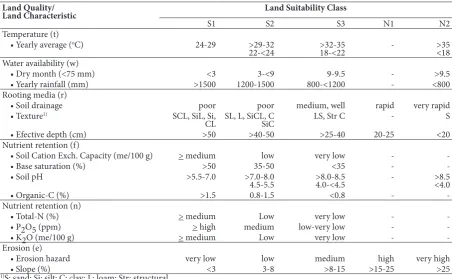
he land suitability for paddy ield was analyzed us-ing Automated Land Evaluation System (ALES) [Ros-siter, 2001]. Maximum limitation method was used for the land evaluation. In this method, degree of limitation of the land use was imposed by land characteristics on the basis of its permanent properties and required cri-terias [De la Rosa and Van Diepen, 2002; Armanto et al., 2012]. Land suitability criteria for paddy ield was structured by bibliographical studies [Hardjowigeno and Widiatmaka, 2007; Djaenudin et al., 2003; FAO, 1983; Ritung et al., 2007]. he criterias are presented in Table 1.
Sotwares which were used for land suitability analysis were ALES ver. 4.65e, Arc-GIS 10.1, and Microsot Of-ice. Analysis were performed by integrating Arc-GIS, ALES and expert knowledge.
Procedures for land evaluation model using ALES consist of: (i) establishing Land Use Type (LUT) (in this case is for paddy ield); (ii) establishing Land Use Re-quirement (LUR) for LUT; (iii) choosing and establish-ing Land Characteristic (LC) for each LUR and LUT; and (iv) making Decision Tree (DT). Land characteris-tics used for the land evaluation was stored in ALES da-tabase. Furthermore, expert knowledge is used to eval-uate the suitability of each Land Mapping Units (LMU). Expert knowledge describes the proposed land use in
physical and economical terms. In this paper, only the results of physical land evaluation analysis were pre-sented. An example of decision tree operation in ALES used in this research is shown in Figure 2. he results of ALES analysis were then transferred to Arc-GIS for geographical referencing and describing the results in form of maps and tables.
Mapping of soil and land suitability analysis were only done for non-forest area and area which oicially allowed for cultivation, namely the Area for Other Uses (AOU). For that purpose, at the early stage, delineation was performed by using Map of Forest Area Status at scale of 1:250,000 from Ministry of Forestry. Special attention was given regarding the use of this map at
Figure 1. Research location of West Lombok Regency and soil sampling points in whole Lombok Island
Table 1. Criteria of land suitability for paddy used in this research. Land Quality/
Land Characteristic Land Suitability Class
S1 S2 S3 N1 N2
Temperature (t)
• Yearly average (oC) 24-29 >29-32
22-<24 >32-3518-<22 - >35<18 Water availability (w)
• Dry month (<75 mm) <3 3-<9 9-9.5 - >9.5
• Yearly rainfall (mm) >1500 1200-1500 800-<1200 - <800
Rooting media (r)
• Soil drainage poor poor medium, well rapid very rapid
• Texture1) SCL, SiL, Si,
CL SL, L, SiCL, C SiC LS, Str C - S
• Efective depth (cm) >50 >40-50 >25-40 20-25 <20
Nutrient retention (f)
• Soil Cation Exch. Capacity (me/100 g) > medium low very low -
• Base saturation (%) >50 35-50 <35 -
• Soil pH >5.5-7.0 >7.0-8.0
4.5-5.5 >8.0-8.54.0-<4.5 - >8.5<4.0
• Organic-C (%) >1.5 0.8-1.5 <0.8 -
-Nutrient retention (n)
• Total-N (%) > medium Low very low -
• P2O5 (ppm) > high medium low-very low -
• K2O (me/100 g) > medium Low very low -
-Erosion (e)
• Erosion hazard very low low medium high very high
• Slope (%) <3 3-8 >8-15 >15-25 >25
scale of 1:250,000. In the current condition, Map of Forest Status in Indonesia only available at such scale, without detailed map. hus, at the operational level, delineated boundary became a concern that required more detailed mapping.
Overlay of the maps and data available using Geographic Information System produced paddy ield land classiication in 3 groups: (i) the existing paddy ield; this is the paddy ield area delineated from IKONOS imagery, (ii) land which is currently not a paddy ield area, but potentially developed as paddy ield; this is the land beyond the existing paddy ield, allows for the development of paddy ield, have a paddy ield land suitability at least marginally suitable (S3), and lies outside the forest area by Map of Forest Area Status, and (iii) land that is currently not paddy ield
area and is not possible or not potentially developed for developed as paddy ield; this is the case for settlements, ponds, mangroves and water bodies.
For technical reason of paddy ield development on relatively lat area, and since the data is available at 1:25,000 scale, additional criteria was applied to land that is currently not a paddy ield, but has a potential to be developed as paddy ield. A requirement of slope less than 3% was then applied. For this purpose, an overlay with the slope class map derived from contour map of 1:25,000 scale was done. he contour map was obtained from Geospatial Information Agency, Indonesia, which was used also as the base map for this research.
f (Nutrients Retention) >> Soil pH -1. [Very Low] >> Soil pH
- -1. [<4.0]... *5 (N2)
- -2. [4.0-<4.5].. *3 (S3)
- -3. [4.5-5.5].... =2
??
- -7. [>8.5]... =1
-2. [Low] >> Soil pH
- -1. [<4.0]... *5 (N2)
- -2. [4.0-<4.5].. *3 (S3)
- -3. [4.5-5.5].... *2 (S2)
- -4. [5.5-7.0].... =3
??
- -6. [8.0-8.5].... =2
- -7. [>8.5]... =1
-3. [>Medium] >> Soil pH
- -1. [<4.0]... *5 (N2)
- -2. [4.0-<4.5].. *3 (S3)
- -3. [4.5-5.5].... *2 (S2)
- -4. [5.5-7.0].... *1 (S1)
- -5. [7.0-8.0].... =3
- -6. [8.0-8.5].... =2
- -7. [>8.5]... =1
Discriminating entities are introduced by ‘ >> ‘ and underlined. Values of the entities are [boxed].
The level in the tree is indicated by the leader characteristics, ‘ - ’. The level in the branch is indicated by a numeric value. Result values are introduced by ‘ ...* ’.
At the same level, ‘ = ‘ indicate the same result as the branch with the numeric value that follows. The cut part of the tree is indicated by ‘??’
Figure 2. Example of decision tree used in this research to obtain land suitability class according to limiting factor of nutrients retention (f) of soil pH.
Figure 2. Example of decision tree used in this research to obtain land suitability class according to limiting factor of nutrients retention (f) of soil pH.
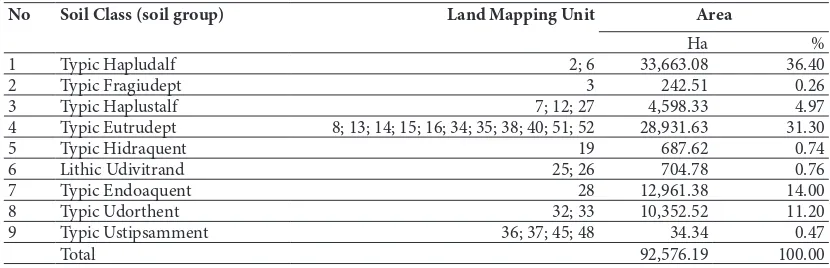
Figure 3. Map of land use and land cover of Area for Other Uses (AOU) (a) and map of main soil sub-group (b) in West Lombok Regency
3. Result and Discussion
From the results of the analysis of land use and land cover, only at the area with forest status of AOU are presented in Figure 3a and Table 2. he main land use and land cover in West Lombok Regency are paddy ield, dryland mixed farming, dryland farming, primary dry land forest, shrub and settlements, respectively.
Results of overlay among paddy ield area delineated from IKONOS image interpretation, area with non-paddy ield resulting from SPOT-5 interpretation, and area of AOU, produce an area which is then analyzed its land suitability for paddy ield.
Overall, Lombok Island is divided into 52 LMU, however in West Lombok Regency there are only 27 LMU. he LMU components used in this study include soil class data (in sub-group categories) [USDA, 2010], parent material, slope, and physiography. Soil map of West Lombok Regency, based only on soil sub-group is presented in Figure 3b. Summary of the soil distribution from the study area is presented in Table 3.
In West Lombok Regency, the paddy ield area reached 14,987.26 Ha, or 27.57% of the total area. According to statistical data [BPS, 2013b], the total area of paddy ield is 16,754 Ha, constituted of irrigated paddy ield area of 10,538 Ha, semi irrigated paddy ield area of 554 Ha, simple irrigated paddy ield area which cover 399 Ha, village irrigation paddy ield area which cover 1,537 Ha and rainfed paddy ield area of 3,726 Ha. here is a diference of 1,767 Ha between the statistical data and the data from image interpretation. Several reasons can cause this diference. First, it is possible that
in image analysis, diferent types of paddy ield were not identiied, so all of the types were simply identiied as paddy ield. Secondly, the diference can also be due to diferent measurement accuracy, as has been found in previous studies. Remote sensing technique is very useful for the detection of paddy ield [Wahyunto, et al., 2004]. he accuracy of the previous analysis is 89.4%. With increasing slopes, paddy ield deviation detection will be higher. In this study, the accuracy of the image interpretation with statistical data is 89.5 % of the statistical data. As a comparison, the analysis in East Lombok Regency, where the area is relatively lat, the data accuracy reaches 97.14% [Widiatmaka et al., 2013].
he soil in West Lombok Regency comprises 4 soil orders [USDA, 2010], covering Alisols, Inceptisols, Entisols and Andisols. In the sub-group category, there are 9 sub-groups. Alisols occupies the largest area, covering 38,261.41 Ha, or 41.4% of the area. Another soil order which is also quite widely spread is Inceptisols, which covers 29,174.14 Ha or 31.6%. he dominancy of Inceptisols and Alisols are related to soil development which was inluenced by local climate. Alisols is characterized by an accumulation of clay namely argillic horizon and has a high base saturation (>35%). Inceptisols is a soil which is relatively young, the soil development is not too advanced, characterized by the presence of cambic horizon. Development of Inceptisols and Alisols are related to the relatively dry climate areas [Tan, 2009].
Result of soil analysis, used as land qualities and
Table 2. Land use and land cover in the area of Other Uses Area (OUA), West Lombok Regency
No Land Use/Land Cover Area
Ha %
1 Primary Dry Land Forest 6,915.97 12.72
2 Mangrove Forest 162.15 0.30
3 Shrub 5,964.51 10.97
4 Dry Land Farming 8,858.11 16.29
5 Mixed Dry Land Farming 13,660.95 25.13
6 Paddy Field 14,987.26 27.57
7 Pond 741.72 1.36
8 Settlement 2,874.08 5.29
9 Airport 5.38 0.01
10 Water Body 191.81 0.35
Total 54,361.94 100.00
Table 3. Summary of main soil sub-groups in LMU of West Lombok Regency
No Soil Class (soil group) Land Mapping Unit Area
Ha %
1 Typic Hapludalf 2; 6 33,663.08 36.40
2 Typic Fragiudept 3 242.51 0.26
3 Typic Haplustalf 7; 12; 27 4,598.33 4.97
4 Typic Eutrudept 8; 13; 14; 15; 16; 34; 35; 38; 40; 51; 52 28,931.63 31.30
5 Typic Hidraquent 19 687.62 0.74
6 Lithic Udivitrand 25; 26 704.78 0.76
7 Typic Endoaquent 28 12,961.38 14.00
8 Typic Udorthent 32; 33 10,352.52 11.20
9 Typic Ustipsamment 36; 37; 45; 48 34.34 0.47
AND US
E P
L
ANNIN
G
W
idi
at
m
aka et a
l.
94
No Mapping Unit
Rooting Condition (r) Nutrient Retention & Fixation (f) Nutrient Availability (n) Erosion
Hazard (e)
Drainage Texture Efective Soil
Depth(cm)
CEC1)
(me/100g)
Base Satura-tion1) (%)
pH2) Organic
Carbon1) (%)
Nitrogen total1 (%)
P2O51)
(ppm)
K2O1)
(me/100g)
Slope (%)
1 SPL2 imperfectly clay >90 47.49/vh >100/vh 7.03/n 0.61/vl 0.05/vl 21.10/m 201/vh 3-8
2 SPL3 moderatly loam >90 5.9/l >100/vh 6.19/sa 0.63/vl 0.05/vl 66.30/h 106.59/vh 0-3
3 SPL6 well clayey loam 90-50 33.31/h >100/vh 6.04/sa 0.74/vl 0.07/vl 7.65/l 93.54/vh 0-3
4 SPL7 well loam 90-50 13.3/l >100/vh 6.16/sa 0.9/vl 0.09/vl 61.63/h 196.86/vh 3-8
5 SPL8 moderatly sandy clayey loam >90 13.89/l >100/vh 5.5/a 2.82/m 0.26/m 8.22/l 56/h 0-3
6 SPL12 well loam 90-50 7.59/l >100/vh 6.14/sa 0.87/vl 0.07/vl 1.97/vl 36/m 0-3
7 SPL13 moderatly clayey loam >90 14.9/l >100/vh 5.83/a 0.46/vl 0.04/vl 15.36/m 66/vh 0-3
8 SPL14 imperfectly sandy loam >90 8.64/l >100/vh 5.95/sa 0.91/vl 0.09/vl 10/l 55.57/h 3-8
9 SPL15 well loam 90-50 10.01/l 92,80/vh 5.37/a 1.13/l 0.11/l 61.36/vh 60.32/vh 0-3
10 SPL16 moderately sandy loam 90-50 7.53/l >100/vh 5.77/sa 0.99/vl 0.09/vl 4.81/l 63.89/vh 3-8
11 SPL19 poorly loam 50-25 20.22/m >100/vh 8.2/aa 0.85/vl 0.07/vl 29.17/h 347.50/vh 0-3
12 SPL25 well clayey loam 90-50 16.79/m 99,16/vh 5.88/sa 0.97/vl 0.09/vl 35.78/h 168.36/vh 0-3
13 SPL26 moderately loam 90-50 18.8/m >100/vh 5.96/sa 0.88/vl 0.07/vl 4.61/l 177.54/vh 3-8
14 SPL27 well loam >90 17.03/m >100/vh 6.48/sa 1.01/l 0.09/vl 62.63/h 179.96/vh 0-3
15 SPL28 well loam >90 9.2/l >100/vh 6.53/sa 0.84/vl 0.07/vl 15.66/m 52.34/h 0-3
16 SPL32 well clayey loam >90 31.52/h >100/vh 7.4/n 1.92/l 0.2/l 7.79/l 173.78/vh 3-8
17 SPL33 poorly clayey loam 50-25 25.48/h 52,71/vh 4.7/a 1.21/l 0.11/l 0.35/vl 67.52/vh 0-3
18 SPL34 well sandy loam >90 7.81/l >100/vh 5.8/sa 1.47/l 0.12/l 16.76/m 52.59/h 0-3
19 SPL35 imperfectly sandy loam 90-50 5.45/l >100/vh 5.82/sa 1.56/l 0.13/l 14.05/m 40.67/h 3-8
20 SPL36 well sand 50-25 2.63/vl >100/vh 7.1/n 0.18/vl 0.02/vl 5.88/l 139.90/vh 0-3
21 SPL37 imperfectly sand 50-25 9.4/h 73,83/h 5.09/a 0.3/vl 0.03/vl 17/m 88.64/vh 3-8
22 SPL38 well sandy loam >90 7.24/h >100/vh 5.8/sa 1.14/l 0.11/l 27.66/h 77.30/vh 0-3
23 SPL40 imperfectly loam 50-25 8.69/l >100/vh 6.5/sa 0.98/vl 0.07/vl 29.11/h 56/h 0-3
24 SPL45 well clayey loam 90-50 29.48/h >100/vh 7.34/n 1.3/l 0.1/l 7.95/l 199.52/vh 0-3
25 SPL48 well sand 90-50 8.94/l >100/vh 7.94/aa 0.46/vl 0.04/vl 9.67/l 146.57/vh 0-3
26 SPL51 well loam 90-50 15.16/l >100/vh 6.57/n 0.96/vl 0.08/vl 19.62/m 126.91/vh 0-3
27 SPL524 well sandy loam >90 12.57/l >100/vh 6.16/sa 0.91/vl 0.09/vl 55/h 65/vh 3-8
1)Ater slash, fertility status according to [CSR, 1983]: vl= very low; l= low; sl= slightly low; h= high; vh= very high.; 2)Ater slash, pH status according to [CSR, 1983]: a= acid; sa= slightly acid;
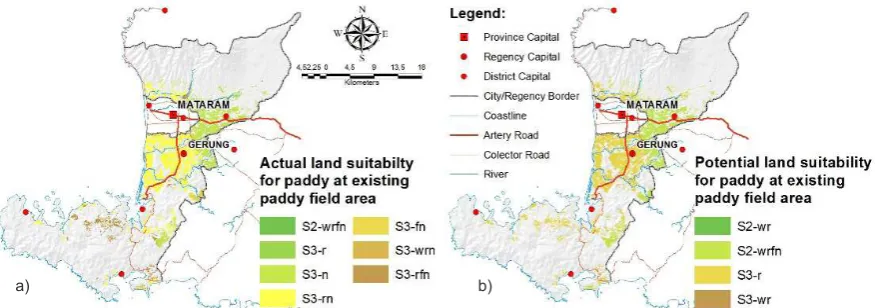
land characteristics for land evaluation, are presented in Table 4. he actual and potential land suitability maps resulting from land evaluation analysis in the area of existing paddy ield are presented in Figure 4a and 4b. Results of land suitability analysis show that the existing paddy ield has land suitability class ranged from S2 (suitable) to S3 (marginally suitable). In both land suitability classes of S2 and S3, the main limiting factors include land qualities of w (water available), r (rooting medium), f (nutrient retention) and n (available nutrients).
he limiting factor of water available (w) is generally caused by the length of dry month and the amount of monthly rainfall. he climate in the study area is relatively dry, although still wetter than its neighbour regency, East Lombok Regency for example. If rainfall is classiied by number of dry months (<75 mm) used in the criteria (Table 1), then the number of dry month is 8 months. Such long dry season is still situated in the S2 class for paddy ield. he limiting factor of rooting medium (r) is generally caused by land characteristic of soil texture. Texture in most soil samples ranged from loam, sandy clay loam to sandy loam, and even sand. hus, rough textures restrict the eiciency of water availability for paddy ield. he limiting factor of nutrient retention (f) are generally determined by cation exchange capacity (CEC) and soil organic Carbon (organic-C) content. Only a few samples showed high pH properties that become a limiting factor. CEC values of the samples ranged from very low to high when it is clasiied based on the assessment criteria of soil chemical properties [CSR, 1983]. Lowest value of soil CEC in West Lombok samples is 5.9 me/100 g (low), while the highest value is 47.49 me/100 g (high). Organic-C content of the samples ranged from 0.61% (very low) to 2.82 (high). Meanwhile, the limiting factor fof available nutrient (n) is the content of P2O5 and total Nitrogen (total-N) which is generally low. P2O5 content of the samples range from 1.97 ppm (very low) to 61.63 ppm (high). Total-N values ranged from 0.04 (very low) to 0.7 (moderate). Of course, for samples with CEC and nutrient levels moderate to high, these parameters do not become limiting factors.
To overcome some limiting factors, improvement can not be done at farming scale. Examples for this are limiting factor of water availability (w) caused by the number of dry month and rooting medium (r) caused by the soil texture. Other limiting factors can be improved by some improvement eforts. Nutrient retention (f), caused by low CEC can be improved through application of organic manures. Nutrients available (n) can be improved through application of Phosphate (P) fertilizer and application of organic manures. Such improvement eforts can be expressed as an intensiication of paddy ield.
Land suitability classes can be increased by the improvement. Besides the improvements according to each limiting factor identiied by land suitability analysis, almost all existing paddy ield production can be increased by development of irrigation canals.
Based on statistical data [BPS, 2013b], from the total area of 16,754 Ha paddy ield in West Lombok Regency, area that technical irrigated is 10,538 Ha, or 62.9%. he rest (about 37.1%) are half irrigated or rainfed paddy ields. Based on the statistical data [BPS, 2013b], it is also known that from 16,754 Ha of paddy ield, the harvested paddy area in 2011 was 28,386 Ha, or an average of 1.69 Farming Index. Improvement of irrigation infrastructure is expected to increase the Farming Index, which in turn increase the production.
Figure 4a presents the actual land suitability map [Widiatmaka, 2013b] of the existing paddy ield, while Figure 4b presents the potential land suitability map for the existing paddy ield under condition that improvement has been made according to each limiting factor. Table 5 presents the coverage area of land suitability in the existing paddy ield area. In this table, recommedations for the improvements are given based on limiting factor, coupled with improved irrigation treatment needs. hus, this table presents the potential intensiication that may be suggested in existing paddy ield area in West Lombok Regency.
Results of land suitability analysis at non-paddy ield area which are considered as potential area for paddy ield development show that the main limiting factors in non-paddy ield area includes land qualities of w (water
a) b)
availability), r (rooting medium), f (nutrient retention), and n (available nutrients). he improvement efort can be given to enhance the land suitability, including application of organic manures and P fertilizer to improve the limiting factors of nutrient retention. In addition to increase the its potential based on existing limiting factors, the improvements necessary for this non-paddy ield area is of course irrigation canals development.
Figure 5 presents the land suitability of potential land which can be developed as paddy ield. Table 6
presents land suitability classes on potential land which can be used as paddy ield. From the table, it can be seen that there is an ample potential for extending the paddy ield.
heoritically, the potential land for paddy ield extension in West Lombok Regency reaches 5,965 Ha. his potential is a theoretical potential, in terms of land suitability and several other factors which are considered in this study: the forest status and slope. In details, there are still other considerations needed, including the need for land utilization other than paddy,
Table 5. Actual land suitability for paddy in existing paddy ield area and improvement needed for paddy ield intensiication.
No Land Suitability Improvement Area
Ha %
1 S2-wrfn Phosphate fertilizer, organic manures, irigation improvement
3.96 0.03
2 S3-r Irigation improvement 204.18 1.36
3 S3-n Phosphate fertilizer 5,264.67 35.13
4 S3-rn Phosphate fertilizer, organic manures, irigation
improvement
7,595.15 50.68
5 S3-fn Phosphate fertilizer, irigation improvement 477.18 3.18
6 S3-rfn Phosphate fertilizer, irigation improvement 1,440.46 9.61
7 S3-wrn Phosphate fertilizer, organic manures, irigation improvement
1.66 0.01
Total 14,987.26 100.00
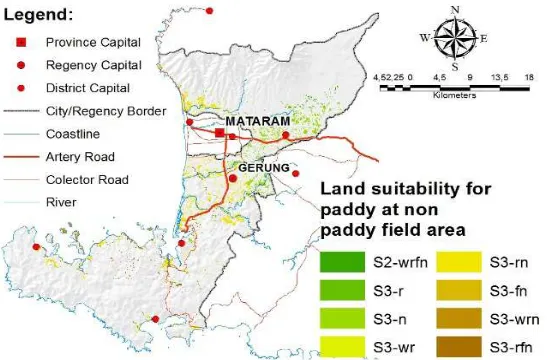
Figure 5. Map of land suitability for paddy in the non-paddy ield land potentially used as paddy ield in West Lombok Regency.
Table 6. Land suitability for paddy ield in the non-paddy ield area potential in West Lombok Regency.
No Land Suitability Improvement Area
Ha %
1 S2-wrfn Phosphate fertilizer, organic manures, irigation building
29.48 0.49
2 S3-r Irrigation building 151.87 2.55
3 S3-n Phosphate fertilizer 1,961.49 32.88
4 S3-wr Organic manures, irrigation building 35.29 0.59
5 S3-rn Phosphate fertilizer, organic manures, irrigation 2,770.61 46.45
6 S3-fn Phosphate fertilizer, irigation building 145.55 2.44
7 S3-rfn Phosphate fertilizer, irigation building 713.20 11.96
8 S3-wrn Phosphate fertilizer, organic manures, irigation building
157.59 2.64
the ability of governments to inance the paddy ields development, and other technical factors. Nevertheless, this research has indicated the potential land that can be used for increasing rice production. In addition, the implementation would also requires more detailed planning on a higher scale. he land use planning given in this research can be considered as a midle scale land use planning. he next macro scale land use planning should be done based on this research result.
4. Conclusion
In West Lombok Regency, there are still wide areas for intensiication of existing paddy ield. Improvement treatment necessary for this intensiication may include providing input to overcome limiting factors identiied in this study, as Phosphate fertilization, application of organic manures, and improvement of irrigation infra-structure in most areas. On the other hand, there are numbers of potential areas identiied for extending paddy ield. In theoretical calculations, the potential areas is 5,965 Ha. his information, which is
accompanied by spatial information can be used as a reference to the next detailed planning of the regency to increase rice production. his research can be followed for more detailed planning. Operational intensiication and extension can be mapped at a more detailed scale, with area prioritization. Calculations can also be done in more detail in increasing production with reference to the concept of FAO [FAO, 1976], which theoretically has described that there are diferent productivity of diferent land suitability classes.
Acknowledgement
he authors would like to acknowledge Center for Mapping and hematic Integration, Geospatial Information Agency, Indonesia for inancing this research, as well as Ministry of Agriculture, Indonesia for permission in using the data of paddy ield measurement using IKONOS imagery.
References
Abdurahman, A., Wahyunto, & Shoiati, R. (2005), Bio-physical criteria in the determination of perpetual paddy ields in Java Island, Jurnal Penelitian dan Pengembangan Pertanian 24: 131-136 (in Indone-sian with abstract in English).
Agus, F., & Irawan, B. (2006), Agricultural land conver-sion as a threat to food security and environmental
quality, Jurnal Penelitian dan Pengembangan
Perta-nian 25 (3): 101-121 (in Indonesian).
Armanto, H.M.E., Adzemi, M.A., Wildayana, E., & Imanudin, M.S. (2012), Limiting factors of land suitability and eforts to increase tidal lowland
ca-pability for paddy, UMT 11th International Annual
Symposium on Sustainability Science and Manage-ment, 9th – 11th July 2012, Terengganu, Malaysia. BPS (2013a), Harversted area, productivity and
pro-duction of paddy ields of all province, Indonesian Bureau of Statistics. http://www.bps.go.id/-tnmn_ pgn.php?kat=3 (downloaded 2 dec 2013) (in Indo-nesian).
BPS (2013b), West Lombok Regency in igures. Indo-nesian Bureau of Statistics (BPS). http://lombok-baratkab.go.id/lombok-barat-dalam-angka.html/. (downloaded 2 dec 2013) (in Indonesian).
Center for Soil Research (1983), Criteria for soil prop-erties evaluation, in: Hardjowigeno dan
Widiatma-ka (2007), Land Evaluation and Land Use Planning,
Gadjahmada, Univ. Press, Yogyakarta (In
Indone-sian).
De la Rosa, D., & Van-Diepen, C. (2002), Qualitative and quantitative land evaluation, in: Verheye W, ed., Land use and land cover, Encyclopedia of Life
Support System (EOLSS-UNESCO), Eolss Publ,
Ox-ford.
Djaenudin, D., Hendriman, M., Subagyo, H., Mulyani, A., & Suharta, N. (2003), Land suitability criteria for agricultural commodities, Soil Research Station, Center for Soil and Agroclimatic Research (in In-donesian).
Food and Agricultural Organisation (1976), A frame-work for land evaluation, Soils Bulletin 32. Food and Agriculture Orgabization, Rome, 72 p.
Food and Agricultural Organisation (1983), Guidelines: land evaluation for rainfed agriculture, Soils
Bulle-tin52, Food and Agriculture Orgabization, Rome.
Hardjowigeno, S., & Widiatmaka. (2007), Land Evalu-ation and Land Use Planning, Gadjahmada Univ. Press, Yogyakarta (In Indonesian).
Irawan, B. (2004), Paddy ield conversion in Java and its impact on rice production, in: F. Kasryno, E. Pas-andaran, and A.M. Fagi (Ed.), Economic of Paddy and Rice, Agric. Res. Dev. Ag., Jakarta (in Indone-sian with abstract in English).
Irawan, B. (2005), Paddy ield conversion: impact po-tential, pattern and determinant factors, Forum Penelitian Agro-ekonomi23 (1): 1-18 (in Indone-sian, with abstract in English).
Khosla, R. (2010), Precision agriculture: challenges and
opportunities in a lat world, 19th World Congress
of Soil Science, Soil Solutions for a Changing World, 1 – 6 August 2010, Brisbane, Australia. Published on DVD.
Robert, P., Rust, R., Larson, W. (1994), Site-speciic management for agricultural systems, Proceedings of the 2nd International Conference on Precision
Ag-riculture, Madison, WI. ASA/CSSA/SSSA.
Rossiter, D.G. (2001), ALES’s Home Page,
Documenta-tion and sotware for the Automated Land Evalu-ation System (ALES) expert system framework, http://www.css.cornell.edu/landeval/ales/ales.htm (downloaded 2 dec 2013).
Ritung, S., Wahyunto, Agus, F., & Hidayat, H. (2007),
Land suitability evaluation with example of land use map of West Aceh Regency, Soil Research Station and World Agroforestry Centre (in Indonesian). Sita-Devi, K., & Ponnarasi, T. (2009), An economic
analysis of modern rice production technology and its adoption behaviour in Tamil Nadu, Agricultural Economics Research Review 22: 341-347.
Tan, K.H. (2009), Environmental Soil Science, CRC Press, New York.
United States Department of Agriculture (USDA) (2010), Keys to soil taxonomy, United States De-partment of Agriculture.
Wahyunto, S.M., Murdiyati, & Ritung, S. (2004), Ap-plication of remote sensing technology and and it’s validation test for detection of paddy ield and land use and land cover, Informatika Pertanian 13: 745-769 (in Indonesian).
Widiatmaka, Ambarwulan, W., Munibah, K., Murtilak-sono, K., Tambunan, R.P., Nugroho, Y.A., Santoso, P.B.K., Suprajaka, & Nurwadjedi (2013a), Soil Sur-vey Interpretation and Land Evaluation for Plan-ning of Increasing Paddy Field Production: Case Study of East Lombok Regency, Proc. Nat. Sem. & Sci. Meet. Indon. Surv. Assoc., Yogyakarta, p. IV-56-IV-63.