ANALYSIS OF HYDROCARBON TREATING SYSTEM
TO THE EMISSION OF SPARK-IGNITION
FOUR-STROKE ENGINE
Binyamin1, Subroto2 and Tri Tjahjono3
1,2,3 Muhammadiyah University of Surakarta, Mechanical Engineering Department
Jl. A. Yani Tromol Pos I Pabelan Kartasura, Surakarta 57102, Indonesia [email protected]
ABSTRACT
The reduction of carbon monoxide (CO), unburnthydrocarbon (UHC) emission and fuel consumption on spark-ignition four-stroke engine is continuously attempted.The purposes from this research were to determine the effect of Hydrocarbon Treating System (HTS) on levels of CO, UHC and fuel consumption. This is an experimental research. It is conducted by comparing the exhaust pollutant concentration such as carbon monoxide, unburnt hydrocarbon and also fuel consumption between standard engine setting and Hydrocarbon Treating System applied. The research variable are HTS flow rate from Q1 = 0 cc/s (without HTS), Q2 = 1.5 cc/s, Q3 = 2 cc/s, Q4 = 2.5 cc/s, and Q5 = 3 cc/s. The research will be done in three conditions which are low, medium and high rotation.The result showed that Hydrocarbon Treating System decrease fuel consumption up to 19.43% with flow rate Q5 = 3 cc/s, but on the other hand it increase CO emission up to 80.84% with flow rate Q5 = 3 cc/s and UHC emission level up to 124.75% with flow rate Q5 = 3 cc/s from engine standard condition.
Key words: HTS, Carbon monoxide (CO), Unburnt Hydrocarbon (UHC), fuel consumption
INTRODUCTION
The reduction of air pollution from com-bustion devices is an increasingly serious concern worldwide due to the rise in fuel usage especially for transport applications in urban areas. Spark-ignition (SI) and diesel engines, widely used to power various types of vehicles, have been sho-wn to be a major source of air pollution in cities (Faiz A, et al, 1996). The primary pollutants emit-ted from modern SI engines are mainly oxides of nitrogen, (primarily nitric oxide, NO, with a small amount of nitrogen dioxide, NO2, collectively known as NOx), carbon monoxide (CO),
or-ganic compounds that are mainly unburned or partially burned hydrocarbons (UHC), small amounts of oxides of sulfur and particulates (Furuhama and Hiruma, 2004).
The liquid hydrocarbon, typically gasoline, is not itself explosive; rather, only the vapor deri-ved from the liquid is explosive. Since the vapo-rization process is exothermic, past efforts have been made to warm the fuel charge before it is admitted to the combustion cylinders, in order to hasten the vaporization.
resistant heaters and from water radiator (Jauhari, 2005). In most modern carburetors a hot spot is provided which is heated with the exhaust gas. Also, various forms of atomizers have been proposed to subdivide the fuel into droplet form, thereby increasing the surface area of a given fluid quantity to hasten its vaporization. Through this research, the writer wants to analysis the effect of HTS installation to the emis-sion of engine and fuel consumption. The result of this research will give us explanation whether this device works or not.
There are some objectives from this rese-arch as follow: (1) How to know the effect of using Hydrocarbon Treating System to CO emis-sions of spark-ignition four-stroke engine. (2) How to know the effect of using Hydrocarbon Treating System to UHC emissions of spark-ignition four-stroke engine. (3) How to know the effect of using Hydrocarbon Treating System to fuel consumption of spark-ignition four-stroke engine.
Problem limitation on the writing of this problem is used to adjust the tools which avai-lable and also for issues to be discussed or analy-zed is not too widespread.Limitations are as follows (1) The fuel which used in the experiment is gasoline with octane number 88. (2) Engine that used is Honda Revo version 2008 (Stan-dard) (3) The discussion is about the emission and fuel consumption before and after using of Hydrocarbon Treating System. (4) The research will be done in three conditions which are low, medium and high rotation.
Review Of Literature
Hidayat(2005) hasconducted research on the tool-lowering exhaust emissions on motor-cycles, cars, outboard motors and internal com-bustion engines do not move. Based on test data that have been made to the additional equipment is capable of reducing CO emissions significantly, up to the limit of the maximum, and average can be reduced to above 54%. In addition to redu-cing CO2 emissions and HC, also able to increase
the content of O2. Additional tool does not influence the performance of the vehicle during
operation. One other advantage is being able to reduce the noise level generated by the motor.
Warju (2006) has conducted research on effects of the use of copper coated manganese catalytic converter on the exhaust pollutant levels four-stroke gasoline engine. The results showed that the composition of the catalyst 110 gr + 90 gr Mn Cu is the best composition in the lower levels of exhaust pollutants and increase engine performance. CO pollutant levels fell 96.36% in A/F 15 with the temperature range 273 - 340°C. HC pollutant levels fell 94.74% in A/F 14.7 with a range of temperatures 240-306°C. Torque is up 38.37% at round about 9000 rpm. Power rose 37.43% at round about 9000 rpm. Bmep rose 38.37% at round about 9000 rpm. Thermal efficiency rose 50.27% at round about 9000 rpm. Cu catalyst composition 170 gr + 30 gr Mn is the best composition of the Sound Pressure Level (SPL). SPL rose 3.7% when compared to standard.
Naudin(2000) has conducted emissions testing on car engine using the Multi-Fuels Pro-cessor. In this experiment using fuel with 25% gasoline and 75% water inside a bubbler tank. Results showed levels of 8.6% CO2 in standard
conditions become to 0.1%. A level of nitrogen oxide (NOx) in standard conditions was 348 ppm become to 168 ppm. A level of Unburned Hydrocarbon (UHC) in standard conditions was 3 ppm become to 1 ppm and fuel consumption in standard conditions was 11.7 !/100 km be-come to 9.8 !/100 km.
Fundamental Of Theory
When the flame is fully developed, it propagates very rapidly across the combustion chamber, ac-celerated and spread by turbulence and mass motions within the cylinder. This raises the tem-perature and pressure in the cylinder, and the piston is forced down in the power stroke. By the time, the flame front reaches the corners of the combustion chamber, only a few percent of the air-fuel mixture remains, and the flame is ter-minated by heat transfer and viscous drag with the wall.
The basic elements of combustion in the combustion chamber are shown as figure below:
Figure 1. Components of Basic Combustion(Sullivan, 2011)
Actually, the compositions of fuel sub-stances are carbon, hydrocarbon, nitrogen, sul-fur, oxygen, ash, and moisture. The reaction in the combustion chamber among air, fuel, and spark can be written as(Toyota, 1995):
C8H18 + 12.5 (O2 + 3.76 N2) ® 8 CO2 + 9
H2O+47N2 + Energy .(1)
1. Factors Influencing the Flame Speed The study of factors which affect the velocity of flame propagation is important since the flame velocity influences the rate of pressure rise in the cylinder and it related to certain types abnormal combustion that occur in spark-ignition engines. There are several factors which affect the flame speed, to va-rying degree, the most important being tur-bulence and the fuel-air ratio. Details of va-rious factors that affect the flame speed are discussed below:
1.1 Turbulence
Turbulence which is supposed to consist of many minute swirls appears to increase the rate of reaction and produce a higher flame speed than that made up of larger and fewer swirls. A suitable design of the combustion chamber which involves the geometry of cylinder head and piston crown increase the turbulence during the compression stroke.
1.2 Fuel-Air Ratio
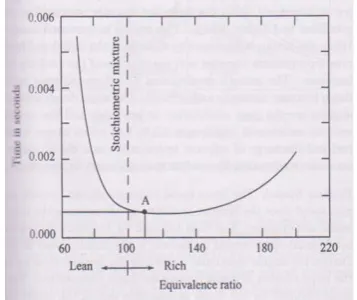
The fuel-air ratio has a very significant influence on the flame speed. The highest flame velocities (minimum time for com-plete combustion) are obtained with so-mewhat richer mixture (point A) as shown in figure which shows the effect of mix-ture strength on the rate of burning as in-dicate by the time taken for complete bur-ning in a given engine.
When the mixture is made leaner or richer (see point A in figure 2)(Ganesan, 2003) the flame speed decreases. Less thermal energy is released in the case of lean mix-ture resulting in lower flame temperature. Very rich mixture leads to incomplete combustion which results again in the release of less thermal energy.
1.3 Fuel Consumption (mf)
Fuel consumption is the amount of fuel that needed to do work per hour, which can be formulated as bellow:
mf = 1000 bb
3600 t
b
(kg/h) ..(2) Where:
mf = fuel consumption rate (kg/h) b = volume that used in experiment
(cc)
t = time needed to run down the fuel in Erlenmeyer (second) ñbb = density of fuel (kg/ !) 1.4 Hydrocarbon Treating System (HTS)
Hydrocarbon Treating System is a sys-tem that provides vaporized fuel charge through the use of a novel arrangement by using heat from exhaust gas, the vap-orized fuel then projected directly to the combustion chamber. The presence of vaporized fuel influences the reactivity between fuel and air. Once this vapor charge is mixed with air, it is more ig-nitable at air-fuel ratios below those at which conventional fuel/air mixtures may be ignited.
1.5 How HTS Work
The hydrocarbon fuel is volatilized in a volatilization chamber or bubbler tank because the tank is in vacuum so the at-mosphere air can
enter the tank. And then it is subjected to a high temperature environment in a heated reaction chamber or catalyst prior to its being introdu-ced into the intake system of the engine. The reaction chamber provides a heated reaction zone with a reaction rod therein about which the fuel flows. It flows through the heated reaction zone about the reaction rod which makes the fuel suitable for burning in the combustion chamber.
Since the engine is running, it will produce high temperature exhaust gases. This high temperature gases then make the tempe-rature of exhaust manifold rise. The heat from exhaust manifold used for heating the reaction chamber or catalyst. The hy-drocarbon vapor that flow through the reaction chamber is being heated by the heat from exhaust manifold. Currently, it is not known precisely what happens to the volatilized hydrocarbon fuel in this high temperature environment although one speculation is that the larger mole-cules are broken down into smaller mole-cular subunits of the heavy molecules.
1.6 Hydrocarbon Bubbler
The bubbler is a tank containing bubbles of hydrocarbons (gasoline). The bubbles flow
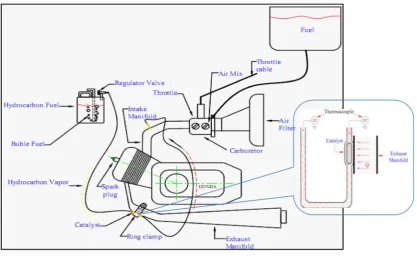
Figure 3. HTS installation
coming from the bubbler tank of the engine circulates by the outside part of the reactor with a strong kinetic energy, that contributes to bring up to very high temperature the steel rod (being used as heat accumulator) contained in the trea-ting chamber.
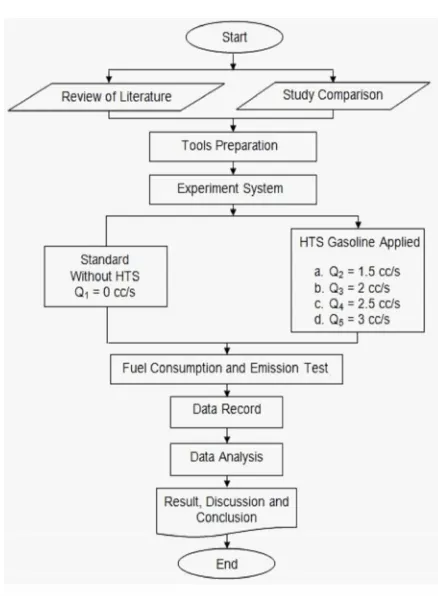
RESEARCH METHODOLOGY Flow Chart of Research
Figure 5. Flow Chart of Research Figure 4. Bubbler Tank
Figure 5. Flow Chart of Research
Tools and Materials
Material and tools that used in this research were:
Table 1. Specification of Honda Revo Engine Figure 4. Bubbler
Type 4 Strokes Engine
Type of cylinder Single, H type
Valve mechanism SOHC
Fuel System Carburetor
Intercooler Air
Volume Displacement 97.1 cc
Bore x Stroke 50 x 49.5 mm
Compression Ratio 9.0:1
Maximum Power 7.3 PS/8000 rpm
Maximum Torque 0.74 kgf.m/6000 rpm
Clutch Automatic centrifugal wet type and double clutches
Starter Pedal and electric starter
1. The engine that would be used is Honda Revo 2008, with specifications of the engine at table 1.
2. Gasoline
3. Emission Analysis 4. HTS Tools
a. Hydrocarbon tank
Bubbler tank is a maker of air bubbles resulted by the intake manifold vacuum. The bubbler has volume 500 m ! for filling the gasoline.
b. Catalyst
Catalyst is a reactor that increases the rate of a chemicals reaction such as molecules volume & temperature of bubbles.
c. Heat-resistant hose
d. O-Clamp e. Regulator valve f. Cable ties 5. Measuring Tools
a. Thermometer
b. Measuring Glass (Burret) c. Digital Tachometer d. Stopwatch
e. Venturi Flow Meter f. Hygrometer
Experiment Installation
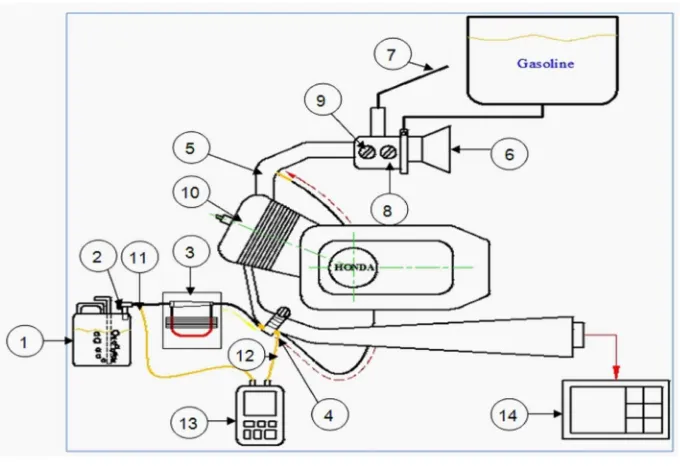
Experimental installation used in the experiment by applying Treating Hydrocarbon-systems use a venture-flow meter as a measurement of fuel vapor flow rate from the bubbler with the following scheme:
Figure 6. Scheme of Experiment Installation Figure 6. Scheme of Experiment Installation Descriptions:
1. Bubbler tank 2. Regulator valve 3. Venturi-Flow Meter 4. Reactor/catalyst 5. Intake manifold 6. Air intake 7. Throttle cable
8. Air mix 9. Throttle 10. Engine
Experiment Procedures
There are several steps that have been done in this experiment are:
1. Testing Engine In Standard Condition without HTS
a. Installing the burret and then filled to 150 cc of petrol.
b. Installing the exhaust gas analyzer equip-ment in the muffler.
c. When the machine is turned on throttle turn clockwise and make it idle / statio-nary condition around 1200 rpm. d. Rotate clockwise throttle to 2000 rpm
and recording of data from fuel con-sumption and emissions.
e. For the next experiments by raising en-gine rotation at 2000 rpm, 2500 rpm, 3000 rpm, 3500 rpm, 4000 rpm, 4500 rpm, 5000 rpm, 5500 rpm and 6000 rpm and recording data of fuel con-sumptions and emissions.
2. Testing Engine with HTS applied
a. Installing HTS devices on Revo Engine. b. Installing measuring glass/burret and then
filled to 150 cc of petrol.
c. Installing the exhaust gas analyzer equip-ment in the muffler.
d. When the machine is turned on throttle turn clockwise and make it idle/stationary condition around 1200 rpm.
e. Open valve of bubbler when vapor flow rate at Q = 1.5 cc/s and rotate clockwise throttle to 2000 rpm and recording data of vapor temperature (T1& T2), volume of gasoline in bubbler tank before & after using, fuel consumption and emissions. f. For the next step that are similar just
cha-nge engine rotations at 2500 rpm, 3000 rpm, 3500 rpm, 4000 rpm, 4500 rpm, 5000 rpm, 5500 rpm and 6000 rpm. g. Open valve of bubbler when vapor flow
rate at Q = 2 cc/s and rotate clockwise throttle to 2000 rpm and recording data of vapor temperature (T1& T2), volume
of gasoline in bubbler tank before & after using, fuel consumption and emissions. h. For the next step that are similar just
cha-nge engine rotations at 2500 rpm, 3000 rpm, 3500 rpm, 4000 rpm, 4500 rpm, 5000 rpm, 5500 rpm and 6000 rpm. i. Open valve of bubbler when vapor flow
rate at Q = 2.5 cc/s and rotate clockwise throttle to 2000 rpm and recording data of vapor temperature (T1& T2), volume of gasoline in bubbler tank before & after using, fuel consumption and emissions. j. For the next step that are similar just
cha-nge engine rotations at 2500 rpm, 3000 rpm, 3500 rpm, 4000 rpm, 4500 rpm, 5000 rpm, 5500 rpm and 6000 rpm. k. Open valve of bubbler when vapor flow
rate at Q = 3 cc/s and rotate clockwise throttle to 2000 rpm and recording data of vapor temperature (T1& T2), volume
of gasoline in bubbler tank before & after using, fuel consumption and emissions. l. For the next step that are similar just
change engine rotations at 2500 rpm, 3000 rpm, 3500 rpm, 4000 rpm, 4500 rpm, 5000 rpm, 5500 rpm and 6000 rpm.
RESULT AND DISCUSSION
Experiment result analysis of Carbon Monoxide (CO)
Based on experiments that have been do-ne, can make chart the relationship between CO and the engine rotation as follows:
Based on the figure above we can look that the lowest level of CO emission is in the standard condition or we may say when the HTS is s e ttin g in Q
1= 0 cc/s. The lowest CO decline the number of 2.13% when engine rotation at 5,500 rpm. On the other hand, the highest level of CO is obtained when the engine is setting in Q5 = 3 cc/s, CO points the number of 6.19% at 2000 rpm. Somehow, all the result almost shows the same trendlines. With increasing of engine rotation the degree of CO on emission for all flow rates was degradation.
Experiment result analysis of Unburned Hydrocarbon (UHC)
Based on experiments that have been done, can make chart the relationship between UHC and the engine rotation as follows:
Figure 8. Chart of UHC vs. rpm
From the figure above we can analyze that the lowest emission of UHC on the standard set-ting or in the HTS flow rate of Q1= 0 cc/s. The lowest emission of UHC in the standard setting is 52 ppm at 4,000 rpm. On the other hand, the highest emission of UHC can be seen on the en-gine which has the flow rate of Q5= 3 cc/s. The emission of UHC in this condition is 728 ppm at 2,000 rpm. It mean, addition of HTS flow rate can make emission of UHC increase as signi-ficant.
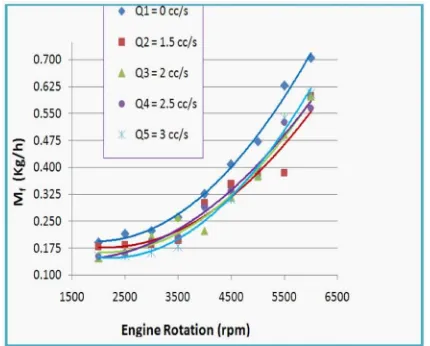
Experiment result analysis of Fuel consumption (mf)
The effect of Hydrocarbon Treating Sys-tem on the fuel consumption is shown in Figure 9 below. It is clearly indicates an increase of fuel consumption with the engine rotation. The highest fuel consumption reaches when the engine is set in standard condition. It points the number of 0.705 Kg/h at 6,000 rpm. Meanwhile, the lowest fuel consumption at 6,000 rpm happens when the engine is set in 2.5 cc/s. It points the number of 0.565 Kg/h.
Figure 9. Chart of mf vs. rpm
The average value in every rotation, the fuel consumption in standard condition is still ta-king the highest consumption it shows the num-ber of 0.381 Kg/h. For the flow rate 1.5 cc/s is lower 19.37% than consumption in standard condition. It points in the number of 0.307 Kg/ h. On the other hand, the fuel consumption is only decrease 18.67% if the engine is set in 2 cc/s and 17.72 % if the engine is set in 2.5 cc/ s. In fact, the highest difference happens when the engine is set in the flow rate of 3 cc/s. This is due to decrease of charge from fuel tank. The decrease in charge of fuel consumption is attributed by the increase of the amount of air in the HTS.
Figure 8. Chart of UHC vs. rpm
CONCLUSION
1. The emission level of CO in standard engine condition (Q1 = 0 cc/s) is the lowest emission level of CO from others. For standard engine condition the emission level of CO is 2.13%. Whereas, CO emission level for others set-ting results are 2.97% for Q2= 1.5 cc/s,
3.22% for Q3= 2 cc/s, 3.56% for Q4= 2.5
cc/s, and 3.67% for Q5= 3 cc/s.
2. The emission level of UHC in standard engine condition (Q1 = 0 cc/s) is the lowest emission
level of UHC from others. For standard engine condition the emission level of UHC is 56 ppm. Whereas, UHC emission level for others setting results are 81 ppm for Q2 = 1.5 cc/s, 91 ppm, for Q3= 2 cc/s, 92 ppm
for Q4= 2.5 cc/s, and 110 ppm for Q5= 3
cc/s.
3. Hydrocarbon treating system can reduce the number of fuel consumption about 19.43% from standard engine condition.
REFERENCES
Çengel, Y. A., Boles, M. A. 2006.Thermodynamics:An Engineering Approach, 5th ed., McGraw-Hill, P. 753.
Faiz A, Weaver CS, Walsh MP. 1996.Air pollution from motor vehicles: standards and technologies for controlling emissions. Washington DC: The World Bank.
Furuhama S. Hiruma M., 2004.Some characteristics of oil consumption measured by hydrogen fuelled engine, J of ASLE 1977; 34:665 75,
Ganesan V. 2003.Internal Combustion Engines. Second Edition. Tata McGraw Hill Book Co. Hidayat, K.T. 2005.Study Pengaruh Penambahan Zat Aditif Peningkat Angka Oktan ke Dalam
Bahan Bakar Pertamax Terhadap Unjuk Kerja Mesin Dan Emisi Gas Buang,Tugas Akhir S-1, Teknik Mesin, Universitas Muhammadiyah Surakarta, Surakarta.
Jauhari, E. 2005.Analisis Pemanasan Bahan Bakar Terhadap Unjuk Kerja Mesin Bensin, Tugas Akhir S-1, Teknik Mesin, Universitas Muhammadiyah Surakarta, Surakarta.
Naudin, J.L., 2000.Pantone s Multi-fuel Processor, http://www.jlnlabs.org (Accessed on Wednesday, January 05, 2011)
Sullivan K.2011.Technical Support Articles, 20th. 21st. 22nd. and 23rd editions, Toyota Motor
Sales, USA, Inc. http://www.autoshop101.com/ (Accessed on Wednesday, January 05, 2011)
Toyota. 1995.Materi Pelajaran Engine Group Step 2,PT Toyota-Astra Motor.