Chapter II
Theoretical Background and Hypothesis Formulation
2.1 Theoretical Background
Through this chapter, the related theories about the research will be elaborate more to give understanding to build the hypothesis of the research. The theories will be regarded to variables which are related to this research, such as Efficient market theory, the forms of Efficient Market, the theories regarding market anomalies, Holiday Effect and firm size theories, and so forth.
2.1.1 Capital Market
Capital market is the place or media where the capital trading activity is going on. Generally, capital market is an organized financial system, in which there are commercial banks, financial intermediaries, and issued securities. In more specific definition, capital market is the place where the stocks, obligations, and other form of securities are traded (Sunariyah, 2000). In the capital market, the parties who have excess capital or fund (investors) are connected with the parties who have less capital and need it (issuers of the securities).
instruments such as, obligation and equity which issued both by government and private entities (SuadHusnan, 2003).
Capital market has important function in a country’s economy. There two functions of
Capital market, the first is to facilitate enterprise in gaining the fund from the investors for running their businesses and the second is to facilitate the society to invest their fund in financial instruments, such as, stocks, obligation, mutual fund and so forth. By doing the investment people can allocate their money in their preferred financial instrument, based on their consideration regarding its risks and returns.
The organized place to trade securities, then called stock exchange. there are some roles of stock exchange, such as maintaining market continuity and maintaining fair price through supply and demand mechanism. All the securities traded in the stock exchange are long terms which have the maturity period for more than 1 year. In Indonesia, the stock exchange is called IDX where there are 464 company listed. The most common securities traded in IDX, are obligations, stocks, and rights. From those explanations we can conclude that capital market is the market where all the long term securities are traded as the source of funding for the issuers of securities by sharing the ownership and to facilitate the investors in investing their money into financial instruments.
2.1.2 Stock Indices
a. As an indicator of market trend
b. As an indicator to measure profitability c. As a benchmark of a certain portfolio
d. To facilitate the establishment of portfolio through passive strategy e. To facilitate the development of derivative products.
At present, there are 14 stock price indices and 1 bond index in Indonesia Stock Exchange (IDX) in order to give more comprehensive information about market movement to the investors. Those indices are such as follow (IDX Fact Book, 2013):
1. JCI (Jakarta Composite Index), which uses all listed stocks as the constituents for its index calculation.
2. Individual Index, which the price index of each stock compared to the base price. 3. LQ45 Index, which consists of 45 selected stocks.
4. IDX30 Index, which consists of 30 selected stocks. 5. Kompas 100 Index, which consists of 100 selected stocks.
6. Sectoral Indices, which consists of all stocks in each particular sector.
7. Indonesia Sharia Stock Index (ISSI), which uses all listed stocks included in the Lists of Sharia Securities (DaftarEfekSyariah) issued by FSA.
8. The JII Index, which consists of 30 selected stocks included in the Lists of Sharia Securities (DaftarSyariahEfek) issued by FSA.
9. Bisnis-27 Index, which consists of 27 stocks chosen based on Fundamental Criteria and Technical Criteria or Transaction Liquidity.
11.SRI-KEHATI Index, which consists of 25 listed stocks with excellent practices on supporting their sustainability through methods that concern about environment, social and good corporate.
12.Infobank15 index, which consists of 15 leading stocks of the bank listed on IDX. 13.Sminfra18 Index, which consists of 18 stocks listed on IDX which is engaged in
infrastructure and supporting.
14.Main Board Index (MBX) and Development Board Index (DBX), which are using all listed stocks on each board.
15.Indonesia Government Index (IGBX), which is index for bonds. IDX also have indicator to show yield of government bonds in Indonesia, called Indonesia Government Securities Yield Curve (IGSYC).
All of the indices above are using the same calculation method; the differences are in the numbers of the stocks as the constituents and the base date of the index. This thesis use JCI and LQ45 index to examine the presence of Eid al-Fitr Holiday Effect in Indonesia capital market.
The writer choose JCI as one of the sample to provide the evidence of Eid al-Fitr Holiday Effect in Indonesia capital market, since JCI consists all listed companies in IDX (Indonesia Stock Exchange). So, by using JCI as one of the sample, the result can represent the market as a whole. Below is the JCI calculation formula:
Furthermore, the writer also use LQ45 index to analyze the relation between the firm size and holiday effect. LQ45 index consists of 45 most liquid stocks in capital market and it also covers at least 70% of the market capitalization and transaction values in the regular market (IDX Fact Book). The 45 listed stocks in LQ45 are examined and replaced in every 6 months, in beginning of February and August. The stocks as the constituents are chosen based on some factors, such as (IDX Fact Book, 2013):
1. The stocks should have been listed at the IDX for at least 3 months.
2. The performance of the stock in the regular market, which its includes trading value, volume and frequency of transactions.
3. The number of trading days in regular market.
4. The stock’s market capitalization factors, the stocks selection for LQ45 Index is also based on the financial condition and prospects of growth of the companies.
2.1.3 Efficient Market Theory
There are many expert definitions about the efficient market theory, as cited by Jogiyanto (2003:363):
“The capital market efficiency is the relation between the stock prices and the information. In detail, market efficiency can be defined in some definitions, such as, (1) the definition of market efficiency is based on the intrinsic value of the stock (Beaver;1989), (2) the definition of market efficiency is based on the accuracy of the stock prices (Fama:1970), (3) the definition of market efficiency is based on its information distribution (Beaver:1989), and (4) the definition of market efficiency is based on the dynamic process (Jones:1995).”
prices. According to this theory, the current prices of all the stocks also reflected the present values of future cash flows (Williams 1938).
This theory also explains that price is an accurate signal to do the investment or capital allocation in a country as it reflects what really happens in a country or more specifically in a firm. The implications of efficient market theory affect both the management and investors. Weston and Copeland (1995; 285) stated that, “ in an efficient capital market, the price is
quickly reacted to the new information, therefore the managers have to supervise their stock prices to analyze market perception regarding their management decisions”.
In 1953 Maurice Kendall, came out with a “random walk” hypothesis. He examined the
behavior of weekly changes in nineteen indices of British share price and in spot prices for cotton (New York) and Wheat (Chicago). After making an extensive analysis of those indices, Kendal came up with the statement, “the series look like a wandering one, almost as
if once a week the Demon of Chance drew a random number from a symmetrical population of fixed dispersion and added it to the current price to determine the next week’s price”. The
statement describes the fluctuation of the indices which does not have a certain pattern or in other words it is random.
If the movement of the stock prices does not follow a certain pattern or it just fluctuates randomly, then the historical prices cannot be used to help predicting the future stock prices. The stock prices movement is randomly fluctuated and therefore, cannot be traced. According to this hypothesis if we can explain the movement of the stock prices, then the profit can be earned easily.
According to Jenson and Smith which is cited in Anoraga and Panji (2006:83) stated that “...and because the all information is delivered perfectly, there is no way for the investors to
the future prices, thus the investors cannot take advantage by using that information to earn abnormal return by manipulating the information which is available internally for him. Abnormal return is the difference between the actual return and the expected return (Husnan,2001). This random fluctuation shows the existence of efficient market where the stock will quickly reflect all the available information about the stocks which makes the stock prices keep changing without following any pattern.
There are many theories which try to explain about the efficient market theory, but the most well-known came from Eugene F. Fama (1970). He defines the efficient market as a security market where the prices of the securities fully reflect all the information available. The term “fully reflect” used by Fama shows that, he emphasizes on the accuracy of the
security prices to reflect all the information available.
Fama (1970) also defined three levels of market efficiency. The first is weak form efficiency. In this form, the current stock prices reflect all the historical information about the firm in the public, including historical prices, trends of stock prices and old news. Because it only shows the information in the past, this capital market is efficiently weak. The second is semi-strong form market efficiency. In this form the prices do not only reflect the firm historical market information but it also reflects all other information available in the public such as the content of the financial reports, economic forecasts, firm announcements, and so forth. The last form is known as the strong form market efficiency. This is the highest level of the form market efficiency in which the prices of the stocks does not only reflect the information available in the public but also the information from the inside of the firm.
information, stock prices will quickly adjust in response to the arrival of random information makes the reward of analysis low. as the prices will always adjust to a new random information, hence, stock price analysis is not necessary, (2) prices reflect all available information, (3) price changes are independent of one another and move in a random fashion, all new information is independent to past information, therefore the past information cannot be used to help predicting the future price movement. According to Jones (2006) a capital market can be claimed as efficient if it can meet certain conditions, such as follow:
a. There are large numbers of rational, profit-maximizing investors who actively participate in the market; therefore an individual investor cannot influence stock prices.
b. All the information can be attained by all investors relatively in the same time without any cost or the information is costless, widely available, and generated in independently random fashion, so the investors cannot predict it before. The price will change if the new information is announced.
c. Investors fully and quickly react to new information. So, that the prices will adjust quickly as it reflects that new information.
2.1.4 The Form of Market Efficiency
a. Weak Form market Efficiency
The efficient market is labeled to be weak is when the current price of its securities only reflect past price information, including historical prices, trends of stock prices and old news. This weak form market efficiency supports the random walk theory. If the weak form market efficiency hypotheses fulfilled, it can be concluded that the prices of the stocks are independent to its past prices, so any movement of the stock will be in line with random walk theory. Random walk is statistic concepts which predict the future output will not be depend on the past output. So the output will be resulted in random or it does not have certain trend, because it is random so any output in the past will not influence and cannot be used to predict and analyze future output.
b. Semi-Strong Form Market Efficiency
Semi-strong efficient Market hypothesis is fulfilled when the price fully reflects all the public information. In Semi-strong form, investors cannot utilize all the information that has been announced to the public as their strategies to gain abnormal return. That Information are such as, the announcement profit, dividend, stock split, the development of new products, financial trouble and default, and so forth. It means that, all the information reflects all the information available, so there is no single private information possessed by a single individual which can be used as their strategies to gain abnormal return.
c. Strong Form Market Efficiency
reflect the information available in the public but also the information from the inside of the firm or private. In the strong form efficiency the price of the stocks will maintain its fair price and there is no individual or group of investors who can gain the abnormal return by using available public information.
2.1.5 The definition of Information in Capital market
Information is playing an important role in a capital market. It becomes a variable to measure the capital market reaction towards certain event (Jogiyanto:2003:352). The investors used all the relevant information and assimilate it into the stock prices to make buying and selling decision. Information also becomes one of two key factors in an efficient capital market. Jogiyanto (2003:363) stated that the efficient capital market is the relation between the stock prices and the information. Beaver (1989) in his definition about the market efficiency, he emphasized the efficient capital market on its the information distribution. According to UU No. 8 Tahun 1995 TentangPasar Modal pasal 1 ayat 4, Information or material fact is information or important facts about the events,
occurrences or the facts which can influence security prices in capital market or the decision of the investor, prospective investor or other parties which have the interest upon the information or the fact (Informasi atau fakta material adalah informasi atau fakta yang dapat mempengaruhi harga efek pada Bursa efek atau keputusan pemodal, calon
pemodal atau pihak lain yang berkepentingan atasi nformasi atau fakta tersebut). From
that the definition we can see that the importance of the information towards the stock prices and the decision of the investors in the capital market.
Furthermore, Fama In his publication of “Efficient Capital Market: A Review of
information which is the information available publicly, and 3) public and private Information which is information available both publicly and privately.
In an efficient capital market, the announcement of new information or events will quickly influence (1) trading activity, (2) variability of the prices and the return, and (3) stock prices. As the information will be quickly reflected into the stock prices, the announcement of good information can give significant changes to the stock prices which can generate good return as well; conversely the announcement of bad information will weaken the stock prices.
As the information is the important role in trading decision, hence investors have to be able to analyze which important information should be found to help them in making the trading decision. Sawidji (1997) defines that information should be:
a. People who run the company, management system and production technique. This is also called as fundamental information about the firm.
b. Financial Information. This information can be in the form of profit loss report, the ratios to measure the efficiency. Furthermore this information also can be achieved by comparing the company performance with other similar companies in the same industry.
c. Information about the situation or it is called psychology analysis. Information which is needed is the information which can influence the stocks traded in established exchanges, such as exchanges in US, Japan, Singapore and so forth.
2.1.6 Stock Return and Abnormal Return
actual return can be used to measure the company financial performance. This historical return is used to determine the expected return and the future risks (Jogiyanto: 2000). Another form of return is called expected return or the return that expected to be earned in the future. This expected return is forecasted based on the actual return historical data.
There is a positive relation between risks and return concept. Theoretically, if a certain stock has higher risk, it will give higher return and conversely if it is less risky, it will give less return. This risk and return concept is often shape the investors’
behavior in investment decision.
Abnormal return is the difference between the actual return and the expected return (Husnan, 2001). The positive abnormal return means that the capital gain earned is higher than they expected. Conversely, the negative abnormal return means that the return earned is less than what expected before.
2.1.7 Market Anomalies
Anomalies in the capital market exist because there are some deviations in capital market which contradicts the efficient market concept. Jones (1996) defines anomalies in capital market as techniques or strategies that contradict the concept of capital market efficiency and the causes are hardly to explain. The behavioral finance tries to explain this phenomenon as the result of investors’ bias behavior, emotion and
mood. Mood shows what character attached to the investors at that time (Wahyudi: 2008). According to John R. Nofsinger, social mood will also influence the mood of the investors. If the society is seen to be optimistic in social economic condition Overreaction hypothesis, the investors will be optimistic and have good mood. Conversely, if the society is pessimistic in their social economic life, this condition will also depress investors’ mood.
Another theory which tries to explain this phenomenon is overreaction hypothesis. Overreaction hypothesis is condition when investors’ reaction is not in a
line with the normal condition. According to overreaction hypothesis, in this condition the securities which classified as loser and use to give low return, will give high abnormal return (Sukmawati and Daniel, 2000). While the securities which classified as winner and use to give high return will give low abnormal return. This condition exists because investors over reaction in using a current information to forecast what will happen in the future. This hypothesis leans on the assumption that market will behave based on the last information to correct and improve their decision in the future. If the investors react based on that assumption, they will tend to be overreacting toward current information.
a. Calendar anomalies 1. Holiday Effect
The Holiday effect is the market anomaly in which exists when higher abnormal returns appear in the market before holidays (pre-holiday return) or after holidays (post-holiday returns) than the stock returns on weekdays or non-holidays (Brockman and Michayluk, 1998). Through a comprehensive analysis, it is found that that Holliday anomaly is distinct and independent or not affected by other anomalies (Lakonishok and Smidt, 1988).
Researches show that capital market performance on pre-holidays can be positively or negatively affected. The exchange will be positively affected if the prediction of stock movement will be better or the price of the index will be stronger in the future and will give them higher return in the future. This information will motivate investors to buy the stock on pre-holiday because; they might think they will lose their chance to earn higher return in the future if they do not buy the stock before holidays. On the other side the exchange will be negatively affected if the stock prices movement is predicted to drop after holiday.
One of the recent studies in Indonesia shows that holiday effect anomaly exist in U.S. capital market is not similar with holiday market exist in Indonesia capital market. The difference is on investors’ response
worry about the information is spread unevenly during pre-holiday which cause uncertainty. To eliminate the risks caused by the uncertainty, investors in Indonesia tend to sell their stocks during pre-holiday period which then force the stock price to drop.
2. The January Effect
January effect has shown that the returns of the stocks are significantly higher on January compare to other months. January effect is more profound on small companies stocks. The research from Rozzef and Kinney (1976) reveals that there is seasonal pattern in equal-weighted index of NYSE index in the period of 1904-1974. The study shows that the average return on January is about 3.5% while the on other month, the average return is only about 0.5%, but high abnormal return did find in big firms stocks. There are some causes which allow January effect appear in the capital market, such as:
a. Most of the investors sell degrading stocks to calculate their loss and to reduce taxes, then buy new stocks on January.
b. The price of the stock is depressed on December and then improves on January which then motivates investors to make buy decisions.
c. Some investors find out that, they might earn abnormal return, if they buy stocks on December and then sell it on January.
3. Monday Effect or The Weekend Effect
defined the Monday effect as the tendency for Monday stock returns to be low relative to other weekdays and on average negative. Unlike other calendar anomalies, on Monday effect, the return of the stock tend to be lower compare to returns on other weekdays. It happens because on Monday, investors are more will to sell their stocks then to buy them. The study from Maberly (1995) showed that financial practitioners has been aware about this issue since the 1920s, but until now, there is still no adequate review that can explain the presence of the negative returns on Monday.
b. Firm anomalies or Size effect
Firm anomaly is the anomaly which is related to size of the firm or it is known as size effect. Size effect is one of the capital anomalies which the size of the firm is responsible for the abnormal stock returns. In size effect small firms stocks tend to earn higher returns than big firms. The research from Banz (1981) finds that the size of market capitalization is significantly good in explaining the stock returns both in statistics and empirical data. The research reveals that small firm stocks in New York Stock Exchange (NYSE) gained higher risk-adjusted return than big firm stocks listed in NYSE. Moreover, Jones (2002) documented the research from Reinanum (1981) which finds that there is abnormally large-risk adjusted return for small firms.
c. Low Price Earning Ratio Effect
Price earning ratio (PER) is one of the ratios which can used to measure company’s performance. Price earning ratio has an inverse relation. Some of the
stocks with low PER proven that it gains positive excess return in any level of risks. This finding provides potential strategies for the investors to gain superior return from their investment.
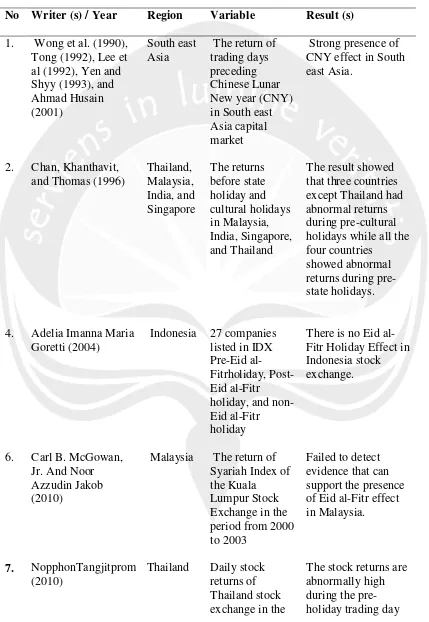
2.2Previous Research
Many prior researches have been conducted to find and provide the evidence of Holiday effect anomalies. Since the mid of 70s, the empirical studies to examine the anomalies, including holiday anomaly has been conducted. Fosback (1976) reported high pre-holiday return towards S&P 500. He used Dow Jones Industrial Average (DJIA) in period of 90 years which continued by Lakhonishok and Smidt (1988). From that comprehensive study they found that Holiday effect is the second most profound anomaly after January effect. The result also revealed that Pre-holiday return is 23 times larger than the average daily non-holiday returns and accounts for
approximately 50% of DJIA annual returns. Rogalski (1984) and Pettingil (1989) found that Pre-holiday returns are significantly different from non-holiday return and pre-holiday return are stronger for the smallest capitalization. Post-pre-holiday returns are varying by the day of the week as well as by each size. They used Daily data of both large and small capitalization portfolios from July 1962 to December 1986 as the sample of the research. Furthermore, by using data of Daily stock index return from the CRSP value-weighted and equally weighted portfolios from 1963 to1982, Ariel (1990) found that High pre-holiday returns occur only on the single day before the actual holiday.
period of 1994 to
Based on Literature review and previous research addressed before, therefore the Hypotheses built are:
1. Hypotheses which provide the evidence of Eid al-Fitr Holiday effect presence in JKSE return index during 2000 to 2013
H1 = There is a presence of Eid al-Fitr holiday effect in JKSE index return during 2000 to 2013
2. The second hypothesis is to provide the evidence that there is relation between firm size and holiday effect.