ANALYSIS ON LOCAL GOVERNMENT PERFORMANCE
THESIS
A thesis submitted in partial fulfillment of the requirement for the degree of Magister Sains
by
DINI WULANSARI
SRN : S4307060
FAKULTAS EKONOMI UNIVERSITAS SEBELAS MARET
ANALYSIS ON LOCAL GOVERNMENT PERFORMANCE
Arranged by : DINI WULANSARI
ANALYSIS ON LOCAL GOVERNMENT PERFORMANCE
By :
PRONOUNCEMENT
Name : Dini Wulansari
NIM : S4307060
Study Program : Master of Accounting Concentration : Public Sector Accounting
ACKNOWLEDGEMENT
Alhamdulillahirobbil’alamin, All praise is solely extended to the Almighty God, Allah SWT, for the entire blessing, grace, and strength that makes the writer can finish this thesis well.
However, the completion of this thesis would not be achieved without the assistance and encouragement from many individuals. Therefore, I hereby would like to express my gratitude to those who have given valuable contributions to the accomplishment of this challenging assignment. The writer wish to thank to:
1. Minister of National Education of Indonesian Republic, for the willingness to give grants in the form of scholarship “Beasiswa Unggulan Diknas” in order to complete the study in Master of Accounting Program, Faculty of Economic of Sebelas Maret University.
2. Prof. Dr. dr. H.M. Syamsulhadi, Sp.KJ (K), as the Rector of Sebelas Maret University.
3. Prof. Drs. Suranto, M.Sc., Ph.D., as the Post Graduate Director of Sebelas Maret University
4. Prof. Dr. Bambang Sutopo, M.Com.,Ak as the Dean of Economics Faculty of Sebelas Maret University, and as the main supervisor of this thesis, for all the critics and suggestion that helping the writer to achieve the best result.
6. Drs. Sri Hartoko, M.B.A., Ak, as the co supervisor of this thesis, for all of the patient guidance, wide tolerance, critics and advise that helping the writer to finish this thesis
7. My respectable parents, for all love, support, guidance, model and everything you have given to me, previously and in the future. Many thanks would never enough to represent my gratitude.
8. My beloved husband and my valuable baby, for the spirit and support. You are my next purpose of my life.
9. My sister and my brother, for shared laugh and tears. Hope we will still close to each other forever, although we won’t physically stay close anymore.
10. My lectures in the Master of Accounting Program. 11. My friends in the “International Class”.
12. All of the people and another party that cannot mention one by one, who have helped me, I thank you for all the great helps.
The writer realizes that this thesis is not perfect. For this reason, the writer ask for apologize for the imperfectly of this thesis. The writer wish to have the develop suggestion and critics to create the perfect creation.
Finally, the writer hopes that this thesis can be useful for all party in the next day.
Surakarta, May 28 , 2010 Regards,
TABLE OF CONTENTS
1. Government performance measurement ………... 2. Indonesian Fiscal Decentralization ………... 3. Local government own revenue (Pendapatan Asli Daerah-PAD) ….. 4. Local taxes ……… 5. Local retributions .……… 6. Economy growth ………... 7. Revenue Sharing ………... B. Hypothesis Development ………... 1. The relation between local tax and retribution toward independence
ratio ………... 2. The relation between economic growth and independence ratio …….. 3. The relation between revenue sharing and independence ratio ……… C. Conceptual Scheme ………. CHAPTER III : RESEARCH METHODOLOGY ……….. A. Research Method ……… B. Population and Sample ………... C. Data Collection ……….. D. Operational Definition and Variable Measures ………..
LIST OF TABLES
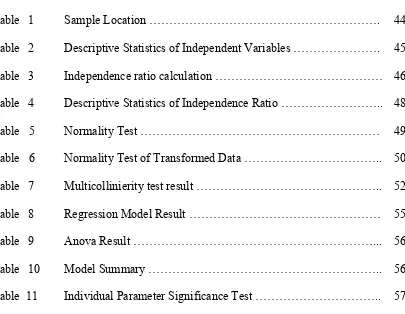
Table 1 Sample Location ……….
Table 2 Descriptive Statistics of Independent Variables ………. Table 3 Independence ratio calculation ……… Table 4 Descriptive Statistics of Independence Ratio ………..
Table 5 Normality Test ………
Table 6 Normality Test of Transformed Data ……….. Table 7 Multicollinierity test result ………..
Table 8 Regression Model Result ………
Table 9 Anova Result ………...
Table 10 Model Summary ………..
LIST OF FIGURES
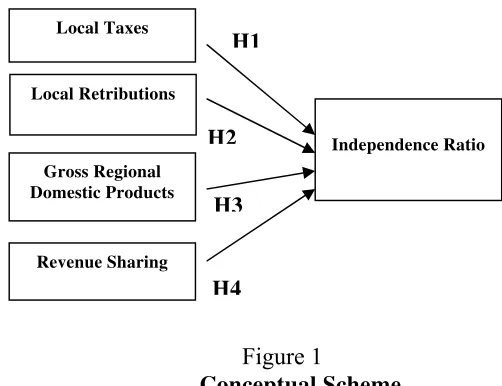
Figure 1 Conceptual Scheme ……….
Figure 2 Histogram Graphic of Dependent Variable: Independence ratio … Figure 3 Scatterplot Graphic ……….
LIST OF APPENDIXES
Appendix I Sample of Observation ……….
Appendix II Local Tax Data ……….
Appendix III Local Retribution Data ……….
Appendix IV PDRB Data ………...
Appendix V Revenue/ Budget Sharing Data ………
Appendix VI Normality Test ……….
Appendix VII Multicolinearity Test ……… Appendix VIII Heteroskedasticity Test ………
Appendix IX Model Summary ………...
Appendix X Anova Result and Coefficient ……….. Appendix XI Descriptive Statistics of Independent Variables ………..
ABBREVIATIONS
Abbreviations English Term Indonesian Term
APBN Central Government Budget Anggaran Pendapatan Belanja Negara
BHP Tax Sharing Bagi Hasil Pajak
BPHTB Land and Building
Acquisition Tax
Bea Perolehan Hak atas Tanah dan Bangunan
BPS Central Bureau of Statistics Biro Pusat Statistik DAK Specific Allocation Budget Dana Alokasi Khusus DAU General Allocation Budget Dana Alokasi Umum
DBH Budget/Revenue Sharing Dana Bagi Hasil
Counter Balance Budget Dana Perimbangan
DPRD Regional Parliament Dewan Perwakilan Rakyat
Daerah
Distric Kabupaten
Municipalities Kota
PBB Land and Building Tax Pajak Bumi dan Bangunan
PPh Salary Tax Pajak Penghasilan
Revenue Pendapatan
Abbreviations English Term Indonesian Term
GRDP Gross Regional Domestic Product
Pendapatan Daerah Regional Bruto (PDRB)
Earning Penerimaan
Defrayal Pembiayaan
PERDA Local Government Rules Peraturan Daerah
PP Central Government
Regulation
Peraturan Pemerintah
Budget Year Tahun Anggaran
UU Law Undang-undang
ABSTRACT
ANALYSIS ON LOCAL GOVERNMENT PERFORMANCE DINI WULANSARI
NIM: S4307060
This research aimed to identify variables that influenced local government' independence ratio. It tried to identify whether local tax, local retribution, economic growth and revenue sharing has an influence toward the local government independence ratio.
This study had a total population of 473 local governments in Indonesia, comprising 33 provinces and 440 cities/regencies during the period of 2005-2007. The data was obtained from secondary data taken from the Internet. Based on the purposive sampling method, 30 provinces were selected as samples. Previously, this research planned to use the whole 33 provinces in Indonesia as samples. However, in 2005, there were only 30 provinces that had complete data on their financial statements, so this research later only used the 30 provinces as the samples from 2005-2007 period. Provinces that had no complete data were: Banten, North Sulawesi, and North Maluku.
The analysis showed that local tax and local retribution had significant influences on the local government independence ratio. Meanwhile, another finding showed that economic growth and revenue sharing had no influences on the local government independence ratio.
ABSTRAKSI
ANALYSIS ON LOCAL GOVERNMENT PERFORMANCE DINI WULANSARI
NIM: S4307060
Penelitian ini bertujuan untuk mengidentifikasi variabel-variabel apa sajakah yang berpengaruh terhadap rasio kemandirian pemerintah daerah. Penelitian ini berusaha untuk mengetahui apakah variabel pajak daerah, retribusi daerah, pertumbuhan ekonomi, dan dana bagi hasil berpengaruh terhadap rasio kemandirian pemerintah daerah.
Populasi penelitian ini adalah 473 pemerintah daerah di Indonesia, yang terdiri dari 33 propinsi dan 440 kabupaten / kota pada periode tahun 2005 - 2007. Data diperoleh dari data sekunder melalui internet. Berdasarkan metode purposive sampling, maka dipilih 30 propinsi sebagai sampel. Awalnya, penelitian ini akan menggunakan seluruh 33 propinsi di Indonesia sebagai sampel, akan tetapi karena pada tahun 2005 hanya terdapat 30 propinsi yang memiliki data lengkap pada laporan keuangannya, maka penelitian ini kemudian hanya mengambil 30 propinsi sebagai sampel. Propinsi yang tidak memiliki data lengkap adalah: Banten, Sulawesi Utara, dan Maluku Utara.
Hasil penelitian menunjukkan bahwa pajak daerah dan retribusi daerah memiliki pengaruh yang signifikan terhadap rasio kemandirian pemerintah daerah. Sedangkan variabel pertumbuhan ekonomi dan variabel dana bagi hasil tidak berpengaruh terhadap rasio kemandirian pemerintah daerah.
CHAPTER I INTRODUCTION
A. Research Background
Public sector reforms are occurring throughout the world in an effort to improve the efficiency, effectiveness, responsiveness and accountability of the public service (Pilcher 2005). Local government reform, as a subset of the overall reform process, has been implemented in an attempt to increase transparency of those agencies empowered with providing essential services to communities.
In the area of government institutions, performance measurements which developed in systematic and continual manner, aim to create a more useful, productive, clean, and responsible government to conduct their duty (LAN 2003). Through these performance measurements, base for reasonable decision making might be developed and be accountable so that the strong information support will create the accuracy of decision making (Bastian 2006). Thereby, coming up expectation that performance information system implementation may help to improve the government performance in transparently establish their public service goal and objective, efficiency, and affectivity; resource allocation and decision making; and to create public responsibility and organizational communication improvement (Mardiasmo 2004).
Regional autonomy applicable in Indonesia under Law 22/1999 (revised into Law 32 year 2004 and then Law 12 year 2008) on Local Government, strictly separates between the function of Local Government (Executive) with the functions of the Regional Parliament - DPRD (Legislative). On the division of these functions, the legislature elects and dismisses the head region. This shows that among the legislative and executive, agency relationships do occur (Halim & Abdullah, 2006). In governance, legislation is a form of implicit contract between the executive, legislative, and public (Darwanto and Yustikasari 2007).
Many relationship involve the delegation of decision making from one party (the principal) to another party (the agent) – this referred to as an agency
relationship (Deegan 2004). Jensen and Meckling defined the agency relationship (1976 in Deegan 2004) as: A contract under which one or more principals (engage) another person (the agent) to perform some service on their behalf which involves delegating some decision-making authority to the agent.
In the agency relationship between executive and legislative, executive act as the agent while legislative are the principals (Halim & Abdullah 2006). Agency theory analyzed contractual formation between two or more individual, groups or organization. One parties (principal) made certain contracts, whether implicit or explicit, with other parties (agent), expects that agent will act / conduct certain duty as the principals wished (Darwanto and Yustikasari 2007). To implement certain contracts, measurements are needed as performance benchmark, where usually recognize as performance measurement. In the area of government institutions, performance measurement which developed in systematic and continual manner, aimed to create a more useful, productive, clean, and responsible government to conduct their duty (LAN 2003). There are many ways to measure government performances, one of them is by using independence ratio. Local government independence ratio shows local government ability in finance their governing activity, infrastructure development, and public service. Moreover, this independence ratio is believed formed from local tax, local retribution, economic growth, and revenue sharing.
so that the citizen and legislative committee can assess the government’s performance whether the government operates their job in an economic, efficient and effective ways. To get precise measurement, proper benchmark is needed. It is important to identify what variables that influenced the measurement tool.
In relation with the previous matter, it would be so relevant if a research developed in this matter to find out about local government performance. The research focused on financial independence ratio as measurement for the local government performance, especially on the aspects that affecting them.
This research conducted to find out what variables that able to support the form of local government independence ratio as reflection of local government independence. Haryanto (2006) had used some variables in his study to find out what variables which support the form of fiscal capacity, which used as reflection of local government independence. He classified some variables as: local tax, local retribution, economic growth, and revenue sharing. This study use the same variables as Haryanto’s study since this study also focus on to find out the variables which form local government independence. However, this study use local government independence ratio instead of fiscal capacity as reflection of local government independence.
Based on described background above, than appear such question in this research: What variable(s) affect the creation of local government independence? Furthermore we may formulate this question in to some points below:
1. Does local tax influence the local government independence ratio?
2. Does local retribution influence the local government independence ratio? 3. Does economic growth influence the local government independence ratio? 4. Does revenue sharing influence the local government independence ratio?
C. Research Objectives The objectives of this research are described below:
1. To identify whether local tax has influence in the local government Independence Ratio.
2. To identify whether local retribution has influence in the local government Independence Ratio.
3. To identify whether economic growth has influence in the local government Independence Ratio.
4. To identify whether revenue sharing has influence in the local government Independence Ratio.
D. Research Advantages
literature. Hopefully the result of the research can be used as reference to the next research.
The research is expected to give contribution to:
1. Provide input to the government in conduct policy making, in the era of autonomy.
2. Provide feedback about whether the real variables affect the local government independence.
CHAPTER II
LITERATURE REVIEW AND HYPOTHESIS DEVELOPMENT
E. Literature Review
parties and the parties which have formal power toward those power controlled parties (Sadjiarto 2000).
Performance measurements promote accountability to stakeholders, particularly in government organizations. There is a great deal of literature on performance measurements in government, and governments around the world have made large investments to develop performance measurement systems frequently related to notions of accountability. So far, the results of these investments seem mediocre at best (Pollitt 1995 and Atkinson et al. 1997 in Kloot 1999). A crucial feature of performance measurement arrangements are the coupling of performance informations to decision making. Decisions can be of two types; planning or accountability and control. Planning decisions are about future action, while accountability and control decisions settle on the consequences of past performance (Dooren et all2008).
Accountability is an obligation to answer for the execution of one’s assigned responsibilities. In simpler terms, accountability is reporting. People account, or report, to other people. Therefore, it is useful to consider accountability in context of the relationships between the people or organizations involved. Effective accountability means that those managing public resources depend on sound information, not speculation, when determining the effectiveness of Government’s programs. This information can take many forms, from the simple to the complex. The test of what is needed is what is useful to decision makers (Auditor General Alberta 1997).
Accountability to both central government and the local community are measured by financial and non-financial performance measures. Performance measures also have a significant role in managerial or internal control, in ensuring that organizations are managed in the best interests of all stakeholders. Performance measurements are thus important for both external and internal accountability.
1. Government performance measurement
Public sector reforms are occurring throughout the world in an effort to improve the efficiency, effectiveness, responsiveness and accountability of the public service. Local government reform, as a subset of the overall reform process, has been implemented in an attempt to increase transparency of those agencies empowered with providing essential services to our communities (Pilcher 2005).
accountability mechanism, we need: a performance management with performance indicators and targets, performance report, and reward and punishment mechanism. Good performance indicators have characteristics such as: relevant, unambiguous, cost-effective, and simple; and also act as signal or alarm which showed that there were problems which need management action and continue investigation.
From an internal control perspective, performance measurement systems are designed to monitor the implementation of an organization’s plans and determine when the plans are unsuccessful and how to improve them. They used to put attention on the organization’s objectives, to measure and report performance and to understand how process performance affects organizational learning. Identified operational problems, which can be solved by adjust existed processes, and indicated more fundamental problems, which require an adjustment to the strategies of the organization, are further uses of performance measurements. Performance measurement also promotes accountability to stakeholders, particularly in government organizations. There are great deals of literature on performance measurement in government, and governments around the world have made large investments to develop performance measurement systems, frequently related to notions of accountability. So far, the results of these investments seem mediocre at best (Kloot 1999).
1. Performance measurements enhance the value of decision making.
Oftentimes the decision made by the government conducted in limited data, with many politics considerations, and also pressures from many concerned parties. These processes of performance measurement developments will enable the government to determine mission and establish the purpose of certain result achievement. Different performance measurement method may measure a program from some different view. Beside that, the existences of performance measurement made the legislative able to put attention on reached result, give proper evaluation on budget implementation, and doing discussion on new programs proposals.
2. Performance measurement increase internal accountability
The existence of performance measurements will automatically create accountability in all government line, from lowest until highest line. In these matter suggested to use standard measure system such as management by objectives to measure outputs and outcomes.
3. Performance measurement increase public accountability
4. Performance measurement support the strategic planning and decision making.
Strategic planning and objective process will decrease without the existence of certain ability to measure a program performance and progress. Without these measurements, the success of a program will never be objectively measured.
5. Performance measurements enable an entity to determine the use of resources effectively.
Nowadays the communities are getting critical in measure government main programs due to the raise of taxes liable to them. Implemented evaluation is tend to the assessment whether government able to provide the best service for the communities. In this matter, the government also has opportunities to hand over some public services to private sectors, with main purpose to provide the best services.
In the private sector, objectives are measured essentially in terms of profit, market share and return on equity and assets, and are mostly reported in financial terms. They constitute the benchmark against which a business was measured. In the public sector, financial reports are also prepared. However, given that the objectives for government programs frequently are stated in non-financial terms and the nature and complex array of government activities, conventional financial reporting mechanisms may not easily capture performance measurement (Guthrie and English 1997).
There are many ways to measure government accountability, one of them is by using financial ratio. Furthermore, there are some financial ratio that might use to measure the local government accountability, they are financial independence ratio, effectiveness ratio, efficiency ratio, compatibility ratio, growth ratio (shift analysis), local government revenue and expenditure proportion ratio (share analysis) (Halim 2007). This study will only focus on independence ratio.
Local government independence ratio shows local government ability in finance their own governing activity, infrastructure development, and public service.
This ratio can be formulated as below (Halim 2002):
Based on above formula we will find that Independence ratio describes how far the local government dependency toward external funding sources. The higher the ratio means that local government dependency level toward external parties (especially central government) is lower, vice versa. This ratio also describes community participation level in their regional development. The higher the ratio means that the higher community participation in pay tax and retribution, which part of own revenue (PAD) component.
2. Indonesian Fiscal Decentralization
Before addressing decentralization, it helps to notice the structure of sub national governments in the country. Indonesia has multi-levels sub-national administration. Directly under the central government is the provinces including two ad hoc sub-national institutional arrangements, namely Special Regions (Daerah Istimewa, or DI) and the Capital (Jakarta). The lower level under province is regional governments of kota (municipallities) and kabupaten
(distric). The distinction is mainly based on the region’s nature. Kota is refer to an urban area, while kabupaten to rural one. Both Kota and Kabupatencomprise sub-regional level of administration i.e. kecamatan, which further consists of
desa or kelurahan. Again, the distinction is solely based on rural (desa) or urban (kelurahan) characteristic of the region (Harmadi and Iswandono 2007).
local government performance enhancement to maximize local resources is expected to force the development of each local government so that community wealth will be increased. Related policy is regulated in UU No. 22 year 1999 about Local Government and UU No 25 year 1999 about Financial counter balance between Central and Local Government, when these policy than corrected with the implementation of UU No.32 year 2004 and UU No. 33 year 2004 (complemented with UU no 12 year 2008 and UU No.28 year 2009). The implementations of these policies give local government an opportunity to maximize their local potency and increase their financial performance in order to be an independent local government.
The philosophy of local government autonomy is to implement independence in every aspect of their life, which measured by own local revenue (Pendapatan Asli Daerah –PAD) element. With the authority found from the implementation of autonomy, it is expected that all regional in Indonesia able to finance their own governmental activity and construction with their own local revenue (PAD).
on fair and proper principles. Local government as executor party in conducting government matter, development, and public services is obliged to deliver their financial responsibility report to be valued whether they succeed or not in implement their duties. One of many tool to assess the local government performance in manage their finance is by using financial ratio analysis toward Local Government Budget (APBD).
The centerpiece for the new fiscal decentralization institutions in Indonesia is the new system of transfers comprising revenue sharing of natural resources, personal income tax and property taxes, the DAU (Dana Alokasi Umum), a large unconditional grant intended to fund sub-national governments in an equalizing manner, and the DAK (Dana Alokasi Khusus), a set of yet to-be-developed conditional grants (Brodjonegoro and Vasquez 2002).
3. Local government own revenue (Pendapatan Asli Daerah-PAD)
Based on UU No. 33 year 2004, local government revenue to implement decentralization consists of local government earning and defrayal.
a. Local government earning consists of:
(1) Local own revenue (PAD), developed based on: i) Local tax
ii) Local retribution
(2) Counter balance budget (dana perimbangan) (3) Others revenues
b. Local government defrayal consists of:
(1) SiLPA (sisa lebih perhitungan anggaran Daerah) (2) Earning from government loan
(3) Back up fund
(4) Separated fund from the sale of local government assets Managing Local Revenue
The success of local revenue generation is closed related to the management of local revenue in the region. Basically, there are five major categories of local tax policies that could be implemented by local government (Mahi 2002). Those categories include:
a. Enlarging local revenue base
One of the ways to improve revenue performance is by enlarging local revenue base. There are four types of action that should have been taken by local authorities in order to achieve that. They are:
(1). Identifying new or potential taxpayers and ratepayers. (2). Improving object databases.
Three aspects are considered important to enhance revenue collection process: (1) optimum rate structure; (2) appropriate rules and regulations – in the form of good regulations (PERDA); (3) human resource capacity.
c. Increasing control to reduce leakage
To reduce revenue leakage, local government may perform some or all of the following actions:
(1). Surprise audit to complement self-assessment procedure (2). Improving the control process
(3). Efforts to enforce a strict and heavy penalty for non-compliance (4). Administrative discipline to financial staffs that may have
contributed to leakage in local revenues.
(5). Efforts to link tax payment with services provided by local government.
d. Improving administrative efficiency to reduce collection costs
Improvement in revenue performance is also critically dependent upon the ability of local authorities to minimize the cost of collecting revenues. here are four possible actions could be taken by local government to improve their administrative efficiency:
(1). Improving the existing tax administration procedures through administrative simplification.
(3). Efforts to reduce cost of collection.
(4). Efforts to eliminate the identified factors in the field that has contributed to suboptimal revenue.
e. Revenue capacity improvement through better planning
There often a situation whereby “Dispenda”, “Bappeda”, and “Bagian Keuangan” do not work together in order to improve the existing revenue planning system. In fact, in such a crisis it is important for them to ensure a good revenue planning strategy. In the absence of coordinated and systematic planning, it is difficult to expect local revenue to increase.
4. Local taxes
According to UU No 28 Year 2009, local tax is obligatory contribution toward local government, indebted by personal individual or organization, that have forcibly characteristics based on law, with no direct reward, which used for local government needs to gain community prosperity.
Local taxes consist of:
a. Taxes on province level, they are: (1) Vehicle tax
(2) Vehicle ownership transfer tax (3) Vehicle fuel tax
b. Taxes of district/municipalities level, they are: (1) Hotel tax
(2) Restaurant tax (3) Advertisement tax (4) Public lightning tax
(5) Non-metal and stone minerals tax (6) Parking tax
(7) Ground water tax (8) Tax on swallow net (9) Land and Building Tax
(10) Land and Building Acquisition Tax
5. Local retributions
Local retribution is local government duty as payment for service or certain given permission, that personally allocable and/or given by local government for personal or organization need (UU No 28 Year 2009).
Retribution objects consist of (UU No 28 Year 2009): a. General Services Retribution
The object of general services retribution is services provided or given by local government for the purpose of public objective and use, benefited to personal or organization need.
(1) Health services retribution (2) Cleaning services retribution
(3) Retribution to exchange the expense of Kartu Tanda Penduduk (KTP or ID card) andAkta Catatan Sipil(official document)
(4) Funeral and incineration services retribution (5) Sidewalk parking services retribution
(6) Market services retribution
(7) Vehicle testing services retribution (8) Fire extinguisher inspection retribution
(9) Retribution to exchange the expense of map printing (10) Supplying and/or suction water closet retribution (11) Liquid waste processing retribution
(12) Standardization/ re-standardization (tera ulang)services retribution (13) Education services retribution
(14) Communication tower control retribution b. Corporate Services
The object of corporate services retribution is commercial services provided by local government, which include:
(1) Services which use the benefit of local government un-maximized asset.
Corporate Services Retribution consists of:
(1) The consumption of local government asset retribution (2) Wholesaler market and/or stores retribution
(3) Auction area retribution (4) Terminal retribution
(5) Specific parking area retribution (6) Hotel/motel/villa retribution (7) Slaughtering house retribution (8) Harbor services retribution
(9) Recreation and sport place retribution (10) Water crossing retribution
(11) Local production sale retribution c. Certain License
The object of certain license retribution is certain permission services by local government to personal or organizational need, intended to regulate and control the activity on space exploitation, natural resources use, commodity, infrastructure, or certain facilities to protect public interest and to protect environment continuity.
Certain license retribution consists of:
(1) Permission on building development retribution
(4) Route permission retribution
(5) Fishery business permission retribution
6. Economy Growth
One important economy indicator to measure the performance of a particular area in economic growth is Produk Domestik Regional Bruto (PDRB or Gross Domestic Regional Product – GDRP – in English term). PDRB is important indicator in one area which able to indicate the net production of goods/services, which in the next step might use as basis for area development planning and evaluation.
Economy growth affected by some important factors as below (Arsyad 1999):
a. Capital accumulation
Capital accumulation including all new investment in the form of: land, fiscal equipments and human resources. Capital accumulation would happened if there is part of shares from revenue spent invested to increase the output in the future. Capital accumulation will increase both new and existed resources.
b. Population growth
ability to stimulate economy growth depend on prevail economy system ability in absorb and employ the available manpower productively.
c. Technology progress
According to economics, technology progress is the most important factor in economy growth. In its simplest form, technology progress caused by modified old and new way in conduct traditional works.
There are six characteristics of economy growth process, as below (Kuznets in Todaro 1999):
(i)high development of output per capita and community growth level, (ii) high development of productivity factor, especially on manpower productivity, (iii) high level of economy structural transformation, (iv) high level of social and ideology transformation, (v) there do exist a trend for developing or developed regions, which try to expanse their area for marketing and raw material resources purpose, and (vi) there exists an economic growth limitation, which only involve one third of world community.
7. Revenue sharing
Revenue Sharing (Dana Bagi Hasil-DBH) is specific budget come from APBN (Anggaran Pendapatan Belanja Negara) revenue, which allocated to local government based on certain percentage number, to finance local government needs in implement decentralization (UU No.33 Year 2004). Budget Sharing (Dana Bagi Hasil-DBH) itself come from tax and natural resources.
important political issue of redressing perceived past injustices toward natural resource-endowed regions. But revenue sharing can also be a source of problems. The most serious is that of increasing fiscal disparities (Brodjonegoro and Vasquez 2002). However, this is a problem that can be addressed through equalization transfers.
Revenue sharing (DBH) from the revenue of PBB and BPHTB as mentioned in chapter 11 UU 33 year 2004, divided for province level, district/municipalities level, and central government. Revenue sharing (DBH) from 90% revenue of PBB for local government, divided with details as bellow:
a. 16,2% (sixteen point two percent) for pertinent province area.
b. 64,8% (sixty four point eight percent) for pertinent district/municipalities area.
c. 9 %(nine percent) for collection fee.
While 10% of central government part of shares from PBB revenue, split to all district/municipalities based on present budgetary year of PBB revenue realization, with details as below:
a. 65% (sixty five percents) equally split to all district/municipalities
b. 35% (thirty five percents) gave to district/municipalities which previous year revenue realizations of PBB reach/exceed the revenue planning. Eighty percents (80%) DBH from BPHTB revenue splits with details as below:
b. 64% (sixty four percent) split to all BPHTB producer districts/municipalities.
While 20% (twenty percents) of governments part of shares from BPHTB revenue, equally split to all district/municipalities.
F. Hypothesis Development
1. The relation between local tax and retribution toward independence ratio Local revenue (PAD) consists of Local Tax, Local retribution, revenue from local government owned company, and other legal local revenue, as expressly stated in Article 79 letter a of Law Number 22 Year 1999 on Local Government. Even though consist of four different sources, until now only Local Tax and retribution which give significant contribution toward the total of local government revenue (PAD), while other sources have not (Haryanto 2006).
Another important source of PAD is local retribution. Local retribution is a levy income conducted by a local government in lieu of services rendered to the parties who require, both individuals and institutions. The percentage of local retribution component is usually larger than the percentage of local tax component.
The differentiation between retribution and local tax is that retribution collections are based on the contra given by local governments, which are not determined limitedly as local taxes. The main thing that limits the imposition of retribution by local governments is the availability of a service by local governments. Local government will always be able to collect retribution as long as they able to provide the services and is allowed by the higher levels of government.
Regional taxes and retribution are one source of financing that is owned by local governments and included in local revenue (PAD). Local own revenue (PAD) can be defined as revenue earned by local government level, were gained by the local government from their own economic resources in their area. Theoretically, the PAD is a real contribution given by the local community to support the autonomous status given to him.
Riduansyah (2001) stated that the contribution of local retribution revenue toward Bogor municipalities’ own revenue (PAD) on budget year 1993/1994-2000 is quite significant with average contribution of 47.58% per year and average growth of 5.08% per year.
From these local tax and retribution sectors, expected that they will form strong PAD structures for each of local autonomy. Specifically, this strong PAD structure act as main benchmark in the successful implementation of local government autonomy, to support the existence of local government independence.
Regional financial independence (fiscal autonomy) is local government’ ability to fund their own governance activities, development, and services to the community who paid taxes and retribution.
Independence ratio describes the dependence of local government toward external funding sources. The higher the ratio of independence implies that the level of local dependence on external assistance (especially the central and provincial government) was getting low, and vice versa. Independence ratio also indicates the level of community participation in local development. The higher the ratio of independence, the higher of community participation on pay taxes and retributions, which are components of the PAD. The higher the society to pay taxes and retributions, it illustrate the higher level of community welfare.
from other sources, such as central government support or from borrowing. Since independence ratio is partly developed based on PAD value, therefore the first and second hypotheses are formulated as follows:
Hypothesis 1 (H1) = Local Taxes influence the local government independence ratio.
Hypothesis 2 (H2) = Local Retributions influence the local government independence ratio.
2. The relation between economic growth and independence ratio
Gross Domestic Product (GDP-Produk Domestik Bruto) is one of the macro-economic indicators which are generally used to measure macro-economic performance in a country. While for the district, provincial, and regency / city level, usually used the Gross Regional Domestic Product (GRDP- Produk Domestik Regional Bruto). Theoretically can be explained that the GDP is part of GRDP, and thus the changes that occur at the regional level will affect the GDP or vice versa.
Therefore, the amount of GDP generated by each province relies heavily on natural resources and production factors of a particular area. The limitations in the provision of these factors cause the varied amounts of GDP between regions.
One major purpose of fiscal decentralization is the implementation of local government independence. Local government expected to be able to gain local financial revenue, especially from local own revenue (PAD) (Sidik 2002 in Adi 2006). The increase of PAD actually is as result of economy growth. Local area with positive economy growth will have high possibility in PAD rise (Adi 2006). PAD growth should be sensitive to Gross Domestic Regional Revenue (Pendapatan Domestik Regional Bruto– PDRB) growth. Bappenas research (2003) show that PAD elasticity analysis toward PDRB conduct in province level show there are 12 province (41,37%) have elasticity value ≥ 1 (higher than one). This result showed that every change in PDRB explaining economy growth will give positive and significant impact toward PAD change.
Economy growth (in the context of local area) can be calculated with the formula below (Kuncoro 2004; in Adi 2006):
Level of Economy Growth = (PDRBt – PDRB t-1)
PDRB
t-1 x 100 %
Explanation:
PDRBt = Produk Domestik Regional Bruto on year t
Industrial sectors, especially services, need to be optimized. Taxes and retribution (as the largest component of the PAD) is highly related to the activities of the industrial sector. Taxes and retribution is actually the excess / more optimal value of this industry sector (Kadjatmiko and Mahi in Sidik et all, 2002). In other words, the domestic growth of this sector can be used to estimate the magnitude of PAD (tax and retribution) that will be accepted.
Generally, GDP per capita can be assumed to be a good indicator of revenue raising capacity (Blöchliger and Charbit 2008). Adi research (2006) find that economy growth have significant impact toward PAD growth.
Local government independence ratio shows local government ability in finance their own govern and development activities. Local financial independence ratio explained by the comparison between local own revenue (PAD) toward local revenues that come from other sources, such as central government grant or from loan (Widodo 2005). Since independence ratio is partly developed based on PAD value, therefore the third hypothesis is formulated as follows:
Hypothesis 3 (H3) = PDRB influence the local government independence ratio.
3. The relation between revenue sharing and independence ratio
balance Budget (Dana Perimbangan), and other legal resources. While chapter 10 Law number 33 year 2004 explain that Counter balance Budget consist of Revenue Sharing (Dana Bagi Hasil-DBH), General Allocation Budget (Dana Alokasi Umum-DAU), and Specific Allocation Budget (Dana Alokasi Khusus-DAK). Budget/ Revenue Sharing (Dana Bagi Hasil-DBH) itself come from tax and natural resources. Budget sharing (DBH) which come from tax resources consist of Land and Building Tax (Pajak Bumi dan Bangunan-PBB), Land and Building Acquisition Tax (Bea Perolehan Hak atas Tanah dan Bangunan-BPHTB), Salary Tax (Pajak Penghasilan-PPh) chapter 25 dan chapter 29 for individual local taxpayer and PPh chapter 21.
Hypothesis 4 (H4) : Revenue Sharing influences the local government independence between independent variables (local taxes, local retributions, GRDP, and revenue sharing) toward the dependent variable (Independence Ratio).
Regional taxes and retributions are some source of financing owned by local governments and included in local revenue (PAD). Local own revenue (PAD) can be defined as revenue earned by local government level, gained by the local government from their own economic resources in their area. Theoretically, the PAD is a real contribution given by the local community to support the autonomous status given to
him. From these local taxes and retributions sectors, expected that they will form strong PAD structures for each of local autonomy. Specifically, this strong PAD structures act as main benchmark in the successful implementation of local government autonomy, to support the existence of local government independence.
PDRB are reflection of certain area potency and economy activities, which measure based on total output of gross production in certain area (UU No.33 Year 2004). One major purpose of fiscal decentralization is the implementation of local government independence. Local government expected to be able to gain local financial revenue, especially from local own revenue (PAD) (Sidik 2002 in Adi 2006). The increase of PAD actually is as result of economy growth. Local area with positive economy growth will have high possibility in PAD rise (Adi 2006).
Budget sharing is local government rights toward state revenue resources, which produced from their own local government area, which percentage sharing stated by law (Romdhony 2006). Although budget/ revenue sharing is fund which come from central government, but the amounts are directly depend on each local government capacity. So that we may say that budget sharing value have direct affect on local government independence level.
higher community participation on pay taxes and retributions, which are components of the PAD.
The local government independence ratio (Halim 2007) is indicated by the size of the own local revenue (PAD) compared with regional income derived from other sources, such as central government support or from borrowing. Since independence ratio is partly developed based on PAD value, therefore we may say that local taxes, local retributions, GRDP and revenue sharing influence the independence ratio.
Hypothesis testing were done by using multiple regression analysis, aimed to predict the strength of how the influence of independent variables (local taxes, local retributions, GRDP, and revenue sharing) toward the dependent variable (Independence Ratio).
CHAPTER III RESEARCH METHOD
This research was developed by hypotheses testing approach. Studies that engage in hypotheses testing usually explain the nature of certain relationships, or establish the differences among groups or the independence of two or more factors in a situation (Sekaran 2000). This research is an empirical research to test the effect of chosen variables toward local government independence ratio.
The chosen variables are local taxes, local retributions, PDRB, and revenue sharing, which believed in first stage as proxy variables that able to reflect the local government independence.
The data taken consisted of secondary data published and provided within Badan Pemeriksa Keuangan Republik Indonesia (BPK RI), Balai Pusat Statistik (BPS), Direktorat Jenderal Perimbangan Keuangan (DJPK), and local government website. Financial statements were taken from www.bpk.go.id , number of local government were taken from BPS website, and the data of PDRB were taken from Direktorat Jenderal Perimbangan Keuangan website, which is
www.djpk.depkeu.go.id.
The researcher focuses on the provinces financial statement of year 2005 – 2007. This research can be classified as a data pooling research because the data taken was combination of throughout time (three years period) data and cross-section data for several research objects.
B. Population and Sample
The population is all local governments in Indonesia. Indonesia has 33 provinces and 440 regencies/cities (Bappenas 2007). This research used
purposive sampling technique for sample collection. The researcher took 30 provinces as sample. The provinces data taken as sample for the representation of provinces, districts, and municipalities.
C. Data Collection
Data used in this study were secondary ones which were taken from internet. The data included in financial statements were taken in www.bpk.go.id, numbers of local government in Indonesia were taken from www.bps.go.id, and the data of PDRB were taken from www.djpk.depkeu.go.id.The secondary data taken included:
1. Financial statements in 2005 – 2007 based on Pernyataan Standar Akuntansi Pemerintah (PSAP) Number 1 about Government Financial Statement Report. Consist of :
i. PAD (own government revenue) data.
ii. Central Government Grant and loan (DAU, DAK, other legal revenues, and central government loan and grant) data.
iii. Local tax data.
iv. Local retribution data. v. Revenue sharing data.
2. Number of local government in Indonesia.
The data were gathered by the researcher through softcopy data basis from the internet and the document.
D. Operational Definition and Variable Measures 1. Independent variable
Independent variable according to Sekaran (2000) is one of the variables that influence variable dependent, it can influence positively and negatively. The independent variables used in this research are:
i. Local Tax
Haryanto (2006) stated that Local Taxes variables significantly and positively affect PAD (Local Own revenue). A research conducted by Astabrata (2002) also stated similar finding that there is a positive and significant influence between the PHR (restaurant hotel tax - part of local tax) with PAD from year 1985 to 2000. This study use independence ratio where one of the forming aspects was PAD, therefore the local tax was used in this research.
ii. Local Retribution
Riduansyah (2001) stated that the contribution of local retribution revenue toward Bogor municipalities’ own revenue (PAD) on budget year 1993/1994-2000 is quite significant with average contribution of 47.58% per year and average growth of 5.08% per year.
Local retribution is local government duty as payment for service or certain given permission, that personally allocable and/or given by local government for personal or organization need (UU No 28 Year 2009). The local retribution value used in this research was taken directly from local government financial statement.
iii. PDRB (Produk Domestik Regional Bruto – Gross Regional Domestic Product)
Local area with positive economy growth will have high possibility in PAD rise (Adi 2006). PAD growth should be sensitive to Gross Domestic Regional Revenue (Pendapatan Domestik Regional Bruto – PDRB) growth. Bappenas research (2003) show that PAD elasticity analysis toward PDRB conducted in province level show that there are 12 province (41,37%) have elasticity value ≥ 1 (higher than one). This result showed that every change in PDRB explaining economy growth will give positive and significant impact toward PAD change.
(UU No.33 Year 2004). The PDRB data were taken from Direktorat Jenderal Perimbangan Keuangan website, which is
www.djpk.depkeu.go.id.
iv. Revenue sharing
Revenue sharing has significant relation toward local government fiscal capacity (Haryanto 2006). Haryanto use PAD (local own revenue) as further explanation for his understanding on fiscal capacity. This study use independence ratio where one of the forming aspects was PAD, therefore the revenue sharing is relevant to be used in this research.
Revenue Sharing (Dana Bagi Hasil-DBH) is specific budget come from APBN (Anggaran Pendapatan Belanja Negara) revenue, which allocated to local government based on certain percentage number, to finance local government needs in implement decentralization (UU No.33 Year 2004). Budget Sharing (Dana Bagi Hasil-DBH) itself come from tax and natural resources. The revenue/ budget sharing value used in this research were taken directly from local government financial statement.
2. Dependent variable
government ability in finance their own governing activity, infrastructure development, and public service (Halim 2007).
Based on above formula we will find that Independence ratio describes how far the local government dependency toward external funding sources. The higher the ratio means that local government dependency level toward external parties (especially central government) is lower, vice versa. This ratio also describes community participation level in their regional development. The higher the ratio means that the higher community participation in pay tax and retribution, which part of own revenue (PAD) component.
E. Analysis Technique
This research will use multivariate regression analysis. Multivariate regression analysis is used when there are two or more dependent variables exist in the model . The testing conducted by using program aid of SPSS 15. Data analysis conducted with some step as below:
a. Descriptive Analysis
Descriptive statistics consists of the measurements of mean, median, standard deviation, maximum, and minimum value of each data sample. This analysis uses to give a clear picture of concerning distribution of the data sample.
Own Government Revenue
b. Classic Assumption test, consist of : 1) Normality test
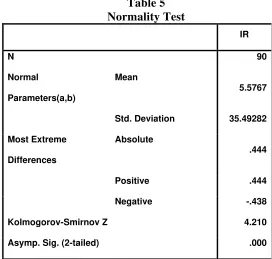
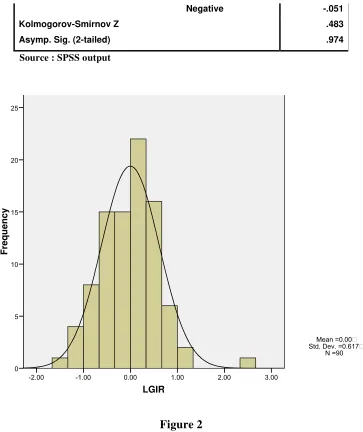
The purpose of normality test was to know whether or not residual has a normal distribution in the regression model (Ghozali 2005). One of statistical test that can be used to detect normality is One-Sample Kolmogorov-Smirnorv (Ghozali 2005). Criteria of normality are using p-value with the significance level of 5%. The data will normally distributed if the p-value is > 0,05 (Jogiyanto 2005).
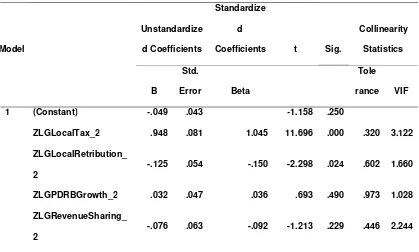
2) Multicollinierity test
The goal of multicollinierity test is to test whether the regression model have correlation between the independent variables. Good regression model must not have correlation between the independent variables. Multicollinierity in a model may seen from some points (Nugroho 2005):
i) If Variance Inflation Factor (VIF) value do not higher than 10 and Tolerance value do not less than 0,1 , we may say that the model is free from multicollinierity.
iii) If coefficient determinant value, whether R² or R-Square above 0.60, but there no independent variables had an effect on dependent variables, than we may say that the model have multicollinierity.
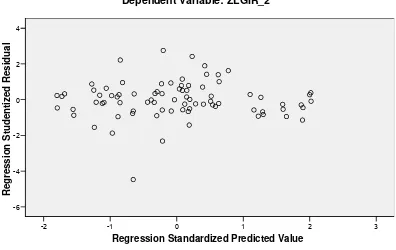
3) Heteroskedasticity test
Heterodicity shows that variable variation is not same to all observation. If the dots are randomly spread above and below zero point on Y line, it means that that the heterodicity does not happen in the model. Then, the regression model is available to be used in predicting independent variables. The Scatter plot graph will show that if the dots randomly spread above and below zero point of the Y line, heteroskedasticity does not happen in regression model (Ghozali 2006).
c. Hypothesis testing: Multiple Regression Test
The hypothesis testing in this research uses multiple regression tests. Data analysis used program: SPSS 15. Hypothesis testing done after the model used is free from classic assumption collision, in order to interpret the correct result.
The regression equation is:
Y = a + b1.LT + b2.LR + b3.EG + b4.RS + e
While :
LR = Local Retribution
EG = Economy Growth (PDRB value) RS = Revenue Sharing
a = constanta
b1,b2,b3,b4 = regresi coefficient
e = error
Regression analysis basically is a study of dependency of dependent variable to one or more independent variables. This study aimed at estimating or predicting mean of population or mean of dependent variable based on independent variable value.
(1) F-value
F test was used to test the significance of all independent variables. The F test used significance level of 5%.
(2) Determination Coefficient
(3) t-value
This test functions to determine the significance level of each of independent variables. t test in this research used the significance level of 5%.
CHAPTER IV
DATA ANALYSIS AND DISCUSSION
A. Introduction
Research samples were taken from financial statements of local government and data of PDRB (Produk Domestik Regional Bruto – Gross Regional Domestic Product) for each province local government. The samples were taken by using a purposive sampling through internet. The researcher examined the data by using SPSS (Statistical Product and Service Solution) for windows 15.00 program. The samples were taken from 30 provinces in Indonesia.
The variables used in this research were: Local government independence ratio, local tax, local retribution, PDRB growth (Produk Domestik Regional Bruto– Gross Regional Domestic Product), and revenue sharing.
limit the data. Therefore, the researcher only used financial statement from 2005 – 2007.
Analysis tool used in this research was multiple regression analysis in SPSS for windows 15.00. The four proposed hypothesis were tested by using multiple regression analysis. The first, it tested whether local tax influenced independence ratio. The second, it examined whether local retribution influenced independence ratio. Third, it evaluated whether PDRB influence independence ratio. Last, it tested whether revenue sharing influence independence ratio.
The analysis had to see the F value to evaluate the overall effects of the independent variables. F value gave explanation towards the model of the test. Based on F value, the researcher had confidence that the model was significant or not significant.
Other analysis can be seen from t value and R² value. The t value gave information that each of independent variable had effect towards the dependent variable or not. R² showed how big the independent variables could explain dependent variable.
B. Data Description
Data description includes the selection of samples and descriptive statistics analysis.
1. Population and Sample Selection
This study used secondary data from audited financial statement issued by BPK in www.bpk.go.id. The population of this study was all 473 local governments in Indonesia, consists of 33 provinces and 440 regencies/cities. The samples were taken by using a purposive sampling. The researcher took the 30 provinces in Indonesia as sample.
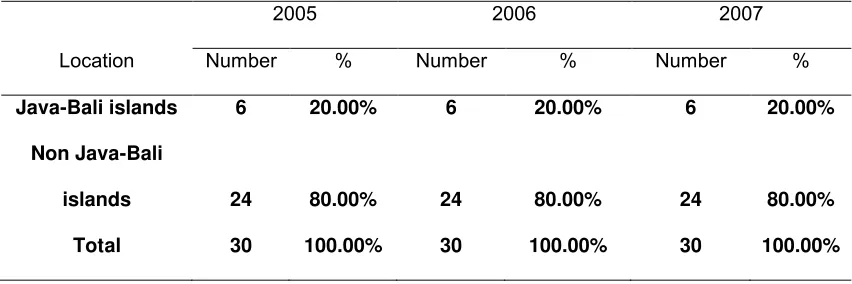
The samples consist of 30 provinces in Indonesia: 6 provinces in Java-Bali islands, and 24 provinces outside Java-Java-Bali islands.
This information is presented in the table below: Table 1 Sample Location
Location
2005 2006 2007
Number % Number % Number %
Java-Bali islands 6 20.00% 6 20.00% 6 20.00%
Non Java-Bali
islands 24 80.00% 24 80.00% 24 80.00%
Total 30 100.00% 30 100.00% 30 100.00%
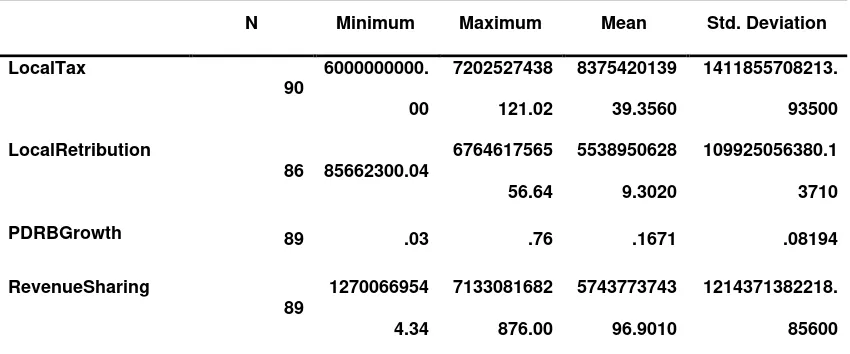
Valid N (listwise) 84
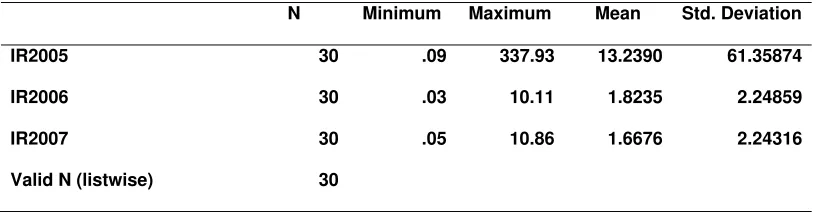
The table above shows that: the minimum value of local tax is 6,000,000,000.00 the maximum value of local tax is 7,202,527,438,121.02. The mean is 837,542,013,939.36 and the standard deviation is 1,411,855,708,213.94. The minimum value of local retribution is 85,662,300.04, the maximum value of local retribution is 676,461,756,556.64. The mean is 55,389,506,289.3 and the standard deviation is 109,925,056,380.14.
The minimum value of PDRB Growth is 0.03, the maximum value of PDRB is 0.76, the mean is 16.71 and the standard deviation is 0.08194. The minimum value of Revenue sharing is 12,700,669,544.34, the maximum value of revenue sharing is 7,133,081,682,876.00, the mean is 574,377,374,396.9 and the standard deviation is 1,214,371,382,218.86.
3. Independence Ratio
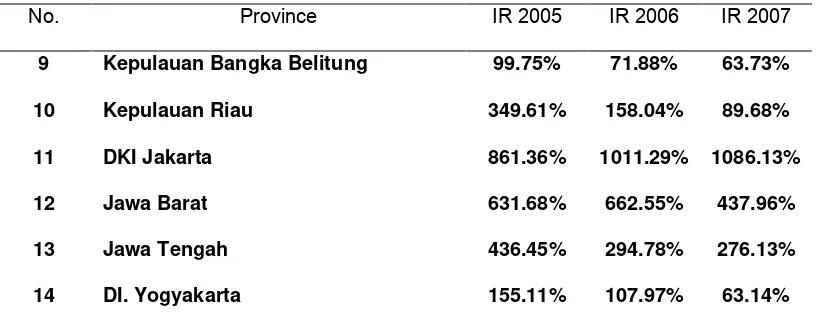
Local government independence ratio which used as tool to see the government independence, use the comparison of PAD (local own revenue) toward central government grant and loan (consist of DAU, DAK, government other legal revenue, and loan and grant from central government). The result of independence ratio calculation for year 2005 - 2007 is as presented in the table below:
Table 3
Independence ratio calculation
No. Province IR 2005 IR 2006 IR 2007
1 Nanggroe Aceh Darussalam 15.85% 27.43% 53.02%
2 Sumatera Utara 400.64% 271.36% 242.60%
No. Province IR 2005 IR 2006 IR 2007
9 Kepulauan Bangka Belitung 99.75% 71.88% 63.73%
10 Kepulauan Riau 349.61% 158.04% 89.68%
11 DKI Jakarta 861.36% 1011.29% 1086.13%
12 Jawa Barat 631.68% 662.55% 437.96%
13 Jawa Tengah 436.45% 294.78% 276.13%
15 Jawa Timur 502.01% 439.16% 374.80%
16 Bali 355.86% 206.43% 187.62%
17 Kalimantan Barat 92.31% 63.72% 71.14%
18 Kalimantan Tengah 46.11% 39.09% 42.93%
19 Kalimantan Selatan 217.11% 154.50% 134.04%
20 Kalimantan Timur 33793.03% 465.56% 537.41%
21 Sulawesi Tengah 50.57% 142.54% 36.06%
22 Sulawesi Selatan 195.54% 144.61% 163.69%
23 Sulawesi Tenggara 38.65% 28.29% 30.08%
24 Gorontalo 21.86% 13.81% 16.15%
25 Sulawesi Barat 167.23% 13.04% 16.05%
26 Nusa Tenggara Barat 76.39% 65.58% 70.14%
27 Nusa Tenggara Timur 44.91% 36.70% 31.85%
28 Maluku 19.54% 18.55% 13.68%
29 Papua Barat 8.63% 3.37% 7.04%
30 Papua 8.99% 26.48% 5.44%