THE RELATIONSHIP OF EDUCATION AND ICT
DETERMINANTS ON NATION’S GROWTH: AN
EMPIRICAL ANALYSIS O F M ALAYSIA AND
MUSLIM COUNTRIES
Sayed Kushairi Sayed Nordin1, Bushra Abdul Halim2, Mohd Zamzuri Ab Rashid3, Mohd Shahrizan Othman4
1Department of Robotics & Automation
Faculty of Manufacturing Engineering Universiti Teknikal Malaysia Melaka
2Department of Mathematics and Statistics
Faculty of Computer and Mathematical Sciences Universiti Teknologi MARA Tapah, Perak
3Department of Mechatronic Engineering, Faculty of Electrical Engineering
Universiti Teknikal Malaysia Melaka
4Department of Manufacturing Management
Faculty of Manufacturing Engineering Universiti Teknikal Malaysia Melaka
Email: [email protected], [email protected], [email protected], [email protected]
ABSTRACT
Human capital is an important input to growth almost in every economy. This paper analyses and compares the contribution of education and ICT (information and communication Technology) variables on economic growth. Multiple regression and unbalanced panel approach are applied to a sample of ten countries from 1976 to 2010. The results revealed that school life expectancy, primary and secondary school enrolment inluence on Malaysia’s growth. Meanwhile, the number of internet users, primary and tertiary school enrolment inluences growth of Muslim countries.
KEYWORDS: economic growth, education, ICT, panel data
1.0 INTRODUCTION
Journal of Human Capital Development
properly developed for the sake of the country. Through education, quality of human capital can be improved and eventually afect a nation’s economic growth in the future. Hanushek, Woessmann & Jamison (2008), concluded that as the number of years of schooling increase , the annual rate of economic growth increases for subsequent decades. Human capital is a resource to be concentrated by focusing on their best and brightest. If we spend more time in schools, we can learn more as it helps to increase one’s cognitive skills.
To spread and share knowledge, ICT plays an important role. Bucciarelli, Odoardi and Muratore (2010) reported that ICT is one of the stimulus for western countries in achieving advanced economic status. Previously, Andrew (2004) and Hava and Erturgut (2010) described on the importance of the wide use of ICT and its link with the country’s education. To achieve a well developed economy, the citizens must be well educated and well educated citizens usually equipped with advancement in science and technology.
The irst aim of this paper is to identify the main educational and ICT variables that can stimulate economic growth in Malaysia and Muslim Countries. This paper will also reveal the diferences and similarities between these countries. Eventhough there was a few studies has been done on cross country economic growth, none of them focused on Muslim countries’ growth.
The remaining of the paper is proceeded with review of education and ICT for growth, a discussion of data and methodology, summarizes the results and inally concludes.
Education and Economic Growth
Education helps to produce skillful, smart and creative people that it the market need. With skill, labour could work eiciently and result in higher productivity (Ballaceanu, 2011, Carmen, Laura and Laura 2012). Cakmak (2008) in her article stated that, if a country succeed in providing good education to its people, it indirectly shows the country’s prosperity and happiness. It was concluded that if the number of schooling years increased by one year, the average 40 year growth rate in GDP increased about 0.37 percent. Meanwhile, a good strategies have been implemented by the government of the United States in order to promote education system. For example, development of land grant universities has been widely promoted and huge amount of direct grant and loans have been allocated to students in research and development activities.
Harbison and Myers (1964) concentrated on diferent levels of education level atainment and they found that there was a high relationship between the Gross National Product (GNP) with secondary school rate and tertiary school rate. However, apart of the school rate or quantity, Erdagon (2006) reported that the quality of education itself is a crucial factor to produce quality human capital.
In China, it was inequality concentration on diferent levels of education. Changzheng and Jin (2010) criticized the uneven investment allocation among primary, secondary and tertiary school since 2001. According to them, based on form analysis of Gini Coeicient and Total Factor Production, this policy will afect the country’s future growth if the China government still remains focused on tertiary school. This system should be improvised by providing equal concentration for all levels of education. In northern Europen Countries, based on research done by Sterlacchini (2008) showed that, besides R&D activities, regional growth is signiicantly related to the education received in some northern European Countries. It was revealed that, urban areas developed faster as most of their citizens atained a higher level of education.
ICT and Economic Growth
Journal of Human Capital Development
In Malaysia, a project known as Digital Malaysia is recently introduced as a part of the National Digital Economiy Initiative. The objective is to promote ICT in all aspects of economy to link communities globally and communicating in real time resulting in higher grow national income, improved productivity and standards of living. However, there is a diferent situation with countries such as Syria and Iran. The stricter policy was imposed by the government on the internet, television and radio more than the other countries in the world (Shirazi, Gholami and Higon, 2009). This limitation makes the price of ICT higher. Their citizens need to pay more in order to use technology especially internet. This kind of control failed to bring their education system to a higher level as they are not seen ICT as part of education, whereas developed countries with higher education atainment, beneited greater from ICT. The use of ICT in high income countries is 22 times more likely higher than low income countries while the cost of ICT is estimated about 150 times higher than high income countries.
2.0 DATA AND METHODOLOGY
The initial purpose of this study was to use mathematics and the sciences as a measure of student’s performance. Because of the limitation to ind a suicient number of countries over a long period of time, we dropped out that variable. There are ive variables involved in this study. The data from 1976 to 2010 were gathered from The World Bank Report. The country of Malaysia is analysed by using multiple regression technique. Another ten countries of the Muslim world were randomly selected to be involved in the analysis of panel data namely Algeria, Indonesia, Malaysia, Oman, Nigeria, Qatar, Saudi Arabia, Syrian Arab Republic, Pakistan and Turkey.
The functional relationship between the dependent and independent variables can be expressed as follows:
expressed as follows:
) , , , ,
(IT PSE SSETSESLE f
GDP
where response variable is the annual increment of growth domestic product, GDP (%), where response variable is the annual increment of growth domestic IT is
product, GDP (%), IT is the total of internet user (per 100 people), PSE is the rate of primary school enrolment (%), SSE is the rate of secondary school enrolment (%) , TSE is the rate of primary school enrolment (%) and SLE is the school life expectancy (in year).
Education satisfy the usual regression model conditions.
The general equation of panel data is given by
where Y is the dependent variable, the X are observed explanatory variables, the Z are
j p
where Y is the dependent variable, the Xj are observed explanatory variables, the Zp are unobserved explanatory variables, the index i
refers to the unit of observation, the t refers to the time period, the j and
p are used to diferentiate between diferent observed and unobserved
explanatory variables, δt is the coeicient for the binary time regressors and the δit is a disturbance term assumed to satisfy the usual regression model conditions. The country represents the individual and year represents the time variable t.
The Xj variables are usually the variable of interest, where the
Zpvariables are responsible for unobserved heterogeneity and as such constitute a nuisance component of the model. There is no means of
geting information about the
e model can be conveni
component of the model since the Zp variables are unobserved. Hence the model can be conveniently
rewriten as
is known as the unobserved effect. It represents the combined impact of theZ onY.
Journal of Human Capital Development
In this study, unbalanced panel is used since there are some missing observations. In model iting, there are two techniques involved namely ixed efects model and random efects model. Fixed efects assume the time-invariant characteristics are independent without correlation with characteristics belongs to other cross-sections. Every cross-section is diferent, thus, the error term and the characteristics should not be correlated with each other. A time-invariant characteristic does not contribute to a change since it is constant for each cross-section (Kohler
et.al., 2005). Another efect is the random efect model. A cross-section
efect is considered as random if the levels observed in that group are drawn from a population. The independence of cross-section’s error with the explanatory variables allows the time-variant variables to act as explanatory variables.
3.0 EMPIRICAL RESULTS
Table 1: Results of Correlated random efect – Hausman TestTable 1: Results of Correlated random effect – Hausman Test
Chi-square Decision
cross section period cross section period
5.1834 5.271 random effect random effect
significance levet at 1%(***), 5% (**), 10%(*)
Hausman Test is a diagnostic test being used with the purpose to determine either random efect model or ixed efect model its the data beter. Referring to Table 1, at 1%, 5% and 10% signiicance level, the random efect model is preferable for both cross section and period speciication (Chi-square 5.1834 for cross section and 5.271 for period).
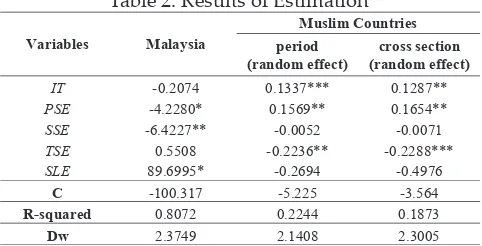
Table 2: Results of EstimationTable 2: Results of Estimation
Variables Malaysia
Muslim Countries period
(random effect)
cross section (random effect)
IT -0.2074 0.1337*** 0.1287**
PSE -4.2280* 0.1569** 0.1654**
SSE -6.4227** -0.0052 -0.0071
TSE 0.5508 -0.2236** -0.2288***
SLE 89.6995* -0.2694 -0.4976
C -100.317 -5.225 -3.564
R-squared 0.8072 0.2244 0.1873
Dw 2.3749 2.1408 2.3005
significance levet at 1%(***), 5% (**), 10%(*)
is 0.807, explaining 80.7% of the variability of the economic growth by those ive variables. Therefore, the model is good enough. For Muslim countries, random efect with period speciication is preferable since it has a slightly higher coeicient of determination, 0.2244. Though it only explains only about 22.4% of the variability, it is considerable as fair enough. For cross-countries analysis, it is normal if the value of R-squared is low. (Nordin, 2012).
The inal results show that there are three variables statistically signiicant for each model. For Malaysia, the variables are primary school enrolment, secondary school enrolment and school life expectancy. For Muslim Countries, the variables are internet users, primary school enrolment and tertiary school enrolment. It is surprising to see that there is a negative relationship between primary and secondary school enrolment to Malaysia’s economic growth and between tertiary school enrolment to Muslim countries’ economic growth. However, primary school enrolment has a positive impact on Muslim countries’ growth. For every 1 percent increase in primary school enrolment, economic growth will increase by about 0.16 percent. School life expectancy is conducive to economic growth in Malaysia. The coeicient reveals that the economic growth will boost by as high as 89 percent for every 1 year increment. Meanwhile, the positive impact of internet users variable will promote Muslim countries’ economic growth by 0.13 percent higher when internet users increases by 100 people.
4.0 CONCLUSION
Journal of Human Capital Development
REFERENCES
Andrew, R. (2004). The Impact of ICT on Literacy Education. New York, NY: RoutledgeFalmer
Balaceanu, C. (2011).Romanian educational system sustainability. Procedia Social and Behavioral Sciences, 15, 496-500.
Cakmak, O. (2008). Training and development impact of the economy. D.U Ziya Gocalp Education Faculty Journal, 11, 34-39.
Carmen, C., Laura, C., & Laura, L. (2012). The relevance of education as a capital asset for economic development: references to the Romanian Situation. Procedia-Social and Behavioral Sciences, 46, 3582-3587
Castagna, A., Colantonio, E., Furia, D., & Matoscio, N. (2010). Does education
play a relevant role in organization? Procedia Social and Behavioral Sciences, 15, 3742-3750.
Changzheng, Z., & Jin, K. (2009). An empirical study on the relationship between educational equity and the quality of economic growth in China: 1978-2004. Procedia Social and Behavioral Sciences, 1, 189-194.
Colantonio, E., Marianacci, R. & Matocio, N. (2010). On Human Capital and
economic development: some results for Africa. Procedia Social and Behavioral Sciences, 9, 266-272.
Bucciarelli, E., Odoardi, L., & Muratore, F. (2010). What role for education and
training in technology adoption under an advanced socio-economic perspective? Procedia Social and Behavioral Sciences, 9, 573-578.
Erdogan, I. (2006). New directions for education to the teaching profession. Ankara: Pegem A. Publishing
Hanushek, E. A., Woessmann, L., Jamison, L. J., & Dean T. Jamison, D. T. (2008).
Education and Economic Growth. Education Next, 8(2). Retrieved
from htp://educationnext.org/education-and-economic-growth/ Harbison, F., & Myers, C. A. (1964) Education, Manpower and Economic
Growth. US: McGraw-Hill Inc.
Hava, H. T., & Erturgut, R. (2010). An evaluation of education relations
together with technology, employment and economic. Procedia Social and Behavioral Sciences, 9, 1771-1775.
Internet Usage in Asia. (2013). Retrieved on 4th July 2013, from htp://www. internetworldstats.com/stats3.htm#asia
Kohler, U. & Kreuter, F. (2005). Data Analysis Using Stata. Retrieved from
October from htp://books.google.com.my/books?id=4rrsRqUSls8C&p rintsec=frontcover&source=gbs_ge_summary_r&cad=0#v=onepage&
Krueger, A. B., & Lindahl, M. (2001). Education for Growth: Why and for
whom? Journal of economic Literature, 39, 1101-1136.
Nordin, S. K. S. (2012). Determinant of Growth: A Panel Approach. (Unpublished
master’s dissertation). Universiti Sains Malaysia, Penang.
Shirazi, F., Gholami, R., & Dolares, D., A. (2009). The impact of information and communication technology (ICT), education and regulation on economic freedom in Islamic Middle Eastern Countries. Journal of Information & Management, 46, 426-433.
Sterlacchini, A.(2008). R&D, higher education and regional growth: uneven linkages among European regions. Journal of Research Policy, 37, 1096-1107.
The World Bank. (2013). Retrieved on 7th January 2013, from htp://databank.
worldbank.org/data/home.aspx#ranking
What is Digital Malaysia (DM)?. (2013). Retrieved on 5th July 2013, from