Published by the United Nations Development Programme (UNDP), Malaysia.
© UNDP. All rights reserved.
First published August 2007.
ISBN 983-3904-01-3
United Nations Development Programme
Wisma UN, Block C, Kompleks Pejabat Damansara,
Jalan Dungun, Damansara Heights, 50490 Kuala Lumpur, Malaysia. www.undp.org.my
A catalogue record for this book is available from the Library of UNDP.
The contents may be freely reproduced for non-commercial purposes with attribution to the copyright holders.
Pictures and graphics are courtesy of PTM and UNDP. Maps are not authoritative on boundaries
S
oaring energy prices are a reminder of the essential role that affordable energy plays in sustainable economic growth and higher human development. Safeguarding energy supply, especially from cleanindigenous resources, has become more pressing than ever. Current patterns of energy generation
and use impact negatively on the environment at local, regional and global levels.
The degradation of our environment due to energy production from fossil fuels, have contributed to a
global reevaluation of energy use in all economic sectors. The need for sustainable energy use has become
more and more evident. As such, renewable energy is envisaged to become an increasing share of
Malaysia’s electricity generation. With abundant sources available, such as biomass and biogas, the palm
oil industry is likely to become ever more prominent in adopting renewable energy.
In 2002, the government of Malaysia initiated a project Biomass Power Generation and Cogeneration in
Palm Oil Industry (BIOGEN) to help promote the use of renewable energy, with support from the United
Nations Development Programme (UNDP), the Global Environment Facility (GEF) and the private sector.
The project’s primary objective is to develop and implement activities that will build stakeholders’ capacity
and facilitate the greater adoption of renewable energy system. It focuses on palm oil industries and the
use of waste material in generating electricity in the mills and selling it to the grid where possible. The
information presented in this publication provides an indication of the efforts being made and the related
policy implications.
This is the fourth of a new series of periodic publications that report on UNDP Malaysia’s work in its
energy and environment practice area. The large range of projects being undertaken in this portfolio is
designed to support Malaysia’s effort to achieve the Millennium Development Goal 7 (MDG7), of ensuring
environmental sustainability. The series of publications and updates on particular project may be accessed
through UNDP’s website, http://www.undp.org.my.
I would like to thank the GEF for cofunding this project and Ministry of Energy, Water and
Communications (MEWC) for implementing it with UNDP. I would also like to thank other institutional
participants and members of the Biogen team (page IX). Special thanks go to the Report Team for their
professionalism and good efforts in putting this publication together. I sincerely hope that it will be widely
read and will increase awareness of the critical importance of good environmental management on the use
The project has highlighted a number of important issues and some significant lessons
have been learnt. It is hoped that as the project move towards completion, these
experiences and the outcomes, in the form of policy development and the demonstration
models, will provide exemplars for further steps in renewable energy throughout Malaysia.
Richard Leete Ph.D
Resident Representative
United Nations Development Programme
Foreword
Boxes, Tables, Figures and Map
Abbreviations and Acronyms
Glossary
Participants
Global Energy Production and Consumption
World Scenario
Expanding demand for energy Sources of energy
Problems posed by conventional fuels Bioenergy
Malaysia’s Energy Profile
Energy policy
Configuring a Malaysian response to the global challenge
Palm Oil in the Global Market
The uses and potential of palm oil Palm oil production and trade
Oil palm industry and the environment
The Malaysian Palm Oil Market
Modern commercial development
The Biogen Project
Project strategy
The anticipated contribution of biomass to power generation
Implementing biomass power generation and cogeneration Key barriers to change
Operational uncertainties Immediate objectives Planned outputs Full scale model Key achievements Challenges
Lessons Learnt
Sources of Information
Publications Internet
iii
vi
vii
viii
ix
1
9
12
15
17
29
B o x e s
Box 1 Renewables
Box 2 Uses of palm oil
T a b l e s
Table 1 Selected renewables indicators for Southeast Asian countries, 2004
Table 2 Final energy demand by source, 2000-2010
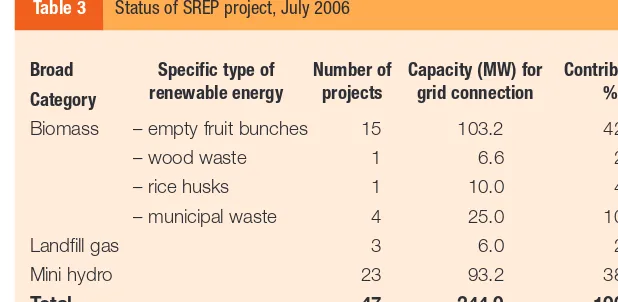
Table 3 Status of SREP project, July 2006
Table 4 Area planted in oil palm by ownership, 2006
Table 5 Status of palm oil processing plants, 2006
Table 6 Area planted in oil palm by state, 2006
Table 7 Biomass resources potential, 2005
F i g u r e s
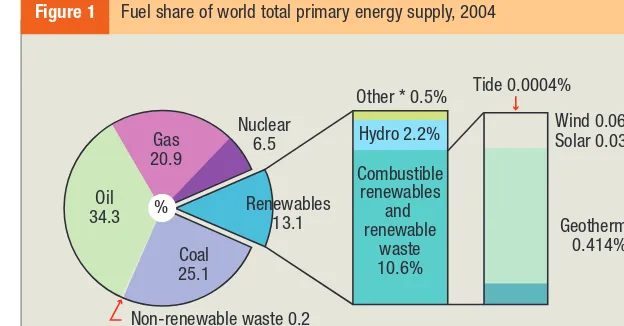
Figure 1 Fuel share of world total primary energy supply, 2004
Figure 2 Global sectoral consumption of renewables, 2004
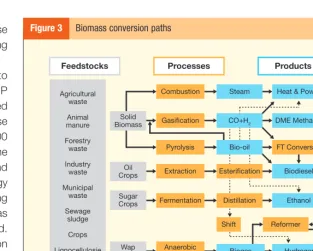
Figure 3 Biomass conversion paths
Figure 4 Global palm oil production and trade, 1961-2006
Figure 5 Average annual growth of palm oil versus other oils and fats, 1996-2006
Figure 6 Palm oil versus soy oil – global production and trade, 1996-2006
Figure 7 Schematic diagram of biomass power generation
Figure 8 Schematic diagram of biogas power generation
M a p
Map 1 Graphical representation of the palm oil processing plants, 2006
AAIBE Akaun Amanah Industri Bekalan Elektrik (MESITA)
APS Alternative Policy Scenario (of the
International Energy Agency)
BPMB Bank Pembangunan Malaysia Berhad
(new name for Bank Industri & Teknologi)
CDM Clean Development Mechanism (Kyoto
Protocol)
CHP Combined heat and power
EFB Empty fruit bunches
EPU Economic Planning Unit
FELCRA Federal Land Consolidation and
Rehabilitation Authority
FELDA Federal Land Development Authority
FFB Fresh fruit bunches
FSM Full scale model
GEF Global Environment Facility
GHG Greenhouse gas
GoM Government of Malaysia
Gt Gigatonnes
GWh Gigawatt hour
ha hectare
IEA International Energy Agency
kt kilotonne
KTAK Kementerian Tenaga, Air dan Kommunikasi
(MEWC)
ktoe kilotonnes of oil equivalent
mb/d million barrels per day
mtoe million tonnes of oil equivalent
MEWC Ministry of Energy, Water and
Communications
MIEEIP Malaysian Industrial Energy Efficiency
Improvement Project
MNRE Ministry of Natural Resources and
Environment
MPIC Ministry of Plantation Industries and
Commodities
MPOB Malaysian Palm Oil Board
MPOC Malaysia Palm Oil Council
MW Megawatt
OECD Organisation for Economic Co-operation and
Development
OPEC Organization of the Petroleum Exporting
Countries
POME Palm oil mill effluent
PORIM Palm Oil Research Institute of Malaysia
PTM Pusat Tenaga Malaysia (Malaysia Energy
Centre)
RE Renewable energy
REBF Renewable Energy Business Facility
REPPA Renewable energy power purchase
agreement
RISDA Rubber Industry Smallholders Development
Authority
RSPO Roundtable on Sustainable Palm Oil
SCORE Special Committee on Renewable Energy
SESB Sabah Electricity Sdn Bhd
SREP Small Renewable Energy Programme
TNB Tenaga Nasional Berhad
G l o s s a r y
anaerobic bacterial process without oxygen
bagasse residue of sugar cane crushing
baseload steady flow of power regardless of fluctuating demand
bioenergy energy produced from organic matter
Biogen codename of the project
carotenoids a compound that is a source of vitamin A
cogeneration production of electricity and thermal energy from a common fuel source
co-firing burning of secondary fuel (often renewable energy form) with primary
fossil-fuel in power plants
force majeure extraordinary, unforeseen event beyond the control of contracting parties
lignocellulosic woody biomass (timber, wood chips, straw, manure)
mesocarp fleshy part of the fruit between the skin and the kernel
oleochemical chemical derived from oils or fats
primary energy Energy embodied in natural resources before being converted to more convenient forms, such as electricity and gasoline
pyrolysis chemical decomposition of organic materials by heat in the absence of
I n s t i t u t i o n a l P a r t i c i p a n t s
Executing Agency Ministry of Energy, Water and Communications
Government of Malaysia
Implementing Agency Pusat Tenaga Malaysia
GEF Implementing Agency United Nations Development Programme
UNDP GEF Bangkok Regional Office
Donor Partners AAIBE, The Government of Malaysia
B i o g e n T e a m
Dr Anuar Abdul Rahman National Project Director
Ahmad Zairin Ismail Deputy Director
Dr. Sanjayan Velautham Chief Project Coordinator (effective May 2007)
Norasikin Ahmad Ludin Project Coordinator (until February 2007)
Ghazali Talib Programme Manager
Mohd Azwan Mohd Bakri Project Manager
Nor Azaliza Damiri Project Manager
Mohd Hairol Azlin Abdul Latif Project Manager
Mazlina Hashim Project Manager
Zaimul Khalil Project Manager
Mohd Hafiz Mohd Shuib Finance Officer (until February 2007)
Saharuddin Savee Finance Officer (effective Mar 2007)
R e p o r t T e a m
Dr. Sanjayan Velautham Chief Project Coordinator
Ghazali Talib Programme Manager
Professor Warwick Neville University of Auckland, Consultant
Asfaazam Kasbani UNDP Programme Manager
S t a k e h o l d e r s
Economic Planning Unit (EPU)
Ministry of Energy, Water and Communications (MEWC)
Ministry of Natural Resources and Environment (MNRE)
Malaysian Palm Oil Association (MPOA)
Palm Oil Millers Association (POMA)
Malaysian Palm Oil Board (MPOB)
Energy Commission
Bank Pembangunan Malaysia Berhad (BPMB)
Universities
W o r l d S c e n a r i o
The world is facing two energy related threats:
•lack of sustainable, secure and affordable
energy supplies; and
•the environmental damage incurred in
producing and consuming ever-increasing amounts of energy.
In the first decade of the twenty-first century, soaring energy prices and destabilizing geopolitical events have been a reminder of the essential role that affordable energy plays in economic growth and human development, and of the vulnerability of the global energy system to supply disruption. Safeguarding energy supplies is an international priority, yet current patterns of energy supply and consumption themselves carry the threat of irreversible environmental damage.
The need to curb growth in fossil energy demand, to increase geographic and fuel supply diversity, and to mitigate climate destabilizing emissions such as greenhouse
the main culprit in GHG emissions. Kyoto Protocol (started in 1997), strengthens the Convention by committing Annex I Parties to individual, legally-binding targets to limit or reduce their greenhouse gas emissions and the implementation of renewable energy system remains as the most feasible and popular options available.
For the G8 nations, the International Energy Agency (IEA) was requested to prepare a strategy in the form of an Alternative Policy Scenario (APS) that proposes policies and measures for the consideration of governments in order to significantly reduce the rate of increase in energy demand and emissions. The economic cost of these policies, put
forward in 20061, would be more than
outweighed by the economic benefits that would accrue from producing and using energy more efficiently.
With worldwide adoption of stricter environmental standards and guidelines for greenhouse gas emissions, it is becoming clear that renewable energy systems will be credited for their inherent advantage in lowering emissions. These environmental benefits will contribute towards making the delivered costs more palatable and are already the driving force behind policy initiatives in many more advanced countries. Whether governments of OECD or non-OECD countries will adopt the Alternative Policy Scenario or some elements of it remains to be seen: huge obstacles, ranging from powerful vested interests to public indifference, will have to be overcome. Reconciling the goals of energy security and environmental protection requires strong and coordinated government action and public support.
Meanwhile, fossil fuel demand and greenhouse gas emissions continue on their current unsustainable trajectories. In the following sections, the magnitude and implications of these continuing trends are more fully explored.
E x p a n d i n g d e m a n d f o r
e n e r g y
Between 2006 and 2030, unless strong and coordinated government action and public support significantly modify recent trends, global primary energy demand is projected to increase by just over half, or at an annual rate of 1.6%. Over 70% of that increase in demand will be from developing countries, China alone accounting for nearly 30%. This represents a significant shift in the centre of gravity of global energy demand towards countries that are experiencing faster economic (and often population) growth than more advanced countries such as those in the Organisation for Economic Co-operation and Development (OECD).
M A L A Y S I A G E N E R A T I N G R E N E W A B L E E N E R G Y F R O M P A L M O I L W A S T E S
S o u r c e s o f e n e r g y
Globally, fossil fuels are predicted to remain the dominant source of energy to 2030, accounting for 83% of the overall increase in energy demand between 2004 and 2030. Consequently, their share of total world demand edges up from 80% to 81%. Among fossil fuels, the share of oil is predicted to drop, although oil still remains the largest single fuel in the global energy mix by 2030. Global oil demand, 84 million barrels per day (mb/d) in 2005, is expected to reach 99 mb/d by 2015, and 116 mb/d in 2030. Coal as an energy source is expected to record the greatest increase in demand in absolute terms and will remain the second largest primary fuel, its share in global demand increasing slightly. China and India alone account for almost 80% of the incre-mental demand for coal. The share of natural gas is also expected to increase, despite rising prices.
Hydropower’s share of primary energy rises slightly, while that of nuclear power is expected to fall. The share of biomass falls marginally, as developing countries switch to using modern commercial energy, offsetting the growing use of biomass as feedstock for biofuels production and for power and heat generation. Non-hydro renewables— including wind, solar and geothermal—grow quickest but from a low base.
In 2004, renewables accounted for 13.1% of the 11,059 million tonnes of oil equivalent (mtoe) of world total primary energy supply (Figure 1). Combustible renewables and waste (97% of which is biomass, both commercial and non-commercial) represented 79.4% of total renewables followed by hydro (16.7%). Renewable energies (‘renewables’) are
essential components in the global energy portfolio as they contribute to world energy supply security, reducing dependence on fossil fuel resources, and providing opportunities for mitigating greenhouse gases (Box 1).
In ASEAN countries, renewable energy is already in the generation mix as indicated in Table 1. Most of sources come from hydro, biomass and geothermal.
• Nearly one-third of the world’s population do not yet have electricity or other modern forms of energy supply; and a second third have only limited access;
• Sources of energy are frequently long distances from the point of consumption, resulting in inefficiencies and wastage;
• Almost half of the increase in global primary energy use goes to generating electricity and 20% to meeting transport needs – almost entirely in the form of oil-based fuels;
• Coal, used mainly for power generation, is expected to be the energy source for which growth in demand will be greatest; this implies that mitigating emissions will be an ever greater challenge.
C h a l l e n g e s
* Geothermal, solar, wind, tide/wave/ocean.
Source: International Energy Agency, Renewables in Global Energy Supply: An IEA Fact Sheet, OECD, 2007, Figure 1. Oil 34.3 Gas 20.9 % Nuclear 6.5
Other * 0.5%
Hydro 2.2% Combustible renewables and renewable waste 10.6% Geothermal 0.414% Tide 0.0004% Wind 0.064% Solar 0.039% Coal 25.1
Non-renewable waste 0.2 Renewables
[image:15.651.242.554.416.579.2]13.1
The principal constraint in advancing commercial renewable energy over recent decades has been cost-effectiveness. With the exception of large hydropower, combustible biomass and larger geo-thermal projects, the average costs of renewable energy are generally not competitive with wholesale electricity and fossil fuel prices.
P r o b l e m s p o s e d b y
c o n v e n t i o n a l f u e l s
Economic and security issues
Rising oil and gas demand, if unchecked, would accentuate the consuming countries’ vulnerability to severe supply disruption and associated price escalation. Most developed countries and developing Asian countries are becoming increasingly dependent on
M A L A Y S I A G E N E R A T I N G R E N E W A B L E E N E R G Y F R O M P A L M O I L W A S T E S
Solid biomass:Organic non-fossil material of biological origin that may be used as fuel for heat production or electricity generation.
Wood, wood waste and other solid waste:Purpose grown energy tree crops; woody materials generated by industrial processes (timber/paper industries in particular) or directly by forestry and agriculture (firewood, wood chips, bark, sawdust, shavings, chips, etc); wastes such as straw, rice husks, nut shells, poultry litter and crushed grape dregs.
Charcoal:Solid residue of the destructive distillation and pyrolysis of wood and other vegetal material.
Biogas:Gases composed principally of methane and carbon
dioxide produced by anaerobic digestion of biomass and combusted to produce heat and/or power.
Liquid biofuels:Bio-based liquid fuel from biomass transformation, mainly used in transportation applications.
Municipal waste (renewables):Wastes produced by the residential, commercial, and public services sectors and
incinerated in specific installations to produce heat and/or power. The renewable energy portion is defined by the energy value of combusted biodegradable material, thus excluding any non-biodegradable waste.
Hydropower:Potential and kinetic energy of water converted into electricity in hydroelectric plants ranging in size from very small to huge operations.
Geothermal energy:Energy emitted from within the earth’s crust, usually in the form of hot water or steam, exploited at suitable sites for electricity generation after transformation, or utilized directly as heat.
Solar Energy:Solar radiation exploited for hot water production and electricity generation. Passive solar energy for direct heating, cooling and lighting also contributes but is too difficult to measure and record in the data.
Wind energy:Kinetic energy of wind exploited for electricity generation by wind turbines.
Tide/Wave/Ocean energy:Mechanical energy derived from tidal movement, wave motion or ocean current, exploited for energy generation.
Box 1 Renewables
imports as their indigenous production fails to keep pace with demand. Non-OPEC production of conventional crude oil and natural gas liquids is expected to peak by about 2015. By 2030, OECD countries will be importing two-thirds of their oil needs compared with 56% in 2005. A large proportion of the additional imports will originate in the Middle East and be transported along lengthy and vulnerable maritime routes. The concentration of oil production in a small group of countries with large reserves, notably the Middle East OPEC members and Russia, will increase their market dominance and ability to impose higher prices. An increasing share of gas demand is also expected to be met by imports, via pipeline or in the form of liquid natural gas shipped from distant suppliers.
Although most oil-importing economies around the world have continued to grow strongly, they would almost certainly have grown even more rapidly had the price of oil and other forms of energy not increased. The longer prices remain high or rise further, the greater the threat to economic growth in all importing countries. The growing insensitivity of oil demand to price accentuates the potential impact of a supply disruption on international oil prices. In particular, the share of transport demand in global consumption is projected to rise, and as a result, oil demand can be expected to become less and less responsive to movements in international crude oil prices.
Environmental issues
If present production and consumption patterns continue, global energy related to
carbon dioxide (CO2) emissions will increase
by 14 gigatonnes (Gt), or 55%, to 40 Gt,
between 2004 and 2030, a rate of 1.7% per year. Power generation contributes half of this increase in global emissions. Coal overtook oil in 2003 as the leading
contributor to global energy related CO2
emissions and consolidates its position through to 2030. Emissions are projected to grow slightly faster than primary energy demand, a reversal of the trend evident since 1980, because of the increase in the
A Share of total renewables in TPES.
B Share of renewables excluding combustible renewables and waste. 1 Total primary energy supply. 2 Million tonnes of oil equivalent.
Source: International Energy Agency, Renewables in Global Energy Supply: An IEA Fact Sheet, OECD, 2007, Table 1. Country/Continent Shares of Renewables in TPES1
Mtoe2
Brunei Darussalam 2.7 0.7 0.0
Indonesia 174.0 30.8 3.8
Malaysia 56.7 5.8 0.9
Philippines 44.3 45.6 21.6
Singapore 25.6 0.0 0.0
Thailand 97.1 16.9 0.5
Vietnam 50.2 50.2 3.0
Asia 1,289.4 31.8 2.4
World 11,058.6 13.1 2.7
TPES1 A
%
[image:17.651.240.424.436.590.2]average carbon content of primary energy consumption.
Developing countries account for over
three-quarters of the increase in global CO2
emissions between 2004 and 2030. They overtake developed countries as the biggest emitters soon after 2010. China alone is expected to be responsible for about 39% of the increase in global emissions as a consequence of strong economic growth and heavy reliance on coal in power generation and industry, and will overtake the United States as the world’s biggest emitter by 2010.
B i o e n e r g y
Traditional uses of biomass
In 2005, 2.5 billion people used firewood, charcoal, agricultural waste and animal dung to meet most of their daily energy needs for cooking and heating. In many countries, these resources account for over 90% of total household energy consumption. The inefficient and unsustainable use of bio-mass has severe consequences for health, the environment and economic growth. As such, about 1.3 million people, mostly women and children, die prematurely every year because of exposure to indoor air pollution from biomass. The high prices of alternative fuels on international and domestic markets largely preclude a significant shift to cleaner, more efficient ways of cooking and heating.
By 2015, the number of people using biomass for essential domestic purposes is expected to rise to 2.6 billion, and to 2.7 billion by 2030 as population numbers increase. This means that one-third of the world’s population will still be relying on
M A L A Y S I A G E N E R A T I N G R E N E W A B L E E N E R G Y F R O M P A L M O I L W A S T E S
Statistical information on renewables (Figure 2) varies from country to country and from organization to organization. Time horizon, subsidies or taxation, sustainability and environment are all elements that may lead to differences in coverage for policy or practical reasons. Statistics cited in this section are drawn from the IEA Fact Sheet in which the definitions adopted for data compilation are also provided.
S t a t i s t i c a l c o v e r a g e o f r e n e w a b l e s
Source: International Energy Agency, Renewables in Global Energy Supply: An IEA Fact Sheet, OECD, 2007, Figure 4. Industry 11.3
%
Other sectors 3.3
Residential, commercial and public 57.9 Other transformation
and energy 5.6
[image:18.651.242.550.533.743.2]Electricity generation 21.9
biomass fuels, a share barely smaller than in 2005.
Halving the number of households using biomass for cooking by 2015, a recommendation of the United Nations Millennium project, would involve 1.3 billion people switching to liquefied petroleum gas and other commercial fuels. This would not have a significant impact on world oil demand and the equipment would cost less than US$1.5 billion per year. Vigorous concerted government action, with support from industrialised countries, would be needed to achieve this target, together with increased funding from both public and private sources. Policies would need to address barriers to access, affordability and supply, and to form a central component of broader development strategies.
Modern forms and uses of biomass
Biomass is attractive for use either as a stand-alone fuel or in fuel blends, such as co-firing wood with coal, or mixing ethanol or biodiesel with conventional petroleum based fuels. Anaerobic digestion has major potential in countries with ample resources. Electricity generated from biomass is based on steam turbine technology. Many regions of the world still have large untapped supplies of biomass residues that could be converted into competitively priced electricity using steam turbine power plants. Biomass combustion for heat and power is a fully mature technology. It offers both an economic fuel option and a ready disposal mechanism for agricultural, industrial and municipal wastes. However, the industry has remained relatively stagnant even though demand for biomass (mainly wood) continues to grow in many developing
countries. One of the problems of biomass is that material directly combusted in cooking stoves produces pollutants, leading to severe health and environmental consequences, although improved cooking stove programmes are alleviating some of these effects. A second issue is
that burning biomass emits CO2, even
though biomass combustion is generally
There are still 1.6 billion people in the world without electricity. To achieve the Millennium Development Goals relating to environmental degradation and use of solid fuels, this number would need to fall to less than one billion by 2015.
E n e r g y a n d t h e M i l l e n n i u m D e v e l o p m e n t G o a l s
Biomass resources include agricultural residues; animal manure; wood wastes from forestry and industry; municipal green wastes; sewage sludge; and dedicated energy crops such as short rotation (3-15 years) coppice
(eucalyptus, poplar, willow), grasses, sugar crops (sugar cane, beet, sorghum), starch crops (corn, wheat) and oil crops (soy, sunflower, oilseed rape, iatropha, palm oil). Organic wastes and residues have been the main biomass sources so far, but energy crops are gaining in importance and market share. Residues, wastes, and begasse are primarily used for heat and power generation. Sugar, starch and oil crops are primarily used for fuel production.
considered to be ‘carbon-neutral’ because carbon is absorbed by plant material during its growth, thus creating a carbon cycle.
Biomass can be burnt (or co-fired) to produce electricity and steam in a CHP plant via a steam turbine in dedicated power plants. The typical size of these plants is ten times smaller (less than 100 MW) than coal fired plants because of the limited availability of local feedstock and high transportation costs. Fossil energy consumed for bio-power production using forestry and agriculture products can be as low as 2-5% of the final energy produced. Based on life-cycle assessment, net carbon emissions per unit of electricity can achieve below 10% of the emissions from fossil fuel based electricity.
Biofuels
Biofuels are expected to make a significant contribution to meeting global road transport energy needs. They are estimated to account for 4% of road fuel consumption by 2030, up from 1% in 2005; under the IEA’s APS, consumption could be as high as 7%. The United States, European Union and Brazil are likely to remain the leading producers and consumers of biofuels. Ethanol is expected to account for most of the increase in biofuel use worldwide, as production costs are expected to fall faster than those of biodiesel, the other main biofuel.
Rising food demand, which competes with biofuels for existing arable and pasture land, will constrain the potential for biofuel production using current technology. In 2005, about 14 million hectares of land were used for the production of biofuels, equal to about 1% of the world’s available arable land.
This share is expected to rise to 2% by 2030, but if the policies of the APS are adopted, this would amount to 3.5%. The minimal amount of arable land needed in 2030 is equal to more than that of France and Spain, and under the APS would equate to all the arable land in the OECD countries.
New biofuels technology currently being developed, such as lignocellulosic ethanol (Figure 3), could allow biofuels to play a much bigger role than currently foreseeable. However, significant technological challenges still need to become commercially viable. Trade and subsidy policies will be critical factors in determining where and with what resources and technologies biofuels will be produced in coming decades, the burden of subsidies on taxpayers and the cost-effectiveness of biofuels as a way of promoting energy diversity and reducing carbon-dioxide emissions.
M A L A Y S I A G E N E R A T I N G R E N E W A B L E E N E R G Y F R O M P A L M O I L W A S T E S
Source: International Energy Agency, Energy Technology Essentials: Biomass for Power Generation and CHP, OECD, January 2007. Feedstocks Agricultural waste Animal manure Forestry waste Industry waste Municipal waste Sewage sludge Crops Lignocellulosie feedstock Processes Products Solid Biomass
Combustion Steam Heat & Power
[image:20.651.241.554.169.420.2]E n e r g y p o l i c y
The crucial role of energy in achieving Malaysia’s development aspirations has long been recognized, particularly in the country’s five-year plans. An early bench-mark was the establishment in 1974 of Petroliam Nasional Berhad (PETRONAS) as the national oil company responsible for the exploration, development, refining, and marketing of Malaysia’s petroleum products. This development, of major significance to the country’s economy, has been followed by the formulation of several important policies reflecting the issues challenging the government and the economy.
In keeping with the policies developed over the last four decades, the energy sector is focused on ensuring a secure, reliable and cost-effective supply of energy, aimed at enhancing the competitiveness and resilience of the economy. The Ninth Malaysia Plan 2006-2010 encourages energy efficiency, especially in transport, commercial and industrial sectors, and in government buildings, and aims to diversify fuel sources through greater utilization of renewable energy.
In Malaysia, the transport sector is the largest consumer of energy accounting for 40.5% of the total final commercial energy demand in 2005, followed by the industrial sector (38.6%) and the residential and commercial sector (13.1%), all expected to increase demand by over 6% during the 2006-2010 period.
Electricity accounts for about 19% of the total final energy demand in Malaysia (Table 2). Reported electricity generation does not include electricity generated directly by industrial consumers for their own use. In response to the Government of
Malaysia’s policy, the fuel mix for electricity generation is gradually being modified, with the share of natural gas in particular being
Policy / Plan Broad Objectives
1975 National introduced to ensure optimal use of petroleum petroleum policy resources, regulation of ownership and management of
the industry, and economic, social, and environmental safeguards in the exploitation of this valuable resource 1979 National formulated to achieve supply, utilization
energy policy and environmental objectives 1980 National introduced to guard against over depletion policy exploitation of oil and gas
1981 Four fuel emphasis given to fuel diversification, designed to diversification policy avoid dependence on oil; aimed at placing increased
emphasis on gas, hydro and coal
2000 Renewable energy introduced in recognition of the potential of biomass, as the fifth fuel policy biogas and other renewable energy resources 2006 National designed to pave the way for extensive Biofuel Policy development of the biofuels industry
Seventh Malaysia Plan Emphasis on energy efficiency and on generation 1996-2001, from renewable sources in an effort to reduce Eighth Malaysia Plan, the rapid depletion of other fuel sources 2001-2005 and
Ninth Malaysia Plan 2006-2010
M A L A Y S I A G E N E R A T I N G R E N E W A B L E E N E R G Y F R O M P A L M O I L W A S T E S
reduced to about 56% by 2010, and coal increased substantially to 36.5% (from just 8.8% in 2000).
Under the Ninth Malaysia Plan 2006-2010, it was estimated that demand for electricity will reach 20,087 MW in 2010. Renewable energy is expected to contribute 350 MW to the total energy supply by that time: about 300 MW of RE is expected to be generated and connected to the grid in Peninsular Malaysia, and 50 MW to the grid in Sabah.
C o n f i g u r i n g a M a l a y s i a n
r e s p o n s e t o t h e g l o b a l
c h a l l e n g e
The increasing demand for fossil fuels, despite their proportional decline, poses a major challenge for the Government of Malaysia. Given the continuation of existing trends, the power sector was forecast to increase GHG emissions by 30% between 1995 and 2005. The two other ongoing UNDP-GEF funded Malaysian Industrial Energy Efficiency Improvement Project (MIEEIP) and the Building Integrated
Photovoltaics (BIPV) are the manifestation of Malaysia’s commitment to reduce GHG emissions. The Biogen project aims to further mitigate these by progressively replacing fossil fuels used in electricity generation mix with renewable energy resources, especially utilising wastes from the palm oil industry.
In 2001, in a significant step towards encouraging and intensifying the utilisation of renewable energy (RE) in power generation, the Malaysian government launched the Small Renewable Energy Power (SREP) programme. The objective was to encourage the private sector to undertake small power generation projects using renewable resources including biomass, biogas, municipal waste, solar, mini-hydro, and wind energy.
As recently as 2004, the programme was not progressing well due to the uncertainty of long-term fuel supplies, long negotiation of the Renewable Energy Power Purchase Agreement (REPPA) and difficulty in securing loans to finance the projects. However, in 2005, the first grid connected biomass-based power plant in Malaysia,
Energy Source Petajoules Per cent of Total Average Annual Growth Rate (%)
Petroleum products Natural gas
Electricity Coal and coke
Total
Per capita
consumption2
1 Malaysia Plan 2 Gigajoules Source: Ninth Malaysia Plan 2006-2010.
820.0 161.8 220.4 41.5 1,243.7 52.9 1,023.1 246.6 310.0 52.0 1,631.7 62.2 1,372.9 350.0 420.0 75.0 2,217.9 76.5 65.9 13.0 17.7 3.4 100.0 62.7 15.1 19.0 3.2 100.0 61.9 15.8 18.9 3.4 100.0 4.5 8.8 7.1 4.6 5.6 3.3 6.1 7.3 6.3 7.6 6.3 4.2
2000 2005 2010 2000 2005 2010 8MP1 9MP2
TSH Bio-Energy Sdn Bhd, commenced operations in Sabah which has an installed capacity of 14 MW where 10MW is for the grid-connection.
Under the SREP guidelines, maximum power export capacity of a small RE plant for sale to the grid is limited to 10 MW, although a plant’s overall capacity may be larger. The Special Committee on RE (SCORE), set up under the Ministry of Energy, Water and Communications, coordinates the implementation of the SREP applications and also formulates government’s strategy to intensify the development of RE as the country’s fifth fuel resource. A technical secretariat was also set up at the Energy Commission (Suruhanjaya Tenaga) to help facilitate the industry’s participation in the programme.
The status of generating power from renewable energy sources is immense (Table 3), and by far the most easily accessible and cost-effective feed-stock is readily available in the form of palm oil residues. Traditionally palm oil mills have utilized a proportion of this material to generate the requisite heat and power for extracting oil from the fruit, but huge additional quantities of residues pose a serious disposal problem for the industry. Efficient methods of generating CHP to meet operating requirements, plus a surplus of electricity utilizing the surplus renewable residues for export to the national grid, represents a double benefit for the industry and for the country, while assisting in the reduction of emissions from fossil fuels. In addition, palm oil itself is already being used on a small scale as a biofuel supplement to fossil fuels and more efficient technologies are being developed
for this purpose. The palm oil industry therefore has considerable potential for supporting the economy through the provision of renewable energy as well as through the traditional export of agricultural commodities.
Source: MEWC, 2006.
Broad Category Biomass Landfill gas Mini hydro Total
– empty fruit bunches – wood waste – rice husks – municipal waste
15 1 1 4 3 23 47 103.2 6.6 10.0 25.0 6.0 93.2 244.0 42.3 2.7 4.1 10.2 2.4 38.2 100.0
Specific type of renewable energy
Number of projects
Capacity (MW) for grid connection
[image:23.651.245.554.184.335.2]Contribution % Table 3 Status of SREP project, July 2006
The first grid connected biomass based power plant in Malaysia started commercial operation early in 2005. TSH Bio-Energy Sdn Bhd, located in Tawau, Sabah, has an installed capacity of 14 MW and is contracted to sell 10MW to Sabah Electricity Sdn Bhd (SESB) for 21 years. The cogeneration plant processes palm oil milling residues (mainly empty fruit branches) as fuel.
T h e f i r s t g r i d - c o n n e c t e d b i o m a s s p o w e r p l a n t
The Energy Commission (Suruhanjaya Tenaga) was established under the Energy Commission Act 2001 to regulate the electricity supply and piped gas supply industries in Peninsular Malaysia and Sabah, whilst in Sarawak the state Chief Electrical Inspectorate is the regulator of the electricity supply industry under the Electricity Ordinance of Sarawak. It acts as the SREP technical secretariat.
T h e u s e s a n d p o t e n t i a l o f
p a l m o i l
Palm oil is the second most traded vegetable oil crop in the world after soy, and over 90% of the world’s palm oil exports are produced in Malaysia and Indonesia. Palm
oil is still mostly used as an ingredient in the manufacture and further processing of food products (Box 2), but many other uses are becoming increasingly important. In the twenty-first century, concern for serious environmental issues is offering new
Palm oil can be used –
As an edible oil:
– a high quality cooking oil
– a component of oil-based fats and margarine used in baking
– an ingredient in wide range of cooking materials, dairy fat substitutes, milks and ice creams – a fat ingredient in animal feed
As an ingredient for non-edible uses:
– soaps
– biodegradable detergents
– oleochemical products (fatty esters, fatty alcohol, fatty nitrogen compounds, glycerol)
For non-edible applications:
– drilling mud for the oil industry – metallic soaps for the manufacturing of – epoxidated oil as a plastifier and lubricating greases and metallic driers
sterilizer in the plastics industry (PVC) – fuels
– gum – greases for lubrication and protection – candles – cold rolling presses in steel making – cosmetics – tinplate rolling
– printing inks – acids to lubricate fibres in the textile industry
Box 2 Uses of palm oil
opportunities for diversification of oil palm products. In particular, palm oil based biofuel provides a high quality supple-mentary fuel for blending with fossil fuels such as petroleum to help meet the growing renewable energy demand emerging in developed countries, especially those of the European Union. Nor is this the only contribution the industry can make to renewable energy: as noted earlier, residue biomass from milling greatly exceeds the quantities required for heat and power to carry out palm oil processing, and the surplus residues can be utilized to generate electricity for the national grid.
P a l m o i l p r o d u c t i o n
a n d t r a d e
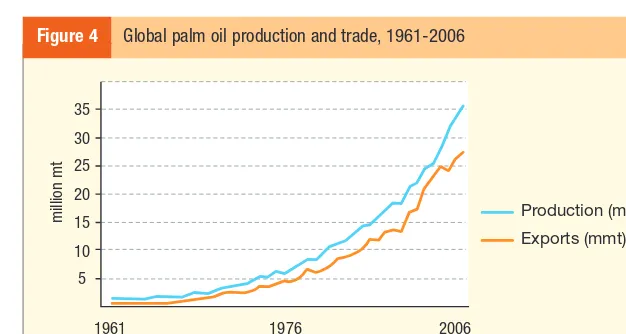
Global palm oil production and trade have risen steeply and continuously (Figure 4) from the 1970s onwards, with average growth rates achieved by oil palm substantially exceeding those of other oils and fats. Factors that explain the interest of the global marketplace in palm oil include: •the high level of substitutability with other
soft oils;
•a high melting point and a low content
of trans fatty acids, of special appeal to the food industry;
•reconfirmed health benefits, notably as a
rich source of carotenoids.
As a consequence, the share of palm oil in global vegetable oil production more than doubled in the period 1983-2003. This development was accompanied by a strong rise in both the share and overall consumption of palm oil in the global vegetable oil market (Figure 5).
The main competitor for palm oil is soy
oil. Only in very recent years has the global output of palm oil matched that of soy, whereas for trade, global shipments of palm oil surpassed soy oil in the mid-1970s, and in 2006 palm oil exports were almost double those of soy oil (Figure 6).
A further distinctive feature of palm oil is its very high trade-to-production ratio, which refers to the amount of global production that enters international trade. The ratio for palm oil greatly exceeds that
Exports (mmt) 30 35 20 15 10 1961 mi llion m t 1976 2006 5 25 Production (mmt)
[image:25.651.241.554.170.337.2]Source: Thoenes, P. (2007) Biofuels and Commodity Markets – Palm Oil Focus, FAO, Fig. 1. Figure 4 Global palm oil production and trade, 1961-2006
Source: Thoenes, P. (2007) Biofuels and Commodity Markets – Palm Oil Focus, FAO, Fig. 2.
Production Pe rcent Exports 7 6 5 4 3 2 Palm oil Soy oil
[image:25.651.242.553.367.560.2]Total oils and fats
M A L A Y S I A G E N E R A T I N G R E N E W A B L E E N E R G Y F R O M P A L M O I L W A S T E S
for other oils and fats, oilseeds and other crops in general. This is particularly significant given that just two countries – Malaysia and Indonesia – account for about 90% of both global production and global trade in palm oil.
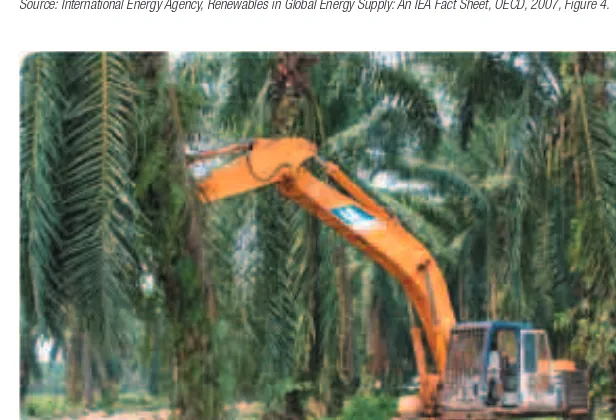
O i l P a l m I n d u s t r y a n d
t h e E n v i r o n m e n t
Throughout its entire development in Malaysia, the oil palm industry has always been linked to the environment. As it is a very land intensive industries, any unplanned development will lead to the degradation of the forest systems (primary or secondary), loss of habitats (plants and animals), extreme land degradation and pollution (water and airborne) due to the use of large quantities of pesticides and herbicides required to maintain the plantation. Besides that, the mills too produce wastes mainly from the EFB and palm oil mill effluent. As such, with the support from the government and MPOC, the Roundtable for Sustainable Palm Oil (RSPO) was established. RSPO consists of palm oil producers, processors, traders, consumer goods manufacturers, retailers and non-governmental organizations (NGOs) and is tasked to develop the principles and criteria of a sustainable palm oil industry, and facilitate the development of sustainable palm oil production. Among the proposed guidelines include commitment to transparency, compliance with all applicable local, national and ratified international regulations, adoption of sustainable cultivation practices (including water management, pesticide control and soil erosion), conservation of resources and
biodiversity and community development. Nevertheless, the industry has long avoided the openings of virgin forest land, which thus minimize environment degradation and enhance the sustainability of oil palm growing. In addition to the current initiatives, the RM20 million Malaysian Palm Oil Conservation Fund (MPOCF) was announced by MPIC in 2006, aims to help protect affected wildlife (including orang utan and other protected species) and to sustain biodiversity conservation programmes that are expected to be beneficial to both the industry and society.
40
30
20
10
0
1961 1976 2006 Palm oil
Global Production
Soybean oil
30
20
15
10
0
1961 1976 2006
Global Trade
5 25
[image:26.651.239.552.169.500.2]Source: Thoenes, P. (2007) Biofuels and Commodity Markets – Palm Oil Focus, FAO, Fig. 6.
The oil palm is indigenous to West Africa, but the development of oil palm as a plantation crop started in Southeast Asia. Experimental planting began in Peninsular Malaysia in the late nineteenth century and the first commercial oil palm estate was established in Selangor in 1917. During the plantation development phase to about 1960, expansion was relatively slow reaching about 55,000 ha and, primarily because of processing difficulties, cultivation was not widely undertaken by smallholders. Large-scale expansion commenced during the 1960s, mainly in response to the government’s diversifi-cation policy which aimed to reduce the dependence of the national economy on
natural rubber. Rubber prices were
continuing to decline, there was mounting competition from synthetic rubber, and the demand for edible oils was expanding.
M o d e r n c o m m e r c i a l
d e v e l o p m e n t
Expansion of processing plant in the estate sector and the establishment of processing cooperatives, together provided the means for efficient processing of both plantation and smallholder palm oil production. The Federal Land Development Authority (FELDA) was a key player in the government’s implementation of its diversification and smallholder land settlement policies and is still the largest producer in the industry, owning over 16% of the total planted area (Table 4).
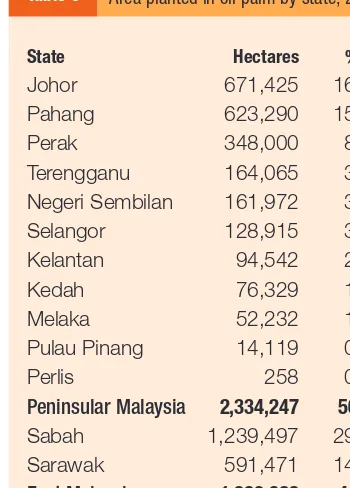
All states in Malaysia produce palm oil but there is wide variation in the crop’s distribution. Over 75% of total area planted is located in just four states, Sabah, Johor, Pahang and Sarawak, each of which has over half a million hectares under cultivation. Of the 4,165,215 ha planted in 2006, 3,703,254 or 88.9% is classified as ‘mature’ and in production (Table 5 and 6).
As a front runner in the development of the oil palm industry, Malaysia has had to develop many of the agricultural and industrial technologies required for the oil palm industry to succeed, including a significant R&D capability. For many decades this relied primarily on the ability of the larger companies to carry out their own research.
In 2005, Malaysia’s total land area had – • 59.5% under forest • 12.3% planted in
oil palm
• 7.1% planted in other agricultural crops
Source: MPOB (2007) Review of the Malaysian Oil Palm Industry 2006, Table 3. Ownership Private estates FELDA FELCRA RISDA State agencies Smallholders Total 2,476,135 669,715 159,780 81,169 323,520 454,896 4,165,215 59.4 16.1 3.8 2.0 7.8 10.9 100.0 Hectares % Table 4 Area planted in oil palm by ownership,
M A L A Y S I A G E N E R A T I N G R E N E W A B L E E N E R G Y F R O M P A L M O I L W A S T E S
Experimentation enabled these companies to enhance their planting materials, carry out agronomic trials, conduct pest and disease research, and design machines for mechanizing some field operations.
The processing of oil palm products occurs in palm kernel crushing factories, oleochemical plants, and palm oil refineries, but by far the most common are the basic palm oil mills. With the plantations they serve, these mills form the fundamental operational units and the basis of this important Malaysian export industry that supplies global markets and has the capability of contributing very significantly to the reduction in GHGs through expanded production of biofuels and biomass based generation of power.
In 1979, the Malaysian government established the Palm Oil Research Institute of Malaysia (PORIM), which was charged with the responsibility of generating information, increasing production and processing efficiency, and expanding uses of palm oil through research and development. This function was taken over by the Malaysian Palm Oil Board (MPOB) when earlier agencies were amalgamated
and is partly funded from a research cess imposed on palm oil millers. Efforts are made to ensure that R&D in the MPOB is in line with the industry’s needs and that research findings are disseminated to the industry and offered for commercialisation.
Source: MPOB (2007) Review of the Malaysian Oil Palm Industry 2006, Tables 2 and 4.
[image:28.651.248.423.381.625.2]State Johor Pahang Perak Terengganu Negeri Sembilan Selangor Kelantan Kedah Melaka Pulau Pinang Perlis Peninsular Malaysia Sabah Sarawak East Malaysia MALAYSIA 671,425 623,290 348,000 164,065 161,972 128,915 94,542 76,329 52,232 14,119 258 2,334,247 1,239,497 591,471 1,830,968 4,165,215 16.1 15.0 8.4 3.9 3.9 3.1 2.3 1.8 1.2 0.3 0.0 56.0 29.8 14.2 44.0 100.0 Hectares % Table 6 Area planted in oil palm by state, 2006 Energy Source
Operating Inoperative Planned
Total
1 Tonnes FFB/year 2 Tonnes/year 3 Tonnes kernel/year 4 Tonnes/year Source: MPOB (2007) Review of the Malaysian Oil Palm Industry 2006, Tables 7-10.
397 7 21 425 86,243,600 588,000 3,936,000 88,638,400 517 3 12 66 18,506,400 120,000 4,568,800 23,195,200 38 8 7 53 5,144,100 453,500 690,000 6,287,600 17 0 3 20 2,466,971 0 222,000 2,688,971
Palm oil mills1
No. Capacity No. Capacity No. Capacity No. Capacity Palm oil refineries2 Palm kernel crushing factories3 Oleochemical plants4
The Biogen project is jointly funded by the Government of Malaysia (GoM), the United Nations Development Programme (UNDP), the Global Environment Facility (GEF), and the Malaysian private sector. Pusat Tenaga Malaysia (PTM) is the implementing agency under the executing agency, the Ministry of Energy, Water and Communications (MEWC).
P r o j e c t s t r a t e g y
The Biogen project strategy involves a number of activities and deliverables that aim to remove barriers to the utilisation of commercially viable biomass based power generation through CHP production in palm oil mills. The ultimate desired outcome is the implementation of a demonstration scheme showcasing a full scale model (FSM) of biomass based power generation with CHP in conjunction with a POME derived biogas system. While biomass utilisation
is well established, the project is intended to have a capacity building outcome, encouraging a substantial increase in bio-mass based power generation.
Central to the project strategy is the establishment of an institutional awareness, responsibility and capacity within the Government of Malaysia as represented by MEWC, PTM and MPOB for identifying and removing barriers to the implementation of
Sabah Terengganu
SOUTH CHINA SEA
Perlis Kedah
Pulau Pinang
Selangor
N. Sembilan Kuala Lumpur
Melaka Johor
Pahang
Sarawak
Map 1 Graphical representation of the palm oil processing plants, 2006
The broad objective of the Biogen project is the reduction in the growth rate of greenhouse gas emissions from fossil fuel fired activities and from the decomposition of unused biomass waste from palm oil mills (Map 1). This is to be achieved through the removal of the major barriers to the development of biomass based combined heat and power projects to supplant part of the current fossil fuel electricity generation in Malaysia. Explicitly, the aim of the Biogen project is to reduce the growth rate of greenhouse gas emissions from fossil fired combustion processes by 3.8% by the end of 2008.
these measures in the Malaysian palm oil industry. On the technical and business side, capacity will be established for specialist support and financial assistance. PTM, Bank Pembangunan Malaysia Bhd, and MPOB were designated as the agencies responsible for particular aspects, with the institutional focus located in PTM which has a coordinating role for the project.
T h e a n t i c i p a t e d c o n t r i
-b u t i o n o f r e n e w a -b l e
e n e r g y s o u r c e s t o p o w e r
g e n e r a t i o n
As noted earlier, Malaysia has abundant biomass waste resources coming mainly from palm oil, wood and agricultural industries. At the time of the initiation of the project in 1999, a total capacity of about
665 MW was to be expected if the estimated overall potential of about 20.8 million tonnes of biomass residues from
these main sources plus the 31.5 million m3
of palm oil effluents (POME), were used for power generation and cogeneration.
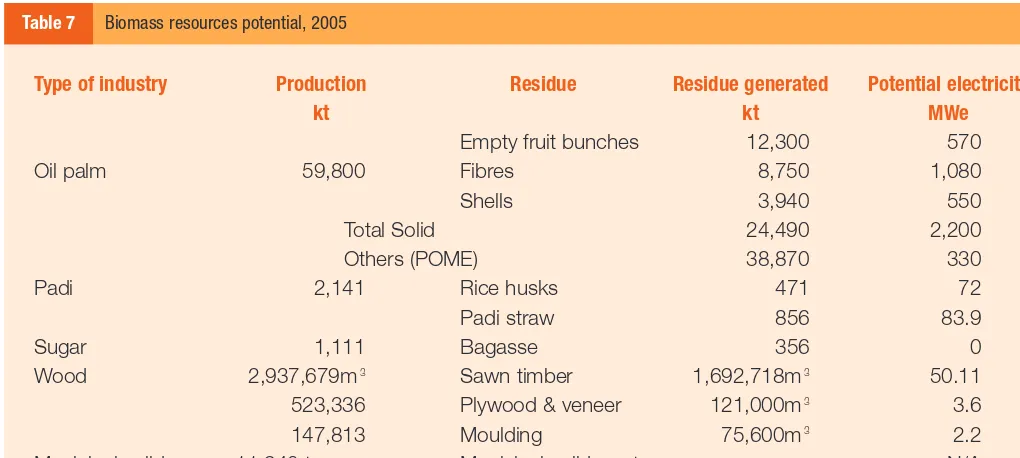
These quantities of biomass have expanded significantly since the project’s rationale was developed, as shown for 2005 in Table 7. From those data it is estimated that a total of about 2,500 MW capacity can be expected if all potential of the 25 million tonnes of biomass residues from these main
sources, in addition to the 39 million m3
of palm oil mill effluents (POME), is used for power generation and cogeneration. In terms of additional potential, there is also a substantial amount of unexploited biomass waste in the form of logging residues, rice straw, palm tree trunks and other residues.
Type of industry
Oil palm Padi Sugar Wood Municipal solid waste
Note:Waste from rice mills is mainly rice husks; palm oil mill waste includes empty fruit bunches; wood waste comprises chips, shavings and sawdust. Palm trunk and fronds, and logging waste left in the cutover forest areas are not included. The potential annual electricity production and power generation capacity were computed on the assumption that all the available biomass resources listed were fully utilized.
Source: PTM, Comprehensive Biomass Study, 2005.
59,800 2,141 1,111 2,937,679m3 523,336 147,813 11,940 tonnes per day Total Solid Others (POME)
Empty fruit bunches Fibres Shells Rice husks Padi straw Bagasse Sawn timber Plywood & veneer Moulding
Municipal solid waste
12,300 8,750 3,940 24,490 38,870 471 856 356 1,692,718m3 121,000m3 75,600m3 570 1,080 550 2,200 330 72 83.9 0 50.11 3.6 2.2 N/A Production kt
Residue Residue generated kt
[image:30.651.43.553.484.713.2]Potential electricity MWe Table 7 Biomass resources potential, 2005
These additional biomass residues could further supplement future biomass based power generation if required.
The palm oil industry accounts for the largest biomass waste production in Malaysia, and since the 1960s, all palm oil mills have depended on their own biomass wastes for fuel, mainly the palm kernel shells and mesocarp fibres. Not only does palm oil industry waste, including POME, represent the largest potential for biomass energy utilisation in the country, but this resource is readily available and in need of an efficient and effective means of disposal. When the project was being planned, most of these residues were disposed of through incineration and dumping, with only a very small proportion being used by the mills in a rather inefficient manner for their own heat and power requirements. However, the government has banned the incineration of biomass waste (mainly empty fruit bunches or EFB), and so the mills are obliged to find alternative means of disposing of the unutilized waste.
Other value-added uses of the waste have been investigated with varying degrees of success, but commercialisation of these is not imminent. While palm oil mills with plantations can use their solid biomass waste for mulching and soil conditioning or fertiliser, those without plantations are considering generating electricity that they can sell to the national utility grid. Although palm oil mills are aware of the potential of biogas generated from the biodegradation of POME, they are not currently utilising this gas as there is no requirement to do so and there is little local experience in handling it.
I m p l e m e n t i n g b i o m a s s a n d
b i o g a s s p o w e r g e n e r a t i o n
a n d c o g e n e r a t i o n
Since the palm oil mills have abundant biomass waste resources, their energy systems were designed to be cheap rather than efficient. Most of the existing biomass combustion systems in Malaysia utilize low efficiency low-pressure boilers where the overall cogeneration efficiency is less than 40%. An additional source of energy in palm oil mills is the biogas produced in the anaerobic decomposition (for wastewater treatment purposes) of palm oil mill effluent (POME). However, at that time, POME
derived biogas (mostly methane, CH4) was
• Palm oil millers
• Local boiler manufacturers • Power equipment suppliers • Project developers
• Local energy service industries • Engineering consulting firms • Financial and banking institutions • policy makers
M A L A Y S I A G E N E R A T I N G R E N E W A B L E E N E R G Y F R O M P A L M O I L W A S T E S
not being recovered and used but allowed to dissipate into the atmosphere.
Commercially proven technologies were available in the form of high-pressure boilers for efficient production of power and heat from the biomass resources available. Dual fired boilers capable of burning either diesel oil or natural gas were identified as most suitable for burning palm oil waste since they could also facilitate the use of POME derived biogas as a supplementary fuel.
K e y b a r r i e r s t o c h a n g e
Whilst the concept of biomass based CHP generation for sale to the grid or other consumers is well accepted, lack of experience and a number of barriers have hindered its development.
Key barriers to the development of CHP generation in Malaysia that the project was attempting to overcome, included the following:
•Lack of information services to promote
biomass energy development and its applications, which includes,
– a misconception that the technology is unproven;
– the belief that the industry lacks the requisite technical ability;
– the perception that use of biomass is regressive in a modernizing industrial economy;
– a belief that investors view the generation and sale of electricity as marginal to the core business of the industry.
•Absence of a clear mechanism on
re-newable energy technology development and applications despite the establishment of a broad regulatory framework.
•Lack of accessible and favourable
financing schemes because,
– in the absence of supporting policies and regulations it is difficult to gain funding support from financial institutions; – financing of projects based on
renewable energy technologies is an unfamiliar investment and perceived as high risk.
•Uncertain financial viability unless
reached, producing power for the utility grid would not be seen as an attractive business venture;
•Lack of successful models to
demon-strate viability as there were no precedents beyond the inefficient biomass fired CHP systems already operating in the palm oil and wood industries;
O p e r a t i o n a l u n c e r t a i n t i e s
•Biomass fuel supply relating to,
– reliability of the volume and quality of EFBs;
– seasonal nature of palm oil milling operations;
– absence of standard contract
procedures for the supply and pricing of EFBs.
•Minimum energy off-take that required,
– to achieve an availability factor of 90% to baseload allowing for maintenance and forced outages.
•Efficiency of deployment of biomass
based energy technology required, – review of current practices for
incineration of excess biomass; – greater sophistication of operation and
manpower skills, interconnection safety, synchronization devices and the more rigorous demands of grid electricity generation.
•Recovery of POME biogas for power
generation lacked incentives although millers were aware of the technology and there were no restrictions on the release of biogas into the atmosphere.
•Purchase of electricity by the national utility company and other REPPA issues required the clarification and resolution.
I m m e d i a t e o b j e c t i v e s
1. To provide adequate, affordable, accessible and up-to-date information services, continuing education, and awareness improvement on the application of renewable energy resources to prospective RE developers, policy makers and technology suppliers.
M A L A Y S I A G E N E R A T I N G R E N E W A B L E E N E R G Y F R O M P A L M O I L W A S T E S
3. To encourage the implementation, the government and financial community will provide financial assistance to the development of sustainable RE financing.
4. To facilitate the effective demonstration of the techno-economic viability, design, development, financing and sustainable operation and maintenance of biomass-based and biogas-biomass-based, grid-connected power generation and cogeneration projects.
5. To establish the potential and require-ments for the energy applications by providing sufficient support to the technology suppliers.
P l a n n e d o u t p u t s
The project was designed to address the barriers in the development and implementation of biomass-based, grid-connected power generation and CHP specifically in the Malaysian palm oil industry. To achieve this objective the project was organised into five components, each with its own set of outputs that comprised the blueprint to be followed by the participating agencies to achieve the objectives.
The major elements of each of the components proceeded concurrently from the launching of the project at the beginning of 2002, with the objective of completing the existing plans by early 2008. Whilst this account has emphasised some key barriers and operational uncertainties, many initiatives were being undertaken that
supported and facilitated the immediate objectives of the project culminating in the contractual arrangements to set up the two full scale demonstration models.
Component 1 Biomass information services and awareness enhancement
Outputs
~ Comprehensive biomass energy resource inventory
~ Biomass energy technologies and technology application database
~ Training courses on biomass energy technology
~ Integrated information dissemination programme
~ Biomass energy technology information exchange service
~ Renewable energy (RE) consultancy service industry development
Component 2 Biomass policy studies and institutional capacity building
Outputs
~ Biomass policy document and analysis ~ Biomass energy utilisation workshop series ~ RE electricity generation policy
~ RE electricity pricing
~ Small RE project (SREP) strategy
~ Clean Development Mechanism (CDM) implementation in RE project
~ RE electricity policy implementation evaluation
Component 3 Financial assistance for renewable energy projects
Outputs
~ Training for financial institutions on financing RE projects
~ Establishment of RE fund
~ Mechanism for the financing scheme ~ Criteria for selecting fund applicants ~ Arrangements for financial assistance for
RE projects
~ Evaluation of RE projects financing assistance programmes
Component 4 Demonstration schemes
Outputs
~ Biomass based power generation and CHP demonstration programme
~ Selection criteria for host demonstration companies
~ Suitable project demonstration sites ~ Baseline data for three dimensional sites ~ Specific demonstration programme
implementation requirements
~ Installation and implementation of design/ plans for first demonstration site
~ Financial and procurement assistance arrangements for demonstration scheme
Component 5 Technology development
Outputs
~ Assessment of other uses of biomass and biogas resources
~ Evaluation of the energy utilization performance of palm oil mills
~ Training for palm oil mill plant engineers and operators
~ Financial assistance to local equipment manufacturers
~ Assessment of capabilities of local steam and power generation equipment ~ Training on high efficiency designs and
production technologies
M A L A Y S I A G E N E R A T I N G R E N E W A B L E E N E R G Y F R O M P A L M O I L W A S T E S
F u l l s c a l e m o d e l
A full scale model (FSM) utilizing both biomass and biogas resources was planned as a major outcome of the Biogen project. This was seen as important because it would give a practical demonstration of the technology and processes being utilized and recommended in the project. During 2005, extensive planning occurred for the establishment of the first FSM, but some difficulties were experienced in gaining the requisite level of interest and support. (In attempting to identify suitable candidates for the first full scale demonstration model, similar issues arose to those that were making the industry at large reluctant to adopt CHP, namely: the relatively large scale of investment; a lack of financial depth to meet the equity requirements and an unattractive renewable energy tariff.)
Nevertheless, to facilitate the develop-ment of the first FSM, a number of major developments that had been ongoing since the beginning of the project were being brought to a conclusion. Notably, these included the finalizing of the Renewable Energy Power Purchase Agreement (REPPA), and the Renewable Energy Business Facility (REBF), both of which were essential for the contracting of an FSM operator.
In 2006, following a tendering process and evaluation of proposals submitted, instead of a single FSM, two companies were selected: MHES Asia Sdn Bhd to develop a biomass project as the first FSM; and FELDA Palm Industries Sdn Bhd (FPISB) for the biogas project as the second FSM. Schematic diagrams for typical biomass and biogas plants are represented in Figure 7 and 8.
The MHES Asia Biomass Power Plant, located in Bahau, Negeri Sembilan, will have a capacity of 13 MW and will utilize
Water Line Air Line Biomass Line Steam Line Raw Biomass Biomass Storage Water Reservoir Cooling Tower Pre-treatment (shredding and cutting into smaller fibres) Condenser Generator Steam Receiver Process Condensate Stack ID Fan FD Fan Air Heater
[image:36.651.240.554.170.678.2]Heated Air Dearator Chemical Dosing Feed Water Pump Water Drum Steam Drum Evaporator Superheated Furnace Bed Economizer Tu rbi n e
Figure 7 Schematic diagram of biomass power generation
Pome Fibre & other Solids Pre-Tank Heat Exchanger Digester (3600 m 33)
Digester (3600 m 33)
Digester (3600 m 33)
Gas Dewatering Well Secondary Digester Clarifier Sludge Sludge Decanter (Optional)
Fiber for Compost Final Discharge Band filter Liquid Aerobic Treatment Ft Ft Ft To pre-tank Gas Purifier Optional (Optional) Engine room Gas Flare
EFBs as fuel. The plant will sell 10MW of electricity to TNB for 21 years at the agreed REPPA price of between RM0.17/kWh to RM0.21/kWh. The power plant is scheduled for completion by early 2008.
The FPISB biogas project is to be located in Serting Hilir palm oil mill, also in Bahau, Negeri Sembilan, with the objective of utilizing methane-rich POME for power generation. The plant will have a power generation capacity of 500 kW, with plans for expansion after the first few years of operation if agreed by the national utility. The project, still at the planning stage in 2007, is estimated to reduce emissions by the equivalent of 45,000 tonnes of
CO2per year.
K e y a c h i e v e m e n t s
The finalization of the Renewable Energy Power Purchase Agreement (REPPA) pro forma
This is the official document to be used by transacting parties in processing loan
applications. Through the facilitation and inputs by the Biogen project, this output has been made possible with the close coordination and cooperation of the Government of Malaysia through MEWC, PTM, ST, TNB, and other relevant agencies. The REPPA represents the preparedness for commercialisation of renewable energy power.
REPPA is the legal document on the selling of electricity by renewable energy project developers and the purchase of electricity by the national utility companies (TNB/SESB). The rights and obligations of both parties cover the commercial and technical aspects governing the project implementation applicable throughout the lifetime of the agreement.
The Biogen project team was instrumental in reviewing the provisions of the agreement, customized for biomass power plants, and negotiating terms with the GoM, banking institutions and private sector stakeholders. Final details of the agreement, relating mainly to tariff, were in process with the FSM participants in 2007.
Establishment of the Renewable Energy Business Facility (REBF)
In 2005, the Biogen project established the first financing scheme for RE projects. The Renewable Energy Business Facility (REBF) uses funds available from the UNDP/ GEF, MESITA and BPMB, provided at 4% per annum for the FSM projects. The REBF paves the way for other funding mechanisms that will be administered through the facility.
Organization of the Biomass One-Stop Centre
The Biomass One-Stop Centre was established through the Biogen project in PTM. It provides services, including
consultancy, for biomass utilization
projects, information database, technical advisory, services, financing facilitation, and project identification.
Energy audits of selected palm oil mills
Eight mills were audited to assess their energy utilization and the possibility of improving current usage efficiency. These mills are also being assessed for connection to the grid for additional power supply from excess generation.
Different policy studies
These studies have been conducted in support of the government’s renewable energy programme. Their value lies in their contribu